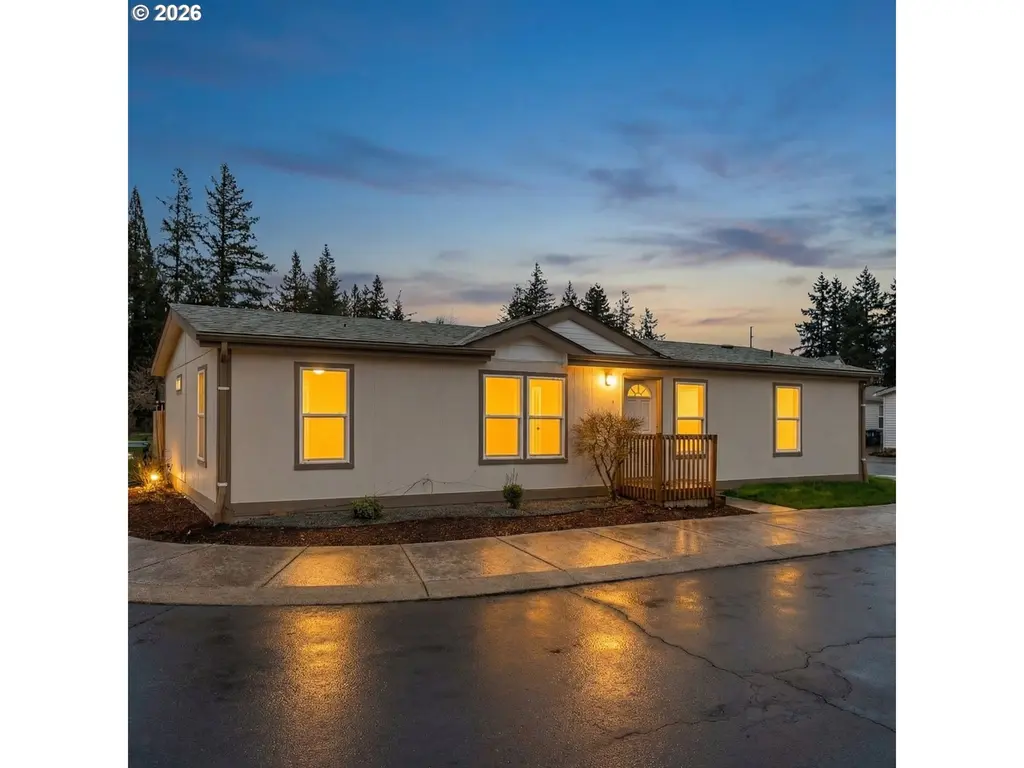
12323 SE Holgate Blvd #19 · Portland, OR
Flood risk 1/10 · Minimal
- FEMA flood zone
- X (unshaded)
- Chance of flooding over 30 yrs
- 0.0%
- Est. flood insurance / yr
- $507 – $1,088
Fire risk 3/10 · Minor
- Est. fire insurance / yr
- $498 – $926
Heat risk 3/10 · Minor
- Hot days now (above 92°F)
- 7 days/yr
- Hot days in 30 yrs
- 15 days/yr
Wind risk 1/10 · Minimal
- Chance of severe wind over 30 yrs
- —
Air-quality risk 10/10 · Severe
- Unhealthy air days now
- 23 days/yr
- Unhealthy air days in 30 yrs
- 27 days/yr
Risk factors via First Street. Map © Google.
Why this score? — see what drove the B- grade
The composite is a weighted blend of 9 inputs, each scored 0–100. Each bar is that input's sub-score; the figure is the points it added to the 100-point composite (weight × sub-score).
- Cash flow +30.0/30.0
- DSCR +10.0/10.0
- 1% rule +8.8/10.0
- Livability +3.9/5.0
- Schools +3.7/10.0
- ARV discount +3.6/15.0
- Rent growth +2.9/5.0
- Condition / age +2.5/5.0
- Appreciation +0.0/10.0
$142,000
🖨 Deal sheet 📄 Offer letter ✓ Due diligence
Listing remarks MLS
All-age park, this double-wide manufactured home has space rent of $1,050/month plus utilities. Recent updates include a new kitchen, new flooring, new carpet in the bedrooms, new windows fresh interior and exterior paint, updated bathrooms, new light fixtures, and new carbon monoxide detectors. Additional improvements include partial attic insulation replacement, partial siding replacement, new fascia, replaced outlets throughout the home, trim and baseboard replacement, and a serviced furnace. New appliances have also been installed.
Key facts
- New kitchen
- New flooring
- Updated bathrooms
Tags
Neighborhood map
What this means for you Summary
Snapshot
- This is a 3-bed/2.0-bath manufactured listed at $142k.
Deal economics
- At list price, monthly cash flow is $690 ($8k/yr) — positive.
- The deal already cash-flows at list — no discount required.
- Meets the 1% rule at list price ($2k rent vs $142k).
- Recommended offer: $129k (9.0% below list) — sets the bar for market timing.
- Cap rate 12.1% vs local median 2.2% in Portland — top-decile yield for the area; either an underpriced asset or a hidden risk that comps aren't pricing in. Stress-test before assuming the spread holds.
Location & tenants
- Location reads 77/100 on livability (#72 in OR, #3,256 nationally) — a middle-class / working-renter tenant base. Strengths: amenities A+, commute A+, health & safety A+; Watch: crime F, cost of living F.
- David Douglas SD 40 (urban): math 34% / reading 49% proficiency, ranked #99 of 183 in OR (top 54%) — families likely to look elsewhere, expect single-tenant / working-renter base with shorter leases; 68% free/reduced lunch — lower-income household profile, screen leases tightly.
- Market conditions: Rents rising (+1.6%/yr); 204 active listings in the ZIP; 40 comparable units currently listed for rent nearby; rentals at typical pace (median 24d on market — plan ~3-4 weeks tenant-placement turnaround); solid renter incomes; 2,041 units permitted in Multnomah County in 2024 (905 in 5+ unit buildings).
- This rent runs 31% of the median local income ($75k/yr) — at the standard rent-burdened threshold; future hikes will face affordability resistance.
Forward outlook
- Local home prices are declining (-3.0%/yr); year-one equity from $982 of loan paydown is wiped out by about $4k of value loss. Plan a longer hold.
- Multnomah County population projected at +33% by 2050 — long-run rental-demand tailwind backs the buy-and-hold thesis.
- At projected returns (-3.0% appreciation + 1.6% rent growth), your $40k cash investment doubles in ~7 years — after that, you're playing with house money.
Negotiation context
- It's been on market 109 days — a 9% lower offer ($129k) is reasonable based on typical stale-listing flexibility.
Questions for the listing agent
- It's been on market 109 days. Have you received any prior offers? Is the seller open to a 9% concession, seller financing, or rate buy-down credit?
- Why hasn't it sold? Are there any deal-killer items the seller is aware of (foundation, flood, title, zoning, code violations)?
- Is there a deadline driving the sale (1031 exchange, divorce, estate, relocation)? That informs how much negotiation room exists.
- Crime grade is F in this area — have there been break-ins, vandalism, or insurance claims at this property in the last 3 years? What carrier currently insures it and at what premium?
- What's the average days-on-market for RENTAL listings here right now (not sales)? A rising rental-DOM trend means longer vacancies and softer asking-rent achievability than the comps imply.
- What's the recent tenant-quality profile in this submarket — average credit score on applications, eviction rate, late-payment / NSF rate, and stable-employment percentage? A property-management company in the area should have these aggregated.
- How much new for-sale + rental construction is in the pipeline within 1–3 miles? Heavy new supply typically softens prices + rents 12–24 months out; constrained supply supports both.
Investment metrics
- 1% rule
- 1.38% ✓
- Cap rate
- 12.12%
- Cash-on-cash
- 20.83%
- DSCR
- 1.93
- GRM
- 6.1
CMA / ARV
- ARV (median comp)
- $130,769
- List price
- $142,000
- Delta
- 8.59%
- Verdict
- FAIR
- Comps
- 14 within 1.0 mi
Show comp detail 11 sales within ~0.75 mi
| Address | Dist | Beds/Ba | Sqft | Sold | Price | $/sf | Match |
|---|---|---|---|---|---|---|---|
| 12323 SE Holgate Blvd #2 | 0.00mi | 3/2.0 | 1,296 (+0%) | 1mo | $118,000 | $91 | 98 |
| 12323 SE Holgate Blvd #6 | 0.00mi | 4/2.0 (+1) | 1,404 (+9%) | 4mo | $150,000 | $107 | 77 |
| 13517 SE Pardee Dr | 0.58mi | 3/2.0 | 1,296 (+0%) | 3mo | $96,905 | $75 | 70 |
| 13446 SE Schiller St | 0.59mi | 3/2.0 | 1,248 (-3%) | 6mo | $89,850 | $72 | 62 |
| 12146 SE Rhone St | 0.34mi | 3/2.0 | 1,170 (-9%) | 9mo | $410,000 | $350 | 62 |
| 4223 SE 136th Ave #2 | 0.58mi | 3/2.0 | 1,296 (+0%) | 14mo | $130,000 | $100 | 61 |
| 13539 SE Pardee Dr #12 | 0.62mi | 3/2.0 | 1,344 (+4%) | 13mo | $145,000 | $108 | 53 |
| 5200 SE 132nd Ave #24 | 0.62mi | 3/2.0 | 1,296 (+0%) | 21mo | $100,000 | $77 | 53 |
| 5200 SE 132nd Ave | 0.62mi | 3/2.0 | 1,404 (+9%) | 4mo | $90,000 | $64 | 53 |
| 4903 SE 133rd Dr #65 | 0.57mi | 3/2.0 | 1,188 (-8%) | 10mo | $111,679 | $94 | 52 |
| 4808 SE 134th Dr | 0.61mi | 3/2.0 | 1,152 (-11%) | 4mo | $50,000 | $43 | 50 |
Match score weights: distance 35% · size 25% · config 20% · recency 20%. Top-matched comps best support the ARV.
Projected returns pro-forma
-3.0% appreciation · 1.64% rent growth · sell at horizon
- IRR
- 11.8%
- Equity multiple
- 1.46×
- Total profit
- $18,257
- Equity at exit
- $21,173
- IRR
- 19.7%
- Equity multiple
- 2.55×
- Total profit
- $61,764
- Equity at exit
- $12,278
Cash invested: $39,760 (down + closing). Projections, not guarantees.
Landlord ↔ Tenant lean methodology
- Overall (CITY)
- 0 Strongly Tenant-Friendly
- State Oregon
- 28 Tenant-Leaning · D+6
- County
- — inherits STATE
- City Portland
- 0 Strongly Tenant-Friendly · D+39
ZIP-level market 97236
- Rents YoY
- 1.6%
- Active inventory
- 204
- Price-to-rent
- 6.1×
Monthly cashflow live
- Estimated rent
- $1,953 high interval (Pro) →
- Mortgage (P&I)
- −$745
- Tax from tax record
- −$49 /mo · $589/yr
- Insurance
- −$59
- HOA
- −$0
- Vacancy / Maint / Mgmt
- −$410
- Net cashflow
- $690
Break-even live
UW: 25.0% down · 7.5% · 30yr · 1.5% tax · 5.0% vac · 8.0% maint · 8.0% mgmt
Financing live
Cash to close
- Down payment
- $35,500
- Closing costs
- $4,260
- Reserves months
- —
- Total cash needed
- —
Loan-product check · same deal, 3 products live
Conventional
25% down · 7.5% · 30yr
- Down + closing
- —
- Monthly P&I
- —
- Monthly cashflow
- —
- DSCR
- —
- Eligible?
- —
Personal DTI + credit; lowest rate.
DSCR
20% down · 8.5% · 30yr
- Down + closing
- —
- Monthly P&I
- —
- Monthly cashflow
- —
- DSCR
- —
- Eligible?
- —
No personal income docs; deal must DSCR.
Hard money
10% down · 12.0% · 12mo
- Down + closing
- —
- Monthly P&I
- —
- Monthly cashflow
- —
- DSCR
- —
- Eligible?
- —
Short-term bridge; refi at stabilization.
Rent comps 40 comps
| Address | Beds | Baths | Sqft | Rent | $/sqft | DOM | Units | Dist |
|---|---|---|---|---|---|---|---|---|
| 4300 SE 122nd Ave Unit 146-4308 Portland, OR | 2.0 | 1.0 | 950 | $1,399 | $1.47 | 43d | 1 | 0.08mi |
| 4257 SE 122nd Ave Portland, OR | 2.0 | 2.0 | 946 | $1,375 | $1.45 | 3d | 1 | 0.12mi |
| 4904 SE 122nd Ave Portland, OR | 3.0 | 3.0 | 1504 | $4,400 | $2.93 | 43d | 1 | 0.25mi |
| 12231 SE Bush St Unit 83 Portland, OR | 2.0 | 2.0 | 930 | $1,450 | $1.56 | 23d | 1 | 0.33mi |
| 12008 SE Bush St Portland, OR | 2.0 | 2.0 | 1036 | $1,700 | $1.64 | 43d | 1 | 0.34mi |
| 3745-3749 SE 127th Pl Unit 3749 Portland, OR | 3.0 | 2.5 | 1467 | $2,195 | $1.50 | 7d | 1 | 0.37mi |
| 3810 SE 117th Pl Portland, OR | 3.0 | 2.5 | 1378 | $2,445 | $1.77 | 23d | 1 | 0.40mi |
| 3540 SE 119th Ave Unit 4 Portland, OR | 2.0 | 2.0 | 900 | $1,550 | $1.72 | 23d | 1 | 0.48mi |
| 12550 SE Powell Blvd Portland, OR | 1.0–3.0 | 1.0–2.0 | 1075 | $2,300 | $2.14 | 2d | 2 | 0.49mi |
| 3315 SE 127th Pl Unit 1 Portland, OR | 2.0 | 1.0 | 1346 | $1,595 | $1.18 | 11d | 1 | 0.57mi |
| 13066 SE Powell Blvd Unit 10 Portland, OR | 2.0 | 2.0 | 1100 | $1,550 | $1.41 | 23d | 1 | 0.59mi |
| 3223 SE 122nd Ave Unit A-B Portland, OR | 4.0 | 2.5 | 1572 | $2,495 | $1.59 | 43d | 1 | 0.61mi |
| 13062 SE Powell Blvd Apt 6 Portland, OR | 2.0 | 2.0 | 1100 | $1,550 | $1.41 | 43d | 1 | 0.62mi |
| 3883 SE 136th Ave Portland, OR | 4.0 | 2.5 | 1660 | $2,400 | $1.45 | 43d | 1 | 0.63mi |
| 11041 SE Holgate Blvd Portland, OR | 2.0 | 2.5 | 1048 | $1,795 | $1.71 | 23d | 1 | 0.64mi |
| 13436 SE Bush St Portland, OR | 2.0–3.0 | 1.5–2.0 | 1075 | $1,995 | $1.86 | 43d | 1 | 0.65mi |
| 3224 SE 134th Ave Portland, OR | 2.0 | 1.0 | 965 | $1,450 | $1.50 | 2d | 1 | 0.66mi |
| 11069 SE Bush St Unit A Portland, OR | 2.0 | 2.0 | 1034 | $1,900 | $1.84 | 16d | 1 | 0.75mi |
| 5329 SE 137th Ave Portland, OR | 3.0 | 2.5 | 1559 | $2,250 | $1.44 | 23d | 1 | 0.76mi |
| 2931 SE 119th Ave Unit A Portland, OR | 2.0 | 1.0 | 1000 | $1,695 | $1.70 | 21d | 1 | 0.78mi |
| 5344 SE 137th Ave Portland, OR | 3.0 | 2.5 | 1600 | $2,395 | $1.50 | 17d | 1 | 0.79mi |
| 10752 SE Holgate Blvd Portland, OR | 2.0 | 1.0 | 974 | $1,450 | $1.49 | 43d | 1 | 0.80mi |
| 12616 SE Taggart St Portland, OR | 3.0 | 1.5 | 1329 | $2,295 | $1.73 | 7d | 1 | 0.81mi |
| 5010 SE 108th Ave Portland, OR | 3.0 | 2.0 | 1400 | $2,350 | $1.68 | 43d | 1 | 0.85mi |
| 6130 SE 128th Ave Apt B Portland, OR | 3.0 | 2.0 | 1500 | $1,999 | $1.33 | 7d | 1 | 0.86mi |
| 13746 SE Powell Blvd Portland, OR | 2.0–3.0 | 1.0 | 763 | $1,325 | $1.74 | 3d | 2 | 0.88mi |
| 3228 SE 136th Ave Portland, OR | 2.0–3.0 | 1.5 | 1058 | $1,597 | $1.51 | 4d | 4 | 0.88mi |
| 2658 SE 125th Ave Unit 2654 Portland, OR | 3.0 | 2.5 | 1378 | $2,195 | $1.59 | 3d | 1 | 0.89mi |
| 13726 SE Reedway St Portland, OR | 3.0 | 2.5 | 1817 | $2,295 | $1.26 | 43d | 1 | 0.89mi |
| 12941 SE Foster Rd Portland, OR | 1.0–2.0 | 1.0–2.0 | 925 | $1,595 | $1.72 | 43d | 2 | 0.89mi |
| 3208 SE 136th Ave Unit 45 Portland, OR | 2.0 | 1.5 | 900 | $1,397 | $1.55 | 23d | 1 | 0.90mi |
| 3208 SE 136th Ave Unit 3 Portland, OR | 3.0 | 1.5 | 1217 | $1,597 | $1.31 | 23d | 1 | 0.90mi |
| 12509 SE Foster Rd Unit 243-29C Portland, OR | 2.0 | 1.0 | 885 | $1,585 | $1.79 | 23d | 1 | 0.91mi |
| 12509 SE Foster Rd Unit 24341-C Portland, OR | 2.0 | 1.0 | 885 | $1,585 | $1.79 | 3d | 1 | 0.91mi |
| 2639 SE 119th Ave Unit 2639 Portland, OR | 2.0 | 1.0 | 900 | $1,350 | $1.50 | 16d | 1 | 0.92mi |
| 2605 SE 119th Ave Unit 2605 Portland, OR | 3.0 | 1.5 | 1100 | $1,800 | $1.64 | 21d | 1 | 0.94mi |
| 12923 SE Foster Rd Portland, OR | 2.0–3.0 | 2.0 | 1037 | $2,100 | $2.03 | 14d | 3 | 0.94mi |
| 11908 SE Foster Rd Portland, OR | 3.0 | 2.0 | 1300 | $2,595 | $2.00 | 43d | 1 | 0.97mi |
| 13938 SE Powell Blvd Unit 2 Portland, OR | 2.0 | 1.0 | 900 | $1,535 | $1.71 | 43d | 1 | 0.98mi |
| 5524 SE 140th Pl Portland, OR | 4.0 | 3.0 | 1584 | $3,050 | $1.93 | 17d | 1 | 0.99mi |
Listing history 13 events
-
2026-06-15days on market $142,000 Active 109 DOM
-
2026-06-13days on market $142,000 Active 107 DOM
-
2026-06-09days on market $142,000 Active 103 DOM
-
2026-06-08days on market $142,000 Active 102 DOM
-
2026-06-07remarks 632-char remark
-
2026-06-07days on market $142,000 Active 101 DOM
-
2026-06-05days on market $142,000 Active 98 DOM
-
2026-06-03days on market $142,000 Active 97 DOM
-
2026-06-02days on market $142,000 Active 96 DOM
-
2026-06-01days on market $142,000 Active 95 DOM
-
2026-05-31days on market $142,000 Active 94 DOM
-
2026-05-07price $142,000 541-char remark
Show marketing remark (541 chars)
All-age park, this double-wide manufactured home has space rent of $1,050/month plus utilities. Recent updates include a new kitchen, new flooring, new carpet in the bedrooms, new windows fresh interior and exterior paint, updated bathrooms, new light fixtures, and new carbon monoxide detectors. Additional improvements include partial attic insulation replacement, partial siding replacement, new fascia, replaced outlets throughout the home, trim and baseboard replacement, and a serviced furnace. New appliances have also been installed.
-
2026-02-26$145,000 Active 541-char remark
Show marketing remark (541 chars)
All-age park, this double-wide manufactured home has space rent of $1,050/month plus utilities. Recent updates include a new kitchen, new flooring, new carpet in the bedrooms, new windows fresh interior and exterior paint, updated bathrooms, new light fixtures, and new carbon monoxide detectors. Additional improvements include partial attic insulation replacement, partial siding replacement, new fascia, replaced outlets throughout the home, trim and baseboard replacement, and a serviced furnace. New appliances have also been installed.
ⓘ Source: listings_history table (triggers on properties + properties_extension) + one-shot
backfill from property_details.listing_events for pre-trigger history.
Tax reassessment forecast OR · Resets to sale price
- Current annual tax
- $589 · $49/mo
- Projected year-2 tax
- $1,377 · $115/mo
- Expected delta
- +$789/yr (+$66/mo · 134.0%)
ⓘ Screening estimate from a state-policy table — verify with the county assessor before closing.
Climate risk First Street
- Flood 1/10 Low FEMA zone X (unshaded) · 0% chance over 30 yrs
- Wildfire 3/10 Moderate
- Heat 3/10 Moderate 7 d/yr ≥92°F today · 15 d/yr by 30 yrs out
- Wind 1/10 Low
- Air quality 10/10 Extreme 23 unhealthy d/yr today · 27 by 30 yrs out
Nearby sold comps map
Loading sold comps map…
Walkable amenities ~0.75 mi
Loading nearby amenities…
Taxation est. · year 1
- Rental income
- $23,438
- − Mortgage interest
- −$7,954
- − Property taxes
- −$589
- − Insurance
- −$710
- − Repairs & maintenance
- −$1,875
- − Management
- −$1,875
- − Depreciation
- −$4,131
- Taxable income
- $6,304
- Est. tax owed @ 24.0%
- −$1,513
- After-tax cash flow
- $6,768/yr
For passive investors: Depreciation is non-cash, so a rental often shows a tax loss while cash-flowing — sheltering income. Rental losses are passive: they offset passive income freely, and up to $25,000/yr can offset ordinary (W-2) income if you actively participate and your MAGI is under $100k (phasing out to $0 by $150k); unused losses carry forward. On sale, claimed depreciation is recaptured at up to 25%, and gains may owe capital-gains tax (a 1031 exchange can defer both). Figures are a year-1 estimate at your 24.0% rate — not tax advice; consult a CPA.
Schools (NCES district)
- District
- David Douglas SD 40
- NCES district ID
- 4103940
- Math proficiency
- 34% ▲ 1.00%
- Reading proficiency
- 49% ▲ 1.00%
- Median HH income
- $42,781
- Composite
- 37.38/100
- National rank
- #8926
- State rank
- #99 of 183 in OR
Livability — Portland
- Score
- 77/100
- State rank
- #72
- US rank
- #3256
Category grades
Schools grade is shown separately in the Schools card above.
Census & demographics
- Census place
- Portland, OR
- County
- Multnomah County · 786,692 people
- City population
- 774,334
- Metro
- Portland-Vancouver-Hillsboro, OR-WA
- Population (ZIP)
- 37,558
- Household income
- $75,090
- Rent vs Own
- Severe rent burden
- 1744.0
Population outlook (Multnomah County) Hauer SSP2
- Today (2025)
- 930,825 people
- By 2030
- 996,904 · +7.1%
- By 2040
- 1,121,379 · +20.5%
- By 2050
- 1,242,124 · +33.4%
- By 2075
- 1,464,431 · +57.3%
- By 2100
- 1,576,181 · +69.3%
Race, ethnicity, and origin ACS 2023
- Neighborhood character
- Diverse neighborhood (Simpson 0.67)
- Race & ethnicity
- White 51% Hispanic / Latino 21% Asian 13% Two or more races 12% Black 9% Pacific Islander 1%
- Hispanic origin (detail)
- Mexican 15% Cuban 1%
- Common ancestry
- Italian 3% Scotch-Irish 2% Subsaharan African 2%
- Foreign-born
- 25% · Canada, Vietnam, China
- Languages at home
- 63% English-only · Spanish 16% Vietnamese 6% Russian/Polish/Slavic 5%
Political lean MEDSL · Multnomah
- 2024 margin
- Solid D (+62.1) · D 79.3% · R 17.2% · Other 3.5%
- 2008→2024 swing
- +6.0pp toward D · 2008: 56.1pp · 2024: 62.1pp
- All cycles
- 2024: D+62.1 2020: D+61.3 2016: D+58.3 2012: D+54.9 2008: D+56.1
Not yet ingested
- Civics
- —
Market trends
- HPI YoY
- ▼ -334.44%
- Current HPI
- 289.931
- Rent YoY
- ▲ 1.64%
- Metro
- Portland-Vancouver-Hillsboro, OR-WA
- State GDP YoY
- ▲ 2.05%
- F500 in state
- 2
Industry mix (Fortune 500 HQ in OR)
| Industry | F500 HQs | Revenue |
|---|---|---|
| Consumer Goods | 1 | $51B |
|
||
Price history
-2.1% since first listed2 events — show timeline
- 2026-05-07 Price Changed $142,000 RMLS
- 2026-02-26 Listed $145,000 RMLS
Property tax history
+3.5%/yrLatest (2022): $589 · +1.6% YoY. Source: county tax records.
Cash-flow waterfall
monthlySold comps — $/sqft
last 12 mo · ≤1 miLoading sold comps…