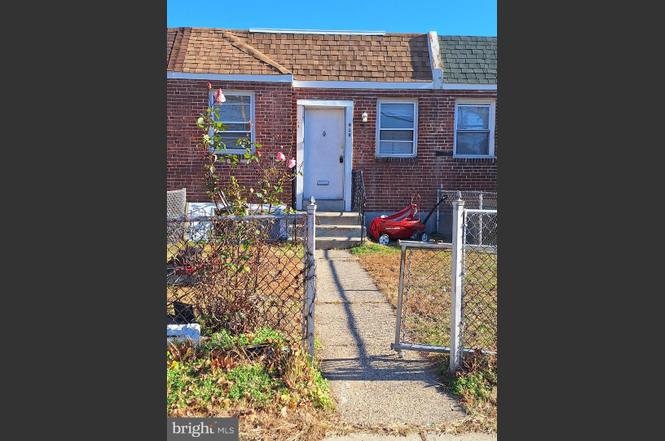
919 Sharon Ave · Sharon Hill, PA
Flood risk 1/10 · Minimal
- FEMA flood zone
- X (unshaded)
- Chance of flooding over 30 yrs
- 0.0%
- Est. flood insurance / yr
- $473 – $860
Fire risk 1/10 · Minimal
- Est. fire insurance / yr
- $511 – $949
Heat risk 7/10 · Major
- Hot days now (above 103°F)
- 7 days/yr
- Hot days in 30 yrs
- 15 days/yr
Wind risk 6/10 · Moderate
- Chance of severe wind over 30 yrs
- 27.0%
Air-quality risk 4/10 · Minor
- Unhealthy air days now
- 3 days/yr
- Unhealthy air days in 30 yrs
- 6 days/yr
Risk factors via First Street. Map © Google.
Why this score? — see what drove the B+ grade
The composite is a weighted blend of 9 inputs, each scored 0–100. Each bar is that input's sub-score; the figure is the points it added to the 100-point composite (weight × sub-score).
- Cash flow +29.0/30.0
- ARV discount +15.0/15.0
- 1% rule +10.0/10.0
- DSCR +10.0/10.0
- Livability +4.1/5.0
- Rent growth +2.5/5.0
- Condition / age +2.5/5.0
- Schools +2.0/10.0
- Appreciation +0.0/10.0
$80,000
🖨 Deal sheet 📄 Offer letter ✓ Due diligence
Listing remarks
Nestled in the heart of the charming Lincoln Park neighborhood, this delightful interior row townhouse offers a unique opportunity to create your dream home. Built in 1950, this brick ranch-style residence exudes character and warmth, inviting you to envision the possibilities within its walls. The cozy layout features a full basement, perfect for storage or a creative workspace. With a modest lot size of 0.03 acres, maintenance is a breeze, allowing you to spend more time enjoying the vibrant community around you. Lincoln Park is known for its friendly atmosphere and convenient access to local amenities. Stroll through tree-lined streets to discover parks, cafes, and boutique shops just mo
Key facts
- Modest lot size
- Tree-lined streets
- Full basement
Tags
Neighborhood map
What this means for you Summary
Snapshot
- This is a 2-bed/1.0-bath townhouse listed at $80k.
Deal economics
- At list price, monthly cash flow is $273 ($3k/yr) — positive.
- The deal already cash-flows at list — no discount required.
- Meets the 1% rule at list price ($1k rent vs $80k).
- Cap rate 10.4% vs local median 3.3% in Sharon Hill — top-decile yield for the area; either an underpriced asset or a hidden risk that comps aren't pricing in. Stress-test before assuming the spread holds.
Location & tenants
- Location reads 82/100 on livability (#142 in PA, #1,147 nationally) — a professional / high-income tenant draw. Strengths: commute A+, cost of living A+, housing A; Watch: amenities D.
- Southeast Delco SD (suburban): math 13% / reading 33% proficiency, ranked #478 of 539 in PA (top 89%) — low school quality limits family demand, transient renter base, plan for 1-2y turnover; 63% free/reduced lunch — lower-income household profile, screen leases tightly.
- Market conditions: 34 active listings in the ZIP; 14 comparable units currently listed for rent nearby; rentals at typical pace (median 24d on market — plan ~3-4 weeks tenant-placement turnaround); 299 units permitted in Delaware County in 2024 (5 in 5+ unit buildings).
Forward outlook
- Local home prices are declining (-3.0%/yr); year-one equity from $553 of loan paydown is wiped out by about $2k of value loss. Plan a longer hold.
- At projected returns (-3.0% appreciation + 3.0% rent growth), your $22k cash investment doubles in ~8 years — after that, you're playing with house money.
Negotiation context
- Only 14 days on market — expect competitive offers; lowballing is unlikely to land.
- 3 sale attempts since 10y ago; this cycle's ask has dropped $35k (30%) from the opening price — seller is motivated, your offer sets the floor, not the list.
- Current owner paid $10k; list at $80k implies a 697% gain — meaningful room to come down on a strong offer.
Risks & watch-outs
- Watch-outs: property tax is 4.3% of price; built in 1950 — expect roof / HVAC / electrical / plumbing capex.
- Climate carrying-cost: major wind risk, 27% chance of damaging wind over 30y; extreme-heat days projected 7→15/yr by 2055 (HVAC capex compounding) — expect insurance premiums to compound above CPI over the hold.
Questions for the listing agent
- Built in 1950 — when were the roof, HVAC, electrical panel, plumbing, and water heater last replaced?
- Property tax is high relative to price — has the assessment been appealed recently, and will the sale trigger a re-assessment?
- Is there a deadline driving the sale (1031 exchange, divorce, estate, relocation)? That informs how much negotiation room exists.
- What's the average days-on-market for RENTAL listings here right now (not sales)? A rising rental-DOM trend means longer vacancies and softer asking-rent achievability than the comps imply.
- What's the recent tenant-quality profile in this submarket — average credit score on applications, eviction rate, late-payment / NSF rate, and stable-employment percentage? A property-management company in the area should have these aggregated.
- How much new for-sale + rental construction is in the pipeline within 1–3 miles? Heavy new supply typically softens prices + rents 12–24 months out; constrained supply supports both.
Investment metrics
- 1% rule
- 1.60% ✓
- Cap rate
- 10.39%
- Cash-on-cash
- 14.63%
- DSCR
- 1.65
- GRM
- 5.2
CMA / ARV
- ARV (on-the-fly)
- $100,215
- Comps found
- 10
Show comp detail 10 sales within ~0.75 mi
| Address | Dist | Beds/Ba | Sqft | Sold | Price | $/sf | Match |
|---|---|---|---|---|---|---|---|
| 919 Sharon Ave | 0.00mi | 2/1.0 | 655 (0%) | 1mo | $55,000 | $84 | 100 |
| 1013 Pine Rd | 0.06mi | 2/1.0 | 655 (0%) | 2mo | $90,000 | $137 | 96 |
| 1022 Pine Rd | 0.06mi | 2/1.0 | 655 (0%) | 2mo | $80,000 | $122 | 95 |
| 930 Pine Rd | 0.02mi | 2/1.0 | 655 (0%) | 6mo | $100,000 | $153 | 94 |
| 917 Pine Rd | 0.03mi | 2/1.0 | 655 (0%) | 7mo | $92,000 | $140 | 93 |
| 1009 Laurel Rd | 0.10mi | 2/2.0 | 655 (0%) | 2mo | $165,000 | $252 | 90 |
| 1018 Pine Rd | 0.06mi | 2/1.0 | 655 (0%) | 9mo | $125,000 | $191 | 90 |
| 1039 Barker Rd | 0.14mi | 2/1.0 | 655 (0%) | 6mo | $142,500 | $218 | 89 |
| 914 Burnside Rd | 0.05mi | 2/1.0 | 655 (0%) | 11mo | $80,120 | $122 | 89 |
| 1001 Burnside Rd | 0.07mi | 2/2.0 | 655 (0%) | 8mo | $138,000 | $211 | 86 |
Match score weights: distance 35% · size 25% · config 20% · recency 20%. Top-matched comps best support the ARV.
Projected returns pro-forma
-3.0% appreciation · 3.0% rent growth · sell at horizon
- IRR
- 5.2%
- Equity multiple
- 1.20×
- Total profit
- $4,561
- Equity at exit
- $11,928
- IRR
- 14.8%
- Equity multiple
- 2.20×
- Total profit
- $26,912
- Equity at exit
- $6,917
Cash invested: $22,400 (down + closing). Projections, not guarantees.
Landlord ↔ Tenant lean methodology
- Overall (STATE)
- 62 Landlord-Friendly
- State Pennsylvania
- 62 Landlord-Friendly · EVEN
- County
- — inherits STATE
- City
- — inherits STATE
ZIP-level market 19079
- Home prices YoY
- -17.7%
- Active inventory
- 34
- Price-to-rent
- 5.2×
Monthly cashflow live
- Estimated rent
- $1,284 high interval (Pro) →
- Mortgage (P&I)
- −$420
- Tax from tax record
- −$288 /mo · $3,461/yr
- Insurance
- −$33
- HOA
- −$0
- Vacancy / Maint / Mgmt
- −$270
- Net cashflow
- $273
Break-even live
UW: 25.0% down · 7.5% · 30yr · 1.5% tax · 5.0% vac · 8.0% maint · 8.0% mgmt
Financing live
Cash to close
- Down payment
- $20,000
- Closing costs
- $2,400
- Reserves months
- —
- Total cash needed
- —
Loan-product check · same deal, 3 products live
Conventional
25% down · 7.5% · 30yr
- Down + closing
- —
- Monthly P&I
- —
- Monthly cashflow
- —
- DSCR
- —
- Eligible?
- —
Personal DTI + credit; lowest rate.
DSCR
20% down · 8.5% · 30yr
- Down + closing
- —
- Monthly P&I
- —
- Monthly cashflow
- —
- DSCR
- —
- Eligible?
- —
No personal income docs; deal must DSCR.
Hard money
10% down · 12.0% · 12mo
- Down + closing
- —
- Monthly P&I
- —
- Monthly cashflow
- —
- DSCR
- —
- Eligible?
- —
Short-term bridge; refi at stabilization.
Rent comps 14 comps
| Address | Beds | Baths | Sqft | Rent | $/sqft | DOM | Units | Dist |
|---|---|---|---|---|---|---|---|---|
| 1037 Laurel Rd Sharon Hill, PA | 2.0 | 1.0 | 655 | $1,195 | $1.82 | 43d | 1 | 0.07mi |
| 1012 Burnside Rd Sharon Hill, PA | 2.0 | 1.0 | 655 | $1,295 | $1.98 | 44d | 1 | 0.07mi |
| 430 Folcroft Ave Unit 2 Folcroft, PA | 1.0 | 1.0 | 500 | $950 | $1.90 | 43d | 1 | 0.49mi |
| 1511 Elmwood Ave Folcroft, PA | 1.0–3.0 | 1.0 | 725 | $1,399 | $1.93 | 23d | 3 | 0.54mi |
| 1528 Elmwood Ave Folcroft, PA | 1.0 | 1.0 | 600 | $1,350 | $2.25 | 43d | 1 | 0.60mi |
| 1528 Elmwood Ave Unit 108 Folcroft, PA | 1.0 | 1.0 | 600 | $1,200 | $2.00 | 24d | 1 | 0.60mi |
| 601 Poplar St Sharon Hill, PA | 1.0–2.0 | 1.0 | 787 | $1,599 | $2.03 | 14d | 5 | 0.73mi |
| 132 Folcroft Ave Folcroft, PA | 2.0 | 1.0 | 725 | $1,679 | $2.32 | 2d | 3 | 0.77mi |
| 200 Karen Cir Glenolden, PA | 1.0 | 1.0 | 632 | $1,195 | $1.89 | 3d | 5 | 1.11mi |
| 1010 Beechwood Ave Apt A Collingdale, PA | 1.0 | 1.0 | 480 | $1,350 | $2.81 | 17d | 1 | 1.17mi |
| 909 Springfield Rd Unit B Darby, PA | 1.0 | 1.0 | 700 | $1,000 | $1.43 | 43d | 1 | 1.28mi |
| 957 Springfield Rd Unit 1 Darby, PA | 2.0 | 1.0 | 600 | $1,400 | $2.33 | 18d | 1 | 1.29mi |
| 100 E Glenolden Ave Glenolden, PA | 1.0–4.0 | 1.0–2.0 | 920 | $1,683 | $1.83 | 1d | 4 | 1.35mi |
| 350 S Scott Ave Unit 1 Glenolden, PA | 2.0 | 1.0 | 715 | $1,700 | $2.38 | 24d | 1 | 1.47mi |
Listing history 20 events
-
2026-04-18price $80,000
-
2026-03-07status Pending
-
2026-03-03price $95,000
-
2026-03-01price $99,999
-
2026-02-27price $109,999
-
2026-02-21$115,000 Active
-
2025-12-15historical
-
2025-12-13price $99,999
-
2025-12-13price $99,000
-
2025-12-11price $105,000
-
2025-12-05price $115,000
-
2025-12-04price $120,000
-
2025-11-29price $127,500
-
2025-11-22$130,000 Active
-
2025-11-18historical
-
2017-09-15historical
-
2016-09-29$35,000
-
1994-08-12soldstatus $10,038
-
1984-11-05soldstatus $21,900
-
1981-04-01soldstatus $15,000
ⓘ Source: listings_history table (triggers on properties + properties_extension) + one-shot
backfill from property_details.listing_events for pre-trigger history.
Tax reassessment forecast PA · Partial reset (capped growth)
- Current annual tax
- $3,461 · $288/mo
- Projected year-2 tax
- $3,461 · $288/mo
- Expected delta
- $0/yr ($0/mo · 0.0%)
ⓘ Screening estimate from a state-policy table — verify with the county assessor before closing.
Climate risk First Street
- Flood 1/10 Low FEMA zone X (unshaded) · 0% chance over 30 yrs
- Wildfire 1/10 Low
- Heat 7/10 Severe 7 d/yr ≥103°F today · 15 d/yr by 30 yrs out
- Wind 6/10 Major 27% chance of damaging wind over 30 yrs
- Air quality 4/10 Moderate 3 unhealthy d/yr today · 6 by 30 yrs out
Nearby sold comps map
Loading sold comps map…
Walkable amenities ~0.75 mi
Loading nearby amenities…
Taxation est. · year 1
- Rental income
- $15,408
- − Mortgage interest
- −$4,481
- − Property taxes
- −$3,461
- − Insurance
- −$400
- − Repairs & maintenance
- −$1,233
- − Management
- −$1,233
- − Depreciation
- −$2,327
- Taxable income
- $2,273
- Est. tax owed @ 24.0%
- −$545
- After-tax cash flow
- $2,731/yr
For passive investors: Depreciation is non-cash, so a rental often shows a tax loss while cash-flowing — sheltering income. Rental losses are passive: they offset passive income freely, and up to $25,000/yr can offset ordinary (W-2) income if you actively participate and your MAGI is under $100k (phasing out to $0 by $150k); unused losses carry forward. On sale, claimed depreciation is recaptured at up to 25%, and gains may owe capital-gains tax (a 1031 exchange can defer both). Figures are a year-1 estimate at your 24.0% rate — not tax advice; consult a CPA.
Schools (NCES district)
- District
- Southeast Delco SD
- NCES district ID
- 4222400
- Math proficiency
- 13% ▼ -8.00%
- Reading proficiency
- 33% ▼ -9.00%
- Median HH income
- $49,309
- Composite
- 20.25/100
- National rank
- #8623
- State rank
- #478 of 539 in PA
Livability — Sharon Hill
- Score
- 82/100
- State rank
- #142
- US rank
- #1147
Category grades
Schools grade is shown separately in the Schools card above.
Census & demographics
- Population (ZIP)
- 9,014
Population outlook (Delaware County) Hauer SSP2
- Today (2025)
- 577,490 people
- By 2030
- 581,243 · +0.6%
- By 2040
- 584,700 · +1.2%
- By 2050
- 586,581 · +1.6%
- By 2075
- 598,706 · +3.7%
- By 2100
- 590,823 · +2.3%
Race, ethnicity, and origin ACS 2023
- Neighborhood character
- Predominantly Black (80%)
- Race & ethnicity
- Black 80% White 12% Two or more races 6% Hispanic / Latino 4% Asian 1%
- Common ancestry
- Romanian 1% Hispanic 1%
- Foreign-born
- 10% · Canada, China
- Languages at home
- 93% English-only · Chinese 1% Spanish 1%
Political lean MEDSL · Delaware
- 2024 margin
- Strong D (+23.7) · D 61.4% · R 37.6% · Other 1.0%
- 2008→2024 swing
- +2.3pp toward D · 2008: 21.4pp · 2024: 23.7pp
- All cycles
- 2024: D+23.7 2020: D+26.7 2016: D+22.0 2012: D+21.8 2008: D+21.4
Not yet ingested
- Civics
- —
Market trends
- HPI YoY
- ▼ -71.04%
- Current HPI
- 330.4912
- Rent YoY
- —
- Metro
- —
- State GDP YoY
- ▲ 1.68%
- F500 in state
- 34
Industry mix (Fortune 500 HQ in PA)
| Industry | F500 HQs | Revenue |
|---|---|---|
| Healthcare | 2 | $309B |
|
||
| Insurance | 2 | $27B |
|
||
| Telecommunications / Media | 1 | $124B |
|
||
| Industrial Distribution | 1 | $22B |
|
||
| Financial Services | 1 | $20B |
|
||
| Chemicals / Materials | 1 | $18B |
|
||
Price history
+433.3% since first listed20 events — show timeline
- 2026-04-18 Price Changed $80,000 BRIGHT MLS
- 2026-03-07 Pending — BRIGHT MLS
- 2026-03-03 Price Changed $95,000 BRIGHT MLS
- 2026-03-01 Price Changed $99,999 BRIGHT MLS
- 2026-02-27 Price Changed $109,999 BRIGHT MLS
- 2026-02-21 Listed $115,000 BRIGHT MLS
- 2025-12-15 Listing Removed — BRIGHT MLS
- 2025-12-13 Price Changed $99,999 BRIGHT MLS
- 2025-12-13 Price Changed $99,000 BRIGHT MLS
- 2025-12-11 Price Changed $105,000 BRIGHT MLS
- 2025-12-05 Price Changed $115,000 BRIGHT MLS
- 2025-12-04 Price Changed $120,000 BRIGHT MLS
- 2025-11-29 Price Changed $127,500 BRIGHT MLS
- 2025-11-22 Listed $130,000 BRIGHT MLS
- 2025-11-18 Coming Soon — BRIGHT MLS
- 2017-09-15 Listing Removed — BRIGHT MLS
- 2016-09-29 Listed $35,000 BRIGHT MLS
- 1994-08-12 Sold (Public Records) $10,038 Public Records
- 1984-11-05 Sold (Public Records) $21,900 Public Records
- 1981-04-01 Sold (Public Records) $15,000 Public Records
Property tax history
+6.0%/yrLatest (2026): $3,461 · +15.4% YoY. Source: county tax records.
Cash-flow waterfall
monthlySold comps — $/sqft
last 12 mo · ≤1 miLoading sold comps…