3926 Lockport Olcott Rd #139 Rd · Lockport, NY
Flood risk No data
- FEMA flood zone
- —
- Chance of flooding over 30 yrs
- —
- Est. flood insurance / yr
- —
Fire risk No data
- Est. fire insurance / yr
- —
Heat risk No data
- Hot days now (above threshold)
- —
- Hot days in 30 yrs
- —
Wind risk No data
- Chance of severe wind over 30 yrs
- —
Air-quality risk No data
- Unhealthy air days now
- —
- Unhealthy air days in 30 yrs
- —
Risk factors via First Street. Map © Google.
Why this score? — see what drove the B grade
The composite is a weighted blend of 9 inputs, each scored 0–100. Each bar is that input's sub-score; the figure is the points it added to the 100-point composite (weight × sub-score).
- Cash flow +24.7/30.0
- ARV discount +15.0/15.0
- DSCR +8.0/10.0
- 1% rule +6.4/10.0
- Schools +5.0/10.0
- Condition / age +4.8/5.0
- Livability +3.8/5.0
- Rent growth +3.4/5.0
- Appreciation +0.0/10.0
$130,000
🖨 Deal sheet 📄 Offer letter ✓ Due diligence
Listing remarks MLS
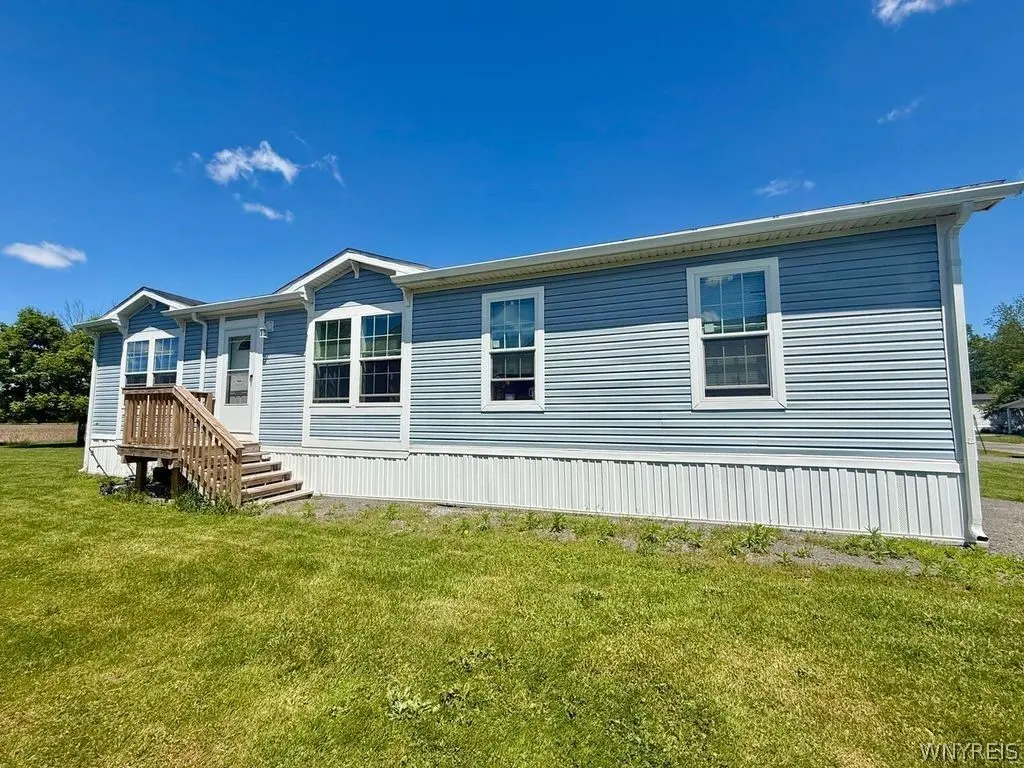
Peaceful easy living. Come check out this maintenance free home and simplify your life. Ridgeview Homes Park is where this 2 bedroom, 1 large full bath is located. Very close to all amenities. It boasts a covered carport to keep you out of the elements. A large 3 season sunroom with 3 entrances increases the living space. Inside is total open concept living at its finest. All appliances including the Generac whole house generator are included in the sale. Metal roof (5 years), replacement windows, heat wrapped pipes and large shed make this one a no brainer.
Key facts
- Built 2024
- Listed 17 days
Property features AI
Finance
- Financial info: Monthly land lease payment of $606
- HOA & community: Has land lease
Exterior
- Parking: No garage
- Utilities: Public water (connected); Sewer connected
- Home design: Single-story home; Double wide mobile home (Champion Home Builders); Resale property
- Construction: Vinyl siding; Block foundation; Existing construction
- Exterior features: Blacktop driveway; Deck
Interior
- Kitchen: Gas oven and gas range; Microwave; Dishwasher; Disposal; Refrigerator; Kitchen island; Granite counters; Walk-in pantry
- Bedrooms: Three bedrooms on the main level; Primary suite located on the main level
- Flooring: Luxury vinyl flooring
- Bathrooms: Two full bathrooms (both on the main level)
- Heating & cooling: Gas heating; Forced-air heating
- Interior features: Granite counters; Kitchen island; Open living/dining area; Walk-in pantry; Primary suite; Bedroom on main level; Main level primary
- Laundry & utility: Washer and dryer included; Laundry located on the main level; Gas water heater
Neighborhood map
What this means for you Summary
Snapshot
- This is a 3-bed/2.0-bath single-family listed at $130k. Condition is rated excellent.
Deal economics
- At list price, monthly cash flow is $272 ($3k/yr) — positive.
- The deal already cash-flows at list — no discount required.
- Meets the 1% rule at list price ($1k rent vs $130k).
- Recommended offer: $128k (1.5% below list) — sets the bar for market timing.
- Cap rate 8.8% vs local median 4.5% in Lockport — top-decile yield for the area; either an underpriced asset or a hidden risk that comps aren't pricing in. Stress-test before assuming the spread holds.
Location & tenants
- Location reads 76/100 on livability (#232 in NY, #3,669 nationally) — a middle-class / working-renter tenant base. Strengths: amenities A+, cost of living A+, housing A+; Watch: commute D+, crime F, employment D-.
- Newfane Central School District (rural): math 51% / reading 66% proficiency, ranked #257 of 590 in NY (top 44%) — acceptable for families but not a draw, mixed tenant base, ~2y average lease.
- Market conditions: Rents rising (+3.7%/yr); 357 active listings in the ZIP; solid renter incomes; 167 units permitted in Niagara County in 2024 (0 in 5+ unit buildings).
Forward outlook
- Local home prices are declining (-3.0%/yr); year-one equity from $899 of loan paydown is wiped out by about $4k of value loss. Plan a longer hold.
- Niagara County population projected at -19% by 2050 — secular population decline; favor cash flow + early exit over multi-decade hold.
Negotiation context
- It's been on market 17 days — a 2% lower offer ($128k) is reasonable based on typical stale-listing flexibility.
- 9 sale attempts since 13y ago; this cycle's ask has dropped $10k (7%) from the opening price — seller is motivated, your offer sets the floor, not the list.
- Current owner paid $25k; list at $130k implies a 422% gain — meaningful room to come down on a strong offer.
Questions for the listing agent
- Is there a deadline driving the sale (1031 exchange, divorce, estate, relocation)? That informs how much negotiation room exists.
- Schools are B-rated — typically a magnet for longer-tenancy family renters. What's the average tenant stay here, and is there a school-zone premium baked into asking?
- Crime grade is F in this area — have there been break-ins, vandalism, or insurance claims at this property in the last 3 years? What carrier currently insures it and at what premium?
- What's the average days-on-market for RENTAL listings here right now (not sales)? A rising rental-DOM trend means longer vacancies and softer asking-rent achievability than the comps imply.
- What's the recent tenant-quality profile in this submarket — average credit score on applications, eviction rate, late-payment / NSF rate, and stable-employment percentage? A property-management company in the area should have these aggregated.
- How much new for-sale + rental construction is in the pipeline within 1–3 miles? Heavy new supply typically softens prices + rents 12–24 months out; constrained supply supports both.
Investment metrics
- 1% rule
- 1.14% ✓
- Cap rate
- 8.80%
- Cash-on-cash
- 8.95%
- DSCR
- 1.40
- GRM
- 7.3
CMA / ARV
- ARV (on-the-fly)
- $230,242
- Comps found
- 2
Show comp detail 2 sales within ~0.75 mi
| Address | Dist | Beds/Ba | Sqft | Sold | Price | $/sf | Match |
|---|---|---|---|---|---|---|---|
| 6530 Wheeler Rd | 0.20mi | 3/1.0 | 1,448 (+4%) | 1mo | $240,000 | $166 | 78 |
| 6407 Michelle Dr | 0.73mi | 4/2.0 (+1) | 1,228 (-12%) | 10mo | $170,000 | $138 | 34 |
Match score weights: distance 35% · size 25% · config 20% · recency 20%. Top-matched comps best support the ARV.
Projected returns pro-forma
-3.0% appreciation · 3.67% rent growth · sell at horizon
- IRR
- -2.0%
- Equity multiple
- 0.92×
- Total profit
- $-2,741
- Equity at exit
- $19,383
- IRR
- 8.4%
- Equity multiple
- 1.66×
- Total profit
- $24,157
- Equity at exit
- $11,240
Cash invested: $36,400 (down + closing). Projections, not guarantees.
Landlord ↔ Tenant lean methodology
- Overall (STATE)
- 15 Strongly Tenant-Friendly
- State New York
- 15 Strongly Tenant-Friendly · D+10
- County
- — inherits STATE
- City
- — inherits STATE
ZIP-level market 14094
- Rents YoY
- 3.7%
- Active inventory
- 357
- Price-to-rent
- 7.3×
Monthly cashflow live
- Estimated rent
- $1,481 medium interval (Pro) →
- Mortgage (P&I)
- −$682
- Tax est. 1.5%
- −$162 /mo · $1,950/yr
- Insurance
- −$54
- HOA
- −$0
- Vacancy / Maint / Mgmt
- −$311
- Net cashflow
- $272
Break-even live
UW: 25.0% down · 7.5% · 30yr · 1.5% tax · 5.0% vac · 8.0% maint · 8.0% mgmt
Financing live
Cash to close
- Down payment
- $32,500
- Closing costs
- $3,900
- Reserves months
- —
- Total cash needed
- —
Loan-product check · same deal, 3 products live
Conventional
25% down · 7.5% · 30yr
- Down + closing
- —
- Monthly P&I
- —
- Monthly cashflow
- —
- DSCR
- —
- Eligible?
- —
Personal DTI + credit; lowest rate.
DSCR
20% down · 8.5% · 30yr
- Down + closing
- —
- Monthly P&I
- —
- Monthly cashflow
- —
- DSCR
- —
- Eligible?
- —
No personal income docs; deal must DSCR.
Hard money
10% down · 12.0% · 12mo
- Down + closing
- —
- Monthly P&I
- —
- Monthly cashflow
- —
- DSCR
- —
- Eligible?
- —
Short-term bridge; refi at stabilization.
Listing history 14 events
-
2026-06-18days on market $130,000 Active 17 DOM
-
2026-06-17days on market $130,000 Active 16 DOM
-
2026-06-16days on market $130,000 Active 15 DOM
-
2026-06-15days on market $130,000 Active 14 DOM
-
2026-06-13days on market $130,000 Active 12 DOM
-
2026-06-13days on market $130,000 Active 11 DOM
-
2026-06-10pricedays on market $130,000 Active 9 DOM
-
2026-06-09days on market $140,000 Active 8 DOM
-
2026-06-08days on market $140,000 Active 7 DOM
-
2026-06-07days on market $140,000 Active 6 DOM
-
2026-06-05days on market $140,000 Active 3 DOM
-
2026-06-03days on market $140,000 Active 2 DOM
-
2026-06-01remarks 436-char remark
-
2026-06-01$140,000 Active 1 DOM
ⓘ Source: listings_history table (triggers on properties + properties_extension) + one-shot
backfill from property_details.listing_events for pre-trigger history.
Nearby sold comps map
Loading sold comps map…
Walkable amenities ~0.75 mi
Loading nearby amenities…
Taxation est. · year 1
- Rental income
- $17,772
- − Mortgage interest
- −$7,282
- − Property taxes
- −$1,950
- − Insurance
- −$650
- − Repairs & maintenance
- −$1,422
- − Management
- −$1,422
- − Depreciation
- −$3,782
- Taxable income
- $1,265
- Est. tax owed @ 24.0%
- −$303
- After-tax cash flow
- $2,955/yr
For passive investors: Depreciation is non-cash, so a rental often shows a tax loss while cash-flowing — sheltering income. Rental losses are passive: they offset passive income freely, and up to $25,000/yr can offset ordinary (W-2) income if you actively participate and your MAGI is under $100k (phasing out to $0 by $150k); unused losses carry forward. On sale, claimed depreciation is recaptured at up to 25%, and gains may owe capital-gains tax (a 1031 exchange can defer both). Figures are a year-1 estimate at your 24.0% rate — not tax advice; consult a CPA.
Condition & rehab AI · 1 photo
This single-family home in Ridgeview Estates Mobile Park is in excellent condition with no visible repairs needed. It offers a good investment opportunity with potential for modest updates to enhance its resale and rental value.
Value-add opportunities
- Both Paint exterior siding — Enhances curb appeal and value
- Both Replace windows — Improves energy efficiency and aesthetics
- Both Upgrade HVAC system — Enhances comfort and energy efficiency
Renovation cost estimate screening
Value-add ROI direction
- Both Paint exterior siding — Enhances curb appeal and value ↑
- Both Replace windows — Improves energy efficiency and aesthetics ↑
- Both Upgrade HVAC system — Enhances comfort and energy efficiency ↑
ⓘ Cost ranges are severity-bucket heuristics (US national rule-of-thumb). Get contractor quotes + a written scope before underwriting a rehab budget.
Schools (NCES district)
- District
- Newfane Central School District
- NCES district ID
- 3620760
- Math proficiency
- 51% ▼ -5.00%
- Reading proficiency
- 66% ▲ 10.00%
- Median HH income
- $53,029
- Composite
- 50.07/100
- National rank
- #1911
- State rank
- #257 of 590 in NY
Livability — Lockport
- Score
- 76/100
- State rank
- #232
- US rank
- #3669
Category grades
Schools grade is shown separately in the Schools card above.
Census & demographics
- County
- Niagara County · 157,377 people
- City population
- 50,153
- Metro
- Buffalo-Cheektowaga, NY
- Population (ZIP)
- 50,153
- Household income
- $75,427
- Rent vs Own
- Severe rent burden
- 1112.0
Population outlook (Niagara County) Hauer SSP2
- Today (2025)
- 204,149 people
- By 2030
- 197,900 · -3.1%
- By 2040
- 182,239 · -10.7%
- By 2050
- 165,198 · -19.1%
- By 2075
- 129,416 · -36.6%
- By 2100
- 96,222 · -52.9%
Race, ethnicity, and origin ACS 2023
- Neighborhood character
- Predominantly White (84%)
- Race & ethnicity
- White 84% Two or more races 6% Black 6% Hispanic / Latino 3%
- Common ancestry
- Romanian 9% Slovak 2% Lithuanian 2%
- Foreign-born
- 3% · Canada
- Languages at home
- 96% English-only · Spanish 1% Russian/Polish/Slavic 1% Other Indo-European 1%
Political lean MEDSL · Niagara
- 2024 margin
- R (+14.9) · D 42.5% · R 57.5%
- 2008→2024 swing
- -15.9pp toward R · 2008: 1.0pp · 2024: -14.9pp
- All cycles
- 2024: R+14.9 2020: R+9.7 2016: R+19.0 2012: D+0.6 2008: D+1.0
Not yet ingested
- Civics
- —
Market trends
- HPI YoY
- ▼ -262.57%
- Current HPI
- 303.6109
- Rent YoY
- ▲ 3.67%
- Metro
- Buffalo-Cheektowaga, NY
- State GDP YoY
- ▲ 2.60%
- F500 in state
- 92
Industry mix (Fortune 500 HQ in NY)
| Industry | F500 HQs | Revenue |
|---|---|---|
| Financial Services | 10 | $950B |
|
||
| Consumer Goods | 9 | $162B |
|
||
| Insurance | 4 | $225B |
|
||
| Telecommunications | 2 | $144B |
|
||
| Pharmaceuticals | 2 | $112B |
|
||
| Media / Entertainment | 2 | $69B |
|
||
Price history
+269.4% since first listed23 events — show timeline
- 2026-06-01 Listed $140,000 WNYREIS
- 2019-03-22 Sold (MLS) $24,900 WNYREIS
- 2019-02-15 Pending — WNYREIS
- 2019-02-11 Pending — WNYREIS
- 2019-02-04 Listed $24,900 WNYREIS
- 2017-06-27 Sold (MLS) $21,500 WNYREIS
- 2017-05-13 Contingent — WNYREIS
- 2017-03-22 Price Changed $23,000 WNYREIS
- 2017-03-07 Price Changed $25,500 WNYREIS
- 2017-02-23 Listed $26,900 WNYREIS
- 2015-10-17 Sold (MLS) $21,000 WNYREIS
- 2015-10-16 Pending — WNYREIS
- 2015-09-15 Relisted — WNYREIS
- 2015-08-31 Listing Removed — WNYREIS
- 2015-08-13 Pending — WNYREIS
- 2015-07-25 Relisted — WNYREIS
- 2015-07-22 Pending — WNYREIS
- 2015-07-15 Relisted — WNYREIS
- 2015-06-09 Listed $24,900 WNYREIS
- 2015-06-08 Pending — WNYREIS
- 2015-05-28 Listed $24,900 WNYREIS
- 2014-05-29 Sold (MLS) $37,900 WNYREIS
- 2013-08-27 Listed $37,900 WNYREIS
Cash-flow waterfall
monthlySold comps — $/sqft
last 12 mo · ≤1 miLoading sold comps…