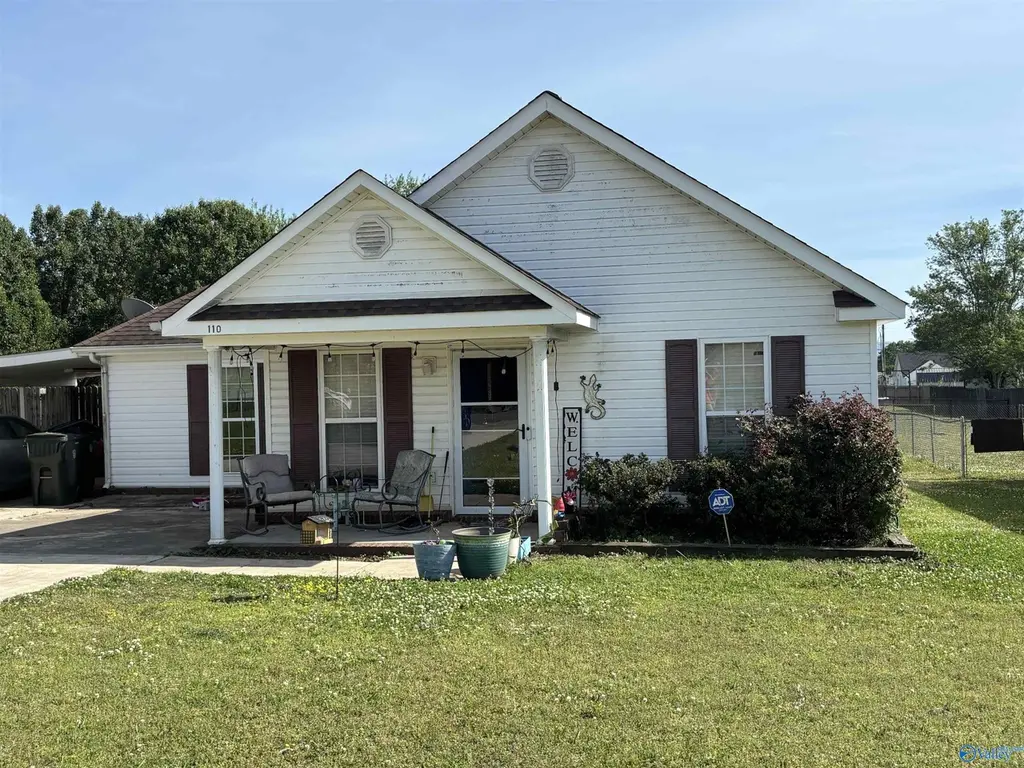
110 Saint Clair Dr · New Market, AL
Flood risk 1/10 · Minimal
- FEMA flood zone
- X (unshaded)
- Chance of flooding over 30 yrs
- 0.0%
- Est. flood insurance / yr
- $507 – $1,088
Fire risk 3/10 · Minor
- Est. fire insurance / yr
- $916 – $1,700
Heat risk 6/10 · Moderate
- Hot days now (above 105°F)
- 7 days/yr
- Hot days in 30 yrs
- 21 days/yr
Wind risk 6/10 · Moderate
- Chance of severe wind over 30 yrs
- 27.0%
Air-quality risk 2/10 · Minimal
- Unhealthy air days now
- 1 days/yr
- Unhealthy air days in 30 yrs
- 2 days/yr
Risk factors via First Street. Map © Google.
Why this score? — see what drove the B+ grade
The composite is a weighted blend of 9 inputs, each scored 0–100. Each bar is that input's sub-score; the figure is the points it added to the 100-point composite (weight × sub-score).
- Cash flow +30.0/30.0
- ARV discount +15.0/15.0
- DSCR +10.0/10.0
- 1% rule +8.5/10.0
- Schools +3.7/10.0
- Livability +3.0/5.0
- Rent growth +2.5/5.0
- Condition / age +2.5/5.0
- Appreciation +0.0/10.0
$130,000
🖨 Deal sheet (PDF) 📄 Offer letter ✓ Due diligence
Listing remarks MLS
Great starter home in a very desirable area! This cozy ranch style home located in the Riverton/Buckhorn school district has numerous updates already completed for the new owner! Newly installed wood flooring and eye-catching tile in all traffic and wet areas are easily maintained. Brand new roof in June 2016, completely remodeled kitchen including updated cabinetry, countertops and appliances in June 2015! Additional closet added as well as a 10x12 building in the backyard for more storage space!
Key facts
- 0.3 acre lot
- Built 2002
- Listed 3 days
Neighborhood map
What this means for you Summary
Snapshot
- This is a 3-bed/1.0-bath single-family listed at $130k.
Deal economics
- At list price, monthly cash flow is $563 ($7k/yr) — positive.
- The deal already cash-flows at list — no discount required.
- Meets the 1% rule at list price ($2k rent vs $130k).
- Cap rate 11.5% vs local median 4.2% in New Market — top-decile yield for the area; either an underpriced asset or a hidden risk that comps aren't pricing in. Stress-test before assuming the spread holds.
Location & tenants
- Location reads 60/100 on livability (#304 in AL) — a middle-class / working-renter tenant base. Strengths: crime A+, cost of living A+, housing B; Watch: amenities F, commute F, employment F.
- Madison County (rural): math 27% / reading 56% proficiency, ranked #19 of 129 in AL (top 15%) — families likely to look elsewhere, expect single-tenant / working-renter base with shorter leases.
- Zoned schools: Riverton Elementary School (math 52% / reading 67%, grade B-, #63 of 627 statewide, top 10%, 581 students, 29% FRL); Buckhorn Middle School (math 19% / reading 59%, grade F, #64 of 257 statewide, top 25%, 688 students, 38% FRL); Buckhorn High School (math 31% / reading 33%, grade F, #59 of 305 statewide, top 21%, 1,287 students, 34% FRL) — zoned schools at 34% FRL track the district average.
- Market conditions: 393 active listings in the ZIP; 11 comparable units currently listed for rent nearby; rentals at typical pace (median 26d on market — plan ~3-4 weeks tenant-placement turnaround); 45% of comp listings sitting > 30 days — soft ceiling on asking rent; solid renter incomes; 4,709 units permitted in Madison County in 2024 (1,186 in 5+ unit buildings).
Forward outlook
- Local home prices are declining (-3.0%/yr); year-one equity from $899 of loan paydown is wiped out by about $4k of value loss. Plan a longer hold.
- Madison County population projected at +18% by 2050 — long-run rental-demand tailwind backs the buy-and-hold thesis.
- At projected returns (-3.0% appreciation + 3.0% rent growth), your $36k cash investment doubles in ~7 years — after that, you're playing with house money.
Negotiation context
- Only 3 days on market — expect competitive offers; lowballing is unlikely to land.
- 2 sale attempts since 10y ago with the ask held roughly flat each time — persistent listings suggest the price (not the market) is what's stuck; bring a comps-based counter.
- Current owner paid $92k; 42% above their basis — modest negotiation headroom, anchor on the comps not their cost.
Risks & watch-outs
- Climate carrying-cost: major wind risk, 27% chance of damaging wind over 30y; extreme-heat days projected 7→21/yr by 2055 (HVAC capex compounding) — expect insurance premiums to compound above CPI over the hold.
Questions for the listing agent
- Is there a deadline driving the sale (1031 exchange, divorce, estate, relocation)? That informs how much negotiation room exists.
- Schools are D-rated, which usually means shorter tenancies and higher turnover. Who's the typical renter profile here, and what's been the actual vacancy rate?
- What's the average days-on-market for RENTAL listings here right now (not sales)? A rising rental-DOM trend means longer vacancies and softer asking-rent achievability than the comps imply.
- What's the recent tenant-quality profile in this submarket — average credit score on applications, eviction rate, late-payment / NSF rate, and stable-employment percentage? A property-management company in the area should have these aggregated.
- How much new for-sale + rental construction is in the pipeline within 1–3 miles? Heavy new supply typically softens prices + rents 12–24 months out; constrained supply supports both.
Investment metrics
- 1% rule
- 1.35% ✓
- Cap rate
- 11.49%
- Cash-on-cash
- 18.56%
- DSCR
- 1.83
- GRM
- 6.2
CMA / ARV
- ARV (on-the-fly)
- $222,480
- Comps found
- 12
Show comp detail 12 sales within ~0.75 mi
| Address | Dist | Beds/Ba | Sqft | Sold | Price | $/sf | Match |
|---|---|---|---|---|---|---|---|
| 110 Saint Clair Dr | 0.00mi | 3/1.0 | 1,073 (-1%) | 1mo | $135,000 | $126 | 98 |
| 137 Clear Creek Dr | 0.26mi | 3/2.0 | 1,037 (-4%) | 4mo | $216,000 | $208 | 74 |
| 4541 Maysville Rd | 0.29mi | 3/2.0 | 1,153 (+7%) | 5mo | $255,000 | $221 | 67 |
| 119 Clear Creek Dr | 0.22mi | 3/2.0 | 1,148 (+6%) | 14mo | $248,000 | $216 | 64 |
| 103 Shadow Oak Cir | 0.43mi | 3/2.0 | 1,018 (-6%) | 4mo | $209,900 | $206 | 63 |
| 139 Clear Creek Dr | 0.26mi | 3/2.0 | 1,167 (+8%) | 10mo | $240,000 | $206 | 62 |
| 104 Shadow Oak Cir | 0.45mi | 3/2.0 | 1,140 (+6%) | 5mo | $235,000 | $206 | 62 |
| 123 Castleridge Dr | 0.42mi | 3/2.0 | 1,207 (+12%) | 1mo | $238,900 | $198 | 56 |
| 237 Tanner Point Dr | 0.42mi | 3/2.0 | 1,220 (+13%) | 2mo | $237,500 | $195 | 53 |
| 229 Tanner Point Dr | 0.45mi | 3/2.0 | 1,214 (+12%) | 5mo | $250,000 | $206 | 50 |
| 120 Mikaelas Way | 0.75mi | 3/2.0 | 1,228 (+14%) | 3mo | $239,900 | $195 | 36 |
| 204 Harlans Cir | 0.72mi | 3/2.0 | 1,240 (+15%) | 12mo | $238,000 | $192 | 27 |
Match score weights: distance 35% · size 25% · config 20% · recency 20%. Top-matched comps best support the ARV.
Projected returns pro-forma
-3.0% appreciation · 3.0% rent growth · sell at horizon
- IRR
- 10.3%
- Equity multiple
- 1.41×
- Total profit
- $14,776
- Equity at exit
- $19,383
- IRR
- 19.4%
- Equity multiple
- 2.62×
- Total profit
- $58,967
- Equity at exit
- $11,240
Cash invested: $36,400 (down + closing). Projections, not guarantees.
Landlord ↔ Tenant lean methodology
- Overall (STATE)
- 90 Strongly Landlord-Friendly
- State Alabama
- 90 Strongly Landlord-Friendly · R+15
- County
- — inherits STATE
- City
- — inherits STATE
ZIP-level market 35761
- Home prices YoY
- -9.3%
- Active inventory
- 393
- Price-to-rent
- 6.2×
Monthly cashflow live
- Estimated rent
- $1,757 high interval (Pro) →
- Mortgage (P&I)
- −$682
- Tax from tax record
- −$89 /mo · $1,072/yr
- Insurance
- −$54
- HOA
- −$0
- Lot rent
- −$0
- Vacancy / Maint / Mgmt
- −$369
- Net cashflow
- $563
Break-even live
Sensitivity live
| Price | -10% $637 | -5% $600 | +0% $563 | +5% $526 | +10% $489 |
|---|---|---|---|---|---|
| Rent | -10% $424 | -5% $494 | +0% $563 | +5% $632 | +10% $702 |
| Rate | -1.0pp $629 | -0.5pp $596 | base $563 | +0.5pp $529 | +1.0pp $495 |
UW: 25.0% down · 7.5% · 30yr · 1.5% tax · 5.0% vac · 8.0% maint · 8.0% mgmt
Financing live
Cash to close
- Down payment
- $32,500
- Closing costs
- $3,900
- Reserves months
- —
- Total cash needed
- —
Loan-product check · same deal, 3 products live
Conventional
25% down · 7.5% · 30yr
- Down + closing
- —
- Monthly P&I
- —
- Monthly cashflow
- —
- DSCR
- —
- Eligible?
- —
Personal DTI + credit; lowest rate.
DSCR
20% down · 8.5% · 30yr
- Down + closing
- —
- Monthly P&I
- —
- Monthly cashflow
- —
- DSCR
- —
- Eligible?
- —
No personal income docs; deal must DSCR.
Hard money
10% down · 12.0% · 12mo
- Down + closing
- —
- Monthly P&I
- —
- Monthly cashflow
- —
- DSCR
- —
- Eligible?
- —
Short-term bridge; refi at stabilization.
Rent comps 11 comps
| Address | Beds | Baths | Sqft | Rent | $/sqft | DOM | Units | Dist |
|---|---|---|---|---|---|---|---|---|
| 227 Falcon Ridge Dr Huntsville, AL | 3.0 | 2.0 | 1425 | $1,591 | $1.12 | 46d | 1 | 0.38mi |
| 236 Tanner Point Dr New Market, AL | 3.0 | 2.0 | 1288 | $1,665 | $1.29 | 16d | 1 | 0.47mi |
| 112 Raptor Ct Huntsville, AL | 3.0 | 2.0 | 1242 | $1,700 | $1.37 | 46d | 1 | 0.53mi |
| 4429 Maysville Rd NE Huntsville, AL | 3.0 | 2.0 | 1248 | $1,650 | $1.32 | 16d | 1 | 0.53mi |
| 104 Bataleur Ct Huntsville, AL | 3.0 | 2.0 | 1250 | $1,600 | $1.28 | 46d | 1 | 0.66mi |
| 109 Tanner Ridge Cir New Market, AL | 3.0 | 2.0 | 1332 | $1,595 | $1.20 | 46d | 1 | 0.78mi |
| 110 Olde Hearth RD New Market, AL | 3.0 | 2.0 | 1143 | $1,707 | $1.49 | 23d | 1 | 0.97mi |
| 165 Olde Hearth Rd New Market, AL | 3.0 | 2.0 | 1355 | $1,684 | $1.24 | 46d | 1 | 1.02mi |
| 157 Olde Hearth Rd New Market, AL | 3.0 | 2.0 | 1466 | $1,664 | $1.14 | 23d | 1 | 1.02mi |
| 154 Olde Hearth Rd New Market, AL | 3.0 | 2.0 | 1150 | $1,695 | $1.47 | 25d | 1 | 1.02mi |
| 154 Olde Hearth Rd New Market, AL | 3.0 | 2.0 | 1143 | $1,695 | $1.48 | 16d | 1 | 1.02mi |
Listing history 5 events
-
2026-04-19status Pending
-
2026-04-15$130,000 Active
-
2017-12-11soldstatus $91,500
-
2017-12-08soldstatus $91,500 502-char remark
Show marketing remark (502 chars)
Great starter home in a very desirable area! This cozy ranch style home located in the Riverton/Buckhorn school district has numerous updates already completed for the new owner! Newly installed wood flooring and eye-catching tile in all traffic and wet areas are easily maintained. Brand new roof in June 2016, completely remodeled kitchen including updated cabinetry, countertops and appliances in June 2015! Additional closet added as well as a 10x12 building in the backyard for more storage space!
-
2016-11-27$92,000 502-char remark
Show marketing remark (502 chars)
Great starter home in a very desirable area! This cozy ranch style home located in the Riverton/Buckhorn school district has numerous updates already completed for the new owner! Newly installed wood flooring and eye-catching tile in all traffic and wet areas are easily maintained. Brand new roof in June 2016, completely remodeled kitchen including updated cabinetry, countertops and appliances in June 2015! Additional closet added as well as a 10x12 building in the backyard for more storage space!
ⓘ Source: listings_history table (triggers on properties + properties_extension) + one-shot
backfill from property_details.listing_events for pre-trigger history.
Tax reassessment forecast AL · Resets to sale price
- Current annual tax
- $1,072 · $89/mo
- Projected year-2 tax
- $1,072 · $89/mo
- Expected delta
- $0/yr ($0/mo · 0.0%)
ⓘ Screening estimate from a state-policy table — verify with the county assessor before closing.
Climate risk First Street
- Flood 1/10 Low FEMA zone X (unshaded) · 0% chance over 30 yrs
- Wildfire 3/10 Moderate
- Heat 6/10 Major 7 d/yr ≥105°F today · 21 d/yr by 30 yrs out
- Wind 6/10 Major 27% chance of damaging wind over 30 yrs
- Air quality 2/10 Low 1 unhealthy d/yr today · 2 by 30 yrs out
Nearby sold comps map
Loading sold comps map…
Walkable amenities ~0.75 mi
Loading nearby amenities…
Taxation est. · year 1
- Rental income
- $21,088
- − Mortgage interest
- −$7,282
- − Property taxes
- −$1,072
- − Insurance
- −$650
- − Repairs & maintenance
- −$1,687
- − Management
- −$1,687
- − Depreciation
- −$3,782
- Taxable income
- $4,928
- Est. tax owed @ 24.0%
- −$1,183
- After-tax cash flow
- $5,574/yr
For passive investors: Depreciation is non-cash, so a rental often shows a tax loss while cash-flowing — sheltering income. Rental losses are passive: they offset passive income freely, and up to $25,000/yr can offset ordinary (W-2) income if you actively participate and your MAGI is under $100k (phasing out to $0 by $150k); unused losses carry forward. On sale, claimed depreciation is recaptured at up to 25%, and gains may owe capital-gains tax (a 1031 exchange can defer both). Figures are a year-1 estimate at your 24.0% rate — not tax advice; consult a CPA.
Schools (NCES district)
- District
- Madison County
- NCES district ID
- 0102220
- Math proficiency
- 27% ▼ -32.00%
- Reading proficiency
- 56% ▼ -1.00%
- Median HH income
- $66,058
- Composite
- 37.15/100
- National rank
- #4483
- State rank
- #19 of 129 in AL
Livability — New Market
- Score
- 60/100
- State rank
- #304
- US rank
- #19258
Category grades
Schools grade is shown separately in the Schools card above.
Census & demographics
- County
- Madison County · 380,832 people
- City population
- 13,557
- Metro
- Huntsville, AL
- Population (ZIP)
- 13,557
- Household income
- $79,440
- Rent vs Own
- Severe rent burden
- 220.0
Population outlook (Madison County) Hauer SSP2
- Today (2025)
- 392,086 people
- By 2030
- 409,788 · +4.5%
- By 2040
- 440,557 · +12.4%
- By 2050
- 460,990 · +17.6%
- By 2075
- 502,872 · +28.3%
- By 2100
- 513,623 · +31.0%
Race, ethnicity, and origin ACS 2023
- Neighborhood character
- Predominantly White (76%)
- Race & ethnicity
- White 76% Black 15% Two or more races 6% Hispanic / Latino 3%
- Common ancestry
- Italian 3% Serbian 2% Iranian 2%
- Foreign-born
- 2% · Canada
- Languages at home
- 98% English-only · German/W. Germanic 1% Spanish 1%
Political lean MEDSL · Madison
- 2024 margin
- Lean R (+9.0) · D 44.7% · R 53.7% · Other 1.6%
- 2008→2024 swing
- +6.0pp toward D · 2008: -14.9pp · 2024: -9.0pp
- All cycles
- 2024: R+9.0 2020: R+8.0 2016: R+16.8 2012: R+18.7 2008: R+14.9
Not yet ingested
- Civics
- —
Market trends
- HPI YoY
- ▼ -26.88%
- Current HPI
- 261.8281
- Rent YoY
- —
- Metro
- Huntsville, AL
- State GDP YoY
- ▲ 2.94%
- F500 in state
- 4
Industry mix (Fortune 500 HQ in AL)
| Industry | F500 HQs | Revenue |
|---|---|---|
| Financial Services | 1 | $8B |
|
||
| Healthcare | 1 | $5B |
|
||
Price history
+41.3% since first listed5 events — show timeline
- 2026-04-19 Pending — VMLS
- 2026-04-15 Listed $130,000 VMLS
- 2017-12-11 Sold (Public Records) $91,500 Public Records
- 2017-12-08 Sold (MLS) $91,500 VMLS
- 2016-11-27 Listed $92,000 VMLS
Property tax history
+7.1%/yrLatest (2024): $1,072 · +1.8% YoY. Source: county tax records.
Cash-flow waterfall
monthlySold comps — $/sqft
last 12 mo · ≤1 miLoading sold comps…