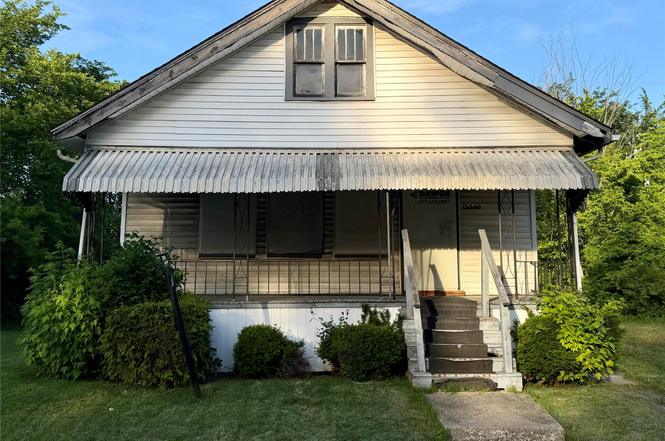
15640 Inverness St · Detroit, MI
Flood risk 6/10 · Moderate
- FEMA flood zone
- X (unshaded)
- Chance of flooding over 30 yrs
- 0.71%
- Est. flood insurance / yr
- $473 – $860
Fire risk 1/10 · Minimal
- Est. fire insurance / yr
- $784 – $1,456
Heat risk 3/10 · Minor
- Hot days now (above 97°F)
- 7 days/yr
- Hot days in 30 yrs
- 14 days/yr
Wind risk 2/10 · Minimal
- Chance of severe wind over 30 yrs
- —
Air-quality risk 4/10 · Minor
- Unhealthy air days now
- 4 days/yr
- Unhealthy air days in 30 yrs
- 6 days/yr
Risk factors via First Street. Map © Google.
Why this score? — see what drove the C+ grade
The composite is a weighted blend of 9 inputs, each scored 0–100. Each bar is that input's sub-score; the figure is the points it added to the 100-point composite (weight × sub-score).
- Cash flow +30.0/30.0
- 1% rule +10.0/10.0
- DSCR +10.0/10.0
- Rent growth +4.0/5.0
- Livability +3.7/5.0
- Condition / age +2.5/5.0
- ARV discount +1.3/15.0
- Schools +1.3/10.0
- Appreciation +0.0/10.0
$40,000
🖨 Deal sheet (PDF) 📄 Offer letter ✓ Due diligence
Listing remarks MLS
Investor Special – Double Lot Included! Great investment opportunity for the savvy investor looking to bring new life to a property with tremendous potential. This home requires a complete renovation but offers the opportunity to create a strong rental property or value-add investment once improvements are completed. The sale includes the adjacent double lot to the left of the home, providing additional space and future possibilities. Inside, you'll find a bonus living area, separate dining room, spacious room sizes, a full open basement, and a huge attic offering ample storage or potential expansion opportunities. Additional features include a large covered front porch and a functional layout ready for your vision and updates. Property is being sold as-is.
Key facts
- Bonus living area
- Huge attic
- Separate dining room
Tags
Property features AI
Exterior
- Parking: No garage
- Utilities: Public water; Public sewer
- Home design: Single-family residence; One level; Ground-level entry with steps
- Construction: Constructed with aluminum siding, block, vinyl siding, and wood siding; Block foundation
- Exterior features: Paved road access; Lot approximately 0.09 acres (30 x 127)
Interior
- Bathrooms: 1 full bathroom
- Heating & cooling: Forced air heating (natural gas); No cooling
- Interior features: Unfinished basement; Total of 5 rooms
Neighborhood map
What this means for you Summary
Snapshot
- This is a 2-bed/1.0-bath single-family listed at $40k.
Deal economics
- At list price, monthly cash flow is $561 ($7k/yr) — positive.
- The deal already cash-flows at list — no discount required.
- Meets the 1% rule at list price ($1k rent vs $40k).
- Cap rate 23.1% vs local median 10.0% in Detroit — top-decile yield for the area; either an underpriced asset or a hidden risk that comps aren't pricing in. Stress-test before assuming the spread holds.
Location & tenants
- Location reads 73/100 on livability (#218 in MI) — a middle-class / working-renter tenant base. Strengths: amenities A+, commute A+, cost of living A+; Watch: crime F, employment F.
- Detroit Public Schools Community District (urban): math 10% / reading 24% proficiency, ranked #499 of 540 in MI (top 92%) — low school quality limits family demand, transient renter base, plan for 1-2y turnover; 90% free/reduced lunch — lower-income household profile, screen leases tightly.
- Zoned schools: Paul Robeson Malcolm X Academy (math 10% / reading 10%, grade F, #1,230 of 1,397 statewide, top 91%, 395 students, 88% FRL); Mumford High School (math 24% / reading 24%, grade F, #481 of 713 statewide, top 81%, 889 students, 86% FRL) — zoned schools at 87% FRL track the district average.
- Market conditions: Rents rising fast (+6.1%/yr); 350 active listings in the ZIP; 40 comparable units currently listed for rent nearby; rentals lingering (median 46d on market — plan ~5-8 weeks vacancy on turnover, expect pricing pressure); 50% of comp listings sitting > 30 days — soft ceiling on asking rent; lower-income renter base — watch delinquency; 2,639 units permitted in Wayne County in 2024 (1,216 in 5+ unit buildings).
- This rent runs 38% of the median local income ($33k/yr) — at the standard rent-burdened threshold; future hikes will face affordability resistance.
Forward outlook
- Local home prices are declining (-3.0%/yr); year-one equity from $277 of loan paydown is wiped out by about $1k of value loss. Plan a longer hold.
- Wayne County population projected at -17% by 2050 — secular population decline; favor cash flow + early exit over multi-decade hold.
- At projected returns (-3.0% appreciation + 6.1% rent growth), your $11k cash investment doubles in ~2 years — after that, you're playing with house money.
Negotiation context
- Only 4 days on market — expect competitive offers; lowballing is unlikely to land.
- 6 sale attempts since 7y ago with the ask held roughly flat each time — persistent listings suggest the price (not the market) is what's stuck; bring a comps-based counter.
Risks & watch-outs
- Watch-outs: built in 1924 — expect roof / HVAC / electrical / plumbing capex.
- Climate carrying-cost: major flood risk — expect insurance premiums to compound above CPI over the hold.
Questions for the listing agent
- Built in 1924 — when were the roof, HVAC, electrical panel, plumbing, and water heater last replaced?
- Is there a deadline driving the sale (1031 exchange, divorce, estate, relocation)? That informs how much negotiation room exists.
- Schools are F-rated, which usually means shorter tenancies and higher turnover. Who's the typical renter profile here, and what's been the actual vacancy rate?
- Crime grade is F in this area — have there been break-ins, vandalism, or insurance claims at this property in the last 3 years? What carrier currently insures it and at what premium?
- What's the average days-on-market for RENTAL listings here right now (not sales)? A rising rental-DOM trend means longer vacancies and softer asking-rent achievability than the comps imply.
- What's the recent tenant-quality profile in this submarket — average credit score on applications, eviction rate, late-payment / NSF rate, and stable-employment percentage? A property-management company in the area should have these aggregated.
- How much new for-sale + rental construction is in the pipeline within 1–3 miles? Heavy new supply typically softens prices + rents 12–24 months out; constrained supply supports both.
Investment metrics
- 1% rule
- 2.65% ✓
- Cap rate
- 23.11%
- Cash-on-cash
- 60.07%
- DSCR
- 3.67
- GRM
- 3.1
CMA / ARV
- ARV (on-the-fly)
- $35,136
- Comps found
- 12
Show comp detail 12 sales within ~0.75 mi
| Address | Dist | Beds/Ba | Sqft | Sold | Price | $/sf | Match |
|---|---|---|---|---|---|---|---|
| 15560 La Salle Blvd | 0.14mi | 3/1.0 (+1) | 1,022 (+5%) | 1mo | $35,000 | $34 | 80 |
| 15798 Muirland St | 0.56mi | 2/1.0 | 943 (-3%) | 1mo | $29,000 | $31 | 67 |
| 15834 Baylis St | 0.09mi | 3/1.0 (+1) | 1,065 (+9%) | 10mo | $111,500 | $105 | 67 |
| 16200 Lawton St | 0.48mi | 3/1.0 (+1) | 956 (-2%) | 4mo | $56,500 | $59 | 66 |
| 15488 Wildemere St | 0.52mi | 3/1.0 (+1) | 949 (-3%) | 1mo | $49,900 | $53 | 65 |
| 1952 Louise St | 0.35mi | 3/1.0 (+1) | 882 (-10%) | 2mo | $33,000 | $37 | 61 |
| 1983 Brighton St | 0.47mi | 3/1.0 (+1) | 921 (-6%) | 5mo | $40,000 | $43 | 60 |
| 15774 Muirland St | 0.56mi | 2/1.0 | 1,018 (+4%) | 10mo | $35,000 | $34 | 58 |
| 15893 Alden St | 0.45mi | 2/1.5 | 836 (-14%) | 1mo | $24,000 | $29 | 52 |
| 2505 La Belle St | 0.73mi | 3/1.0 (+1) | 1,027 (+5%) | 2mo | $25,000 | $24 | 51 |
| 15455 Wildemere St | 0.55mi | 3/1.0 (+1) | 1,095 (+12%) | 2mo | $18,500 | $17 | 47 |
| 15494 Muirland St | 0.56mi | 2/1.0 | 1,090 (+12%) | 9mo | $39,000 | $36 | 47 |
Match score weights: distance 35% · size 25% · config 20% · recency 20%. Top-matched comps best support the ARV.
Projected returns pro-forma
-3.0% appreciation · 6.14% rent growth · sell at horizon
- IRR
- 62.4%
- Equity multiple
- 3.92×
- Total profit
- $32,698
- Equity at exit
- $5,964
- IRR
- 67.9%
- Equity multiple
- 9.00×
- Total profit
- $89,634
- Equity at exit
- $3,458
Cash invested: $11,200 (down + closing). Projections, not guarantees.
Landlord ↔ Tenant lean methodology
- Overall (STATE)
- 62 Landlord-Friendly
- State Michigan
- 62 Landlord-Friendly · EVEN
- County
- — inherits STATE
- City
- — inherits STATE
ZIP-level market 48238
- Home prices YoY
- -14.4%
- Rents YoY
- 6.1%
- Active inventory
- 350
- Price-to-rent
- 3.1×
Monthly cashflow live
- Estimated rent
- $1,060 high interval (Pro) →
- Mortgage (P&I)
- −$210
- Tax est. 1.5%
- −$50 /mo · $600/yr
- Insurance
- −$17
- HOA
- −$0
- Vacancy / Maint / Mgmt
- −$223
- Net cashflow
- $561
Break-even live
Sensitivity live
| Price | -10% $588 | -5% $575 | +0% $561 | +5% $547 | +10% $533 |
|---|---|---|---|---|---|
| Rent | -10% $477 | -5% $519 | +0% $561 | +5% $603 | +10% $644 |
| Rate | -1.0pp $581 | -0.5pp $571 | base $561 | +0.5pp $550 | +1.0pp $540 |
UW: 25.0% down · 7.5% · 30yr · 1.5% tax · 5.0% vac · 8.0% maint · 8.0% mgmt
Financing live
Cash to close
- Down payment
- $10,000
- Closing costs
- $1,200
- Reserves months
- —
- Total cash needed
- —
Loan-product check · same deal, 3 products live
Conventional
25% down · 7.5% · 30yr
- Down + closing
- —
- Monthly P&I
- —
- Monthly cashflow
- —
- DSCR
- —
- Eligible?
- —
Personal DTI + credit; lowest rate.
DSCR
20% down · 8.5% · 30yr
- Down + closing
- —
- Monthly P&I
- —
- Monthly cashflow
- —
- DSCR
- —
- Eligible?
- —
No personal income docs; deal must DSCR.
Hard money
10% down · 12.0% · 12mo
- Down + closing
- —
- Monthly P&I
- —
- Monthly cashflow
- —
- DSCR
- —
- Eligible?
- —
Short-term bridge; refi at stabilization.
Rent comps 40 comps
| Address | Beds | Baths | Sqft | Rent | $/sqft | DOM | Units | Dist |
|---|---|---|---|---|---|---|---|---|
| 16174 Princeton St Unit 2 Detroit, MI | 2.0 | 1.0 | 985 | $1,100 | $1.12 | 46d | 1 | 0.45mi |
| 16174 Princeton St Detroit, MI | 2.0 | 1.0 | 985 | $1,100 | $1.12 | 21d | 1 | 0.45mi |
| 15906 Alden St Detroit, MI | 3.0 | 1.0 | 1030 | $1,150 | $1.12 | 19d | 1 | 0.46mi |
| 16927 Inverness St Detroit, MI | 2.0 | 1.0 | 897 | $1,650 | $1.84 | 19d | 1 | 0.68mi |
| 1705 Oakman Blvd Unit 10 Detroit, MI | 1.0 | 1.0 | 650 | $895 | $1.38 | 26d | 1 | 0.73mi |
| 1705 Oakman Blvd Unit 5 Detroit, MI | 1.0 | 1.0 | 650 | $895 | $1.38 | 46d | 1 | 0.73mi |
| 1705 Oakman Blvd Unit 8 Detroit, MI | 1.0 | 1.0 | 650 | $950 | $1.46 | 0d | 1 | 0.73mi |
| 2433 Pasadena St Unit 2435 Detroit, MI | 2.0 | 1.0 | 700 | $1,025 | $1.46 | 46d | 1 | 0.76mi |
| 2623 W McNichols Rd Unit 23106 Detroit, MI | 1.0 | 1.0 | 750 | $1,075 | $1.43 | 46d | 1 | 0.78mi |
| 13641 La Salle Blvd Detroit, MI | 1.0 | 1.0 | 800 | $775 | $0.97 | 26d | 1 | 0.80mi |
| 13639 La Salle Blvd Detroit, MI | 2.0 | 1.0 | 800 | $695 | $0.87 | 13d | 1 | 0.80mi |
| 13639 La Salle Blvd Detroit, MI | 1.0 | 1.0 | 800 | $775 | $0.97 | 46d | 1 | 0.80mi |
| 1875 Ewald Cir Unit 2E Detroit, MI | 1.0 | 1.0 | 725 | $875 | $1.21 | 7d | 1 | 0.84mi |
| 941 Merton Rd Highland Park, MI | 2.0 | 1.0 | 850 | $1,000 | $1.18 | 46d | 1 | 0.85mi |
| 17449 Manderson Rd Unit 16 Detroit, MI | 1.0 | 1.0 | 700 | $950 | $1.36 | 26d | 1 | 0.89mi |
| 17449 Manderson Rd Unit 3 Detroit, MI | 1.0 | 1.0 | 700 | $950 | $1.36 | 5d | 1 | 0.89mi |
| 17449 Manderson Rd Unit 1 Detroit, MI | 2.0 | 1.0 | 750 | $1,150 | $1.53 | 26d | 1 | 0.89mi |
| 17449 Manderson Rd Unit 3 Detroit, MI | 1.0 | 1.0 | 700 | $1,015 | $1.45 | 26d | 1 | 0.89mi |
| 17449 Manderson Rd Unit 8 Detroit, MI | 1.0 | 1.0 | 700 | $950 | $1.36 | 22d | 1 | 0.89mi |
| 17449 Manderson Rd Unit 13 Detroit, MI | 1.0 | 1.0 | 700 | $1,010 | $1.44 | 0d | 1 | 0.89mi |
| 17461 Manderson Rd Unit 5 Detroit, MI | 1.0 | 1.0 | 700 | $1,015 | $1.45 | 24d | 1 | 0.89mi |
| 17497 Manderson Rd Unit 17 Detroit, MI | 1.0 | 1.0 | 700 | $1,015 | $1.45 | 24d | 1 | 0.92mi |
| 17497 Manderson Rd Unit 18A Detroit, MI | 1.0 | 1.0 | 700 | $91,015 | $130.02 | 24d | 1 | 0.92mi |
| 17497 Manderson Rd Unit 17A Detroit, MI | 1.0 | 1.0 | 700 | $1,015 | $1.45 | 26d | 1 | 0.92mi |
| 2034 Ewald Cir Detroit, MI | 2.0 | 1.0 | 1000 | $995 | $0.99 | 7d | 1 | 0.96mi |
| 730 Whitmore Rd Detroit, MI | 1.0–2.0 | 1.0 | 850 | $850 | $1.00 | 46d | 3 | 1.00mi |
| 885 Covington Dr Unit 312 Highland Park, MI | 1.0 | 1.0 | 650 | $1,045 | $1.61 | 46d | 1 | 1.01mi |
| 885 Covington Dr Unit 412 Highland Park, MI | 1.0 | 1.0 | 600 | $1,045 | $1.74 | 17d | 1 | 1.01mi |
| 885 Covington Dr Unit 102 Highland Park, MI | 1.0 | 1.0 | 550 | $1,050 | $1.91 | 46d | 1 | 1.01mi |
| 885 Covington Dr Unit 304 Highland Park, MI | 1.0 | 1.0 | 600 | $1,010 | $1.68 | 46d | 1 | 1.01mi |
| 931 Covington Dr Unit 205 Highland Park, MI | 1.0 | 1.0 | 550 | $1,070 | $1.95 | 46d | 1 | 1.02mi |
| 931 Covington Dr Unit 204 Highland Park, MI | 1.0 | 1.0 | 550 | $1,100 | $2.00 | 46d | 1 | 1.02mi |
| 931 Covington Dr Unit 202 Highland Park, MI | 2.0 | 2.0 | 550 | $1,400 | $2.55 | 46d | 1 | 1.02mi |
| 931 Covington Dr Unit 201 Highland Park, MI | 1.0 | 1.0 | 550 | $1,110 | $2.02 | 46d | 1 | 1.02mi |
| 931 Covington Dr Unit 210 Highland Park, MI | 1.0 | 1.0 | 550 | $1,090 | $1.98 | 46d | 1 | 1.02mi |
| 931 Covington Dr Unit 106 Highland Park, MI | 1.0 | 2.0 | 1000 | $1,275 | $1.27 | 46d | 1 | 1.02mi |
| 931 Covington Dr Unit 206 Highland Park, MI | 1.0 | 1.0 | 550 | $1,095 | $1.99 | 46d | 1 | 1.02mi |
| 931 Covington Dr Unit 216 Highland Park, MI | 1.0 | 1.0 | 550 | $1,125 | $2.05 | 46d | 1 | 1.02mi |
| 931 Covington Dr Unit 214 Highland Park, MI | 1.0 | 1.0 | 550 | $930 | $1.69 | 46d | 1 | 1.02mi |
| 17701 Manderson Rd Unit 202 Highland Park, MI | 1.0 | 1.0 | 750 | $900 | $1.20 | 46d | 1 | 1.05mi |
Listing history 3 events
-
2026-06-21days on market $40,000 Active 4 DOM
-
2026-06-17remarks 693-char remark
-
2026-06-17$40,000 Active 1 DOM
ⓘ Source: listings_history table (triggers on properties + properties_extension) + one-shot
backfill from property_details.listing_events for pre-trigger history.
Climate risk First Street
- Flood 6/10 Major FEMA zone X (unshaded) · 71% chance over 30 yrs
- Wildfire 1/10 Low
- Heat 3/10 Moderate 7 d/yr ≥97°F today · 14 d/yr by 30 yrs out
- Wind 2/10 Low
- Air quality 4/10 Moderate 4 unhealthy d/yr today · 6 by 30 yrs out
Nearby sold comps map
Loading sold comps map…
Walkable amenities ~0.75 mi
Loading nearby amenities…
Taxation est. · year 1
- Rental income
- $12,716
- − Mortgage interest
- −$2,241
- − Property taxes
- −$600
- − Insurance
- −$200
- − Repairs & maintenance
- −$1,017
- − Management
- −$1,017
- − Depreciation
- −$1,164
- Taxable income
- $6,477
- Est. tax owed @ 24.0%
- −$1,554
- After-tax cash flow
- $5,174/yr
For passive investors: Depreciation is non-cash, so a rental often shows a tax loss while cash-flowing — sheltering income. Rental losses are passive: they offset passive income freely, and up to $25,000/yr can offset ordinary (W-2) income if you actively participate and your MAGI is under $100k (phasing out to $0 by $150k); unused losses carry forward. On sale, claimed depreciation is recaptured at up to 25%, and gains may owe capital-gains tax (a 1031 exchange can defer both). Figures are a year-1 estimate at your 24.0% rate — not tax advice; consult a CPA.
Schools (NCES district)
- District
- Detroit Public Schools Community District
- NCES district ID
- 2601103
- Math proficiency
- 10% ▼ -2.00%
- Reading proficiency
- 24% ▲ 6.00%
- Median HH income
- $25,815
- Composite
- 13.06/100
- National rank
- #9564
- State rank
- #499 of 540 in MI
Livability — Detroit
- Score
- 73/100
- State rank
- #218
- US rank
- #5427
Category grades
Schools grade is shown separately in the Schools card above.
Census & demographics
- Census place
- Detroit, MI
- County
- Wayne County · 1,562,939 people
- City population
- 572,865
- Metro
- Detroit-Warren-Dearborn, MI
- Population (ZIP)
- 24,731
- Household income
- $33,315
- Rent vs Own
- Severe rent burden
- 2172.0
Population outlook (Wayne County) Hauer SSP2
- Today (2025)
- 1,675,273 people
- By 2030
- 1,620,300 · -3.3%
- By 2040
- 1,502,341 · -10.3%
- By 2050
- 1,384,039 · -17.4%
- By 2075
- 1,124,592 · -32.9%
- By 2100
- 881,193 · -47.4%
Race, ethnicity, and origin ACS 2023
- Neighborhood character
- Predominantly Black (94%)
- Race & ethnicity
- Black 94% Two or more races 3% White 1%
- Foreign-born
- 1%
Political lean MEDSL · Wayne
- 2024 margin
- Strong D (+29.0) · D 62.7% · R 33.7% · Other 3.6%
- 2008→2024 swing
- -20.5pp toward R · 2008: 49.5pp · 2024: 29.0pp
- All cycles
- 2024: D+29.0 2020: D+38.1 2016: D+37.3 2012: D+46.9 2008: D+49.5
Not yet ingested
- Civics
- —
Market trends
- HPI YoY
- ▼ -31.96%
- Current HPI
- 189.6227
- Rent YoY
- ▲ 6.14%
- Metro
- Detroit-Warren-Dearborn, MI
- State GDP YoY
- ▲ 1.37%
- F500 in state
- 28
Industry mix (Fortune 500 HQ in MI)
| Industry | F500 HQs | Revenue |
|---|---|---|
| Automotive Parts | 3 | $48B |
|
||
| Automotive | 2 | $372B |
|
||
| Chemicals | 1 | $45B |
|
||
| Automotive Retail | 1 | $29B |
|
||
| Healthcare / Medical Devices | 1 | $23B |
|
||
| Automotive Technology | 1 | $20B |
|
||
Price history
+166.7% since first listed21 events — show timeline
- 2026-06-17 Listed $40,000 REALCOMP
- 2026-06-16 Listed $40,000 MiRealSource-MiMLS
- 2025-08-15 Contingent — MiRealSource-MiMLS
- 2025-08-15 Contingent — REALCOMP
- 2025-08-15 Listing Removed — MiRealSource-MiMLS
- 2025-08-04 Price Changed $29,900 MiRealSource-MiMLS
- 2025-08-03 Price Changed $29,900 REALCOMP
- 2025-06-20 Listed $40,000 REALCOMP
- 2025-06-20 Listed $40,000 MiRealSource-MiMLS
- 2019-06-07 Listing Removed — REALCOMP
- 2019-06-07 Listing Removed — MiRealSource-MiMLS
- 2019-05-29 Price Changed $6,000 MiRealSource-MiMLS
- 2019-05-29 Price Changed $6,000 REALCOMP
- 2019-05-09 Price Changed $7,000 MiRealSource-MiMLS
- 2019-05-09 Price Changed $7,000 REALCOMP
- 2019-04-24 Price Changed $9,500 MiRealSource-MiMLS
- 2019-04-24 Price Changed $9,500 REALCOMP
- 2019-04-09 Price Changed $12,000 MiRealSource-MiMLS
- 2019-04-08 Price Changed $12,000 REALCOMP
- 2019-03-26 Listed $15,000 MiRealSource-MiMLS
- 2019-03-26 Listed $15,000 REALCOMP
Property tax history
+14.7%/yrLatest (2025): $3,181 · +11.8% YoY. Source: county tax records.
Cash-flow waterfall
monthlySold comps — $/sqft
last 12 mo · ≤1 miLoading sold comps…