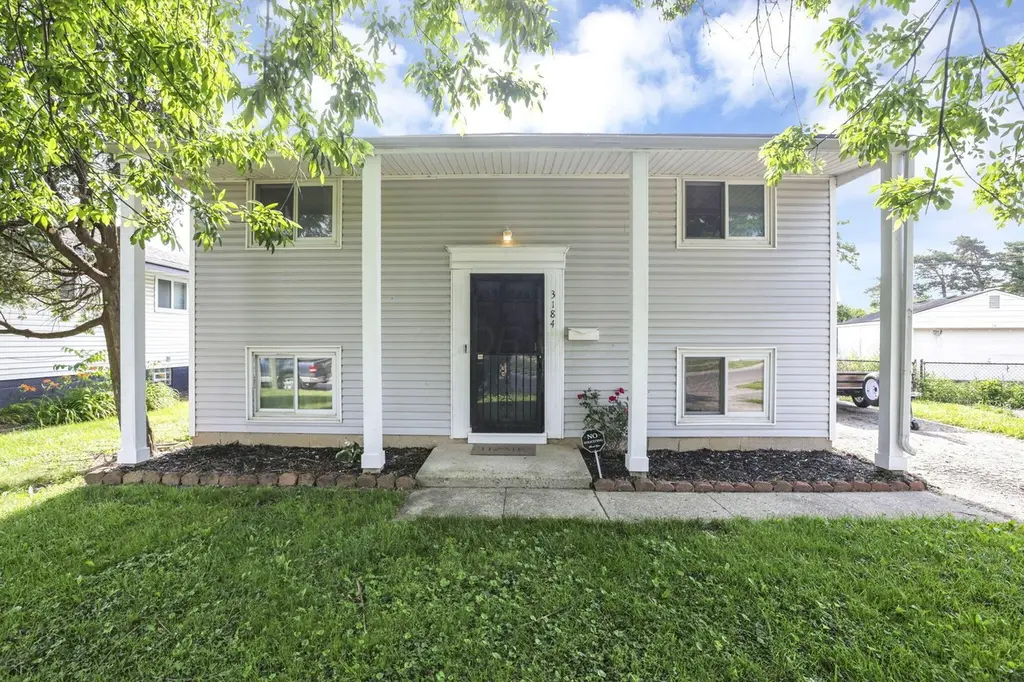
3184 Weirton Dr · Columbus, OH
Flood risk 1/10 · Minimal
- FEMA flood zone
- X (unshaded)
- Chance of flooding over 30 yrs
- 0.0%
- Est. flood insurance / yr
- $473 – $860
Fire risk 1/10 · Minimal
- Est. fire insurance / yr
- $713 – $1,323
Heat risk 4/10 · Minor
- Hot days now (above 100°F)
- 7 days/yr
- Hot days in 30 yrs
- 18 days/yr
Wind risk 2/10 · Minimal
- Chance of severe wind over 30 yrs
- 1.0%
Air-quality risk 3/10 · Minor
- Unhealthy air days now
- 2 days/yr
- Unhealthy air days in 30 yrs
- 3 days/yr
Risk factors via First Street. Map © Google.
Why this score? — see what drove the D grade
The composite is a weighted blend of 9 inputs, each scored 0–100. Each bar is that input's sub-score; the figure is the points it added to the 100-point composite (weight × sub-score).
- Cash flow +14.9/30.0
- ARV discount +7.9/15.0
- DSCR +4.5/10.0
- Livability +4.0/5.0
- 1% rule +3.5/10.0
- Rent growth +3.1/5.0
- Condition / age +2.5/5.0
- Schools +1.7/10.0
- Appreciation +0.0/10.0
$180,000
🖨 Deal sheet 📄 Offer letter ✓ Due diligence
Listing remarks MLS
Looks like new! Beautiful, move in ready 3 bedroom bi-level home with off street parking and huge fenced backyard, All new roof, kitchen, bathroom, flooring, carpet, water heater, furnace and air conditioner. Great family neighborhood in South Columbus
Key facts
- 7,840 sq ft lot
- Built 1960
- Listed 6 days
Property features AI
Exterior
- Security: Security system
- Utilities: Public water; Public sewer
- Home design: Single family residence; Bi-level layout; Built in 1960
- Construction: Block foundation
- Exterior features: Fenced yard
Interior
- Flooring: Laminate flooring
- Bathrooms: 1 full bathroom
- Heating & cooling: Forced air heating; Central air conditioning
- Interior features: Insulated windows throughout; Crawl space basement
Neighborhood map
What this means for you Summary
Snapshot
- This is a 3-bed/1.0-bath single-family listed at $180k.
Deal economics
- At list price, monthly cash flow is $51 ($614/yr) — positive.
- The deal already cash-flows at list — no discount required.
- To meet the 1% rule (rent ≥ 1% of price), the offer needs to be $154k (14.6% below list).
- Recommended offer: $154k (14.6% below list) — sets the bar for 1% rule.
- Cap rate 6.6% vs local median 3.8% in Columbus — top-decile yield for the area; either an underpriced asset or a hidden risk that comps aren't pricing in. Stress-test before assuming the spread holds.
Location & tenants
- Location reads 81/100 on livability (#97 in OH, #1,491 nationally) — a professional / high-income tenant draw. Strengths: commute A+, cost of living A+, housing A+; Watch: employment C-, crime F.
- Columbus City School District (urban): math 15% / reading 26% proficiency, ranked #626 of 656 in OH (top 95%) — low school quality limits family demand, transient renter base, plan for 1-2y turnover; 72% free/reduced lunch — lower-income household profile, screen leases tightly.
- Market conditions: Rents rising (+2.3%/yr); 196 active listings in the ZIP; 5 comparable units currently listed for rent nearby; rentals at typical pace (median 20d on market — plan ~3-4 weeks tenant-placement turnaround); 40% of comp listings sitting > 30 days — soft ceiling on asking rent; 8,139 units permitted in Franklin County in 2024 (5,940 in 5+ unit buildings).
Forward outlook
- Local home prices are declining (-3.0%/yr); year-one equity from $1k of loan paydown is wiped out by about $5k of value loss. Plan a longer hold.
- Franklin County population projected at +34% by 2050 — long-run rental-demand tailwind backs the buy-and-hold thesis.
Negotiation context
- Only 6 days on market — expect competitive offers; lowballing is unlikely to land.
- 3 sale attempts since 7y ago with the ask held roughly flat each time — persistent listings suggest the price (not the market) is what's stuck; bring a comps-based counter.
- Current owner paid $98k; list at $180k implies a 84% gain — meaningful room to come down on a strong offer.
Questions for the listing agent
- Built in 1960 — when were the roof, HVAC, electrical panel, plumbing, and water heater last replaced?
- Is there a deadline driving the sale (1031 exchange, divorce, estate, relocation)? That informs how much negotiation room exists.
- Crime grade is F in this area — have there been break-ins, vandalism, or insurance claims at this property in the last 3 years? What carrier currently insures it and at what premium?
- The area grade is low — what's the realistic commute time and amenity access for the typical tenant pool here? Any planned neighborhood developments (good or bad) we should know about?
- What's the average days-on-market for RENTAL listings here right now (not sales)? A rising rental-DOM trend means longer vacancies and softer asking-rent achievability than the comps imply.
- What's the recent tenant-quality profile in this submarket — average credit score on applications, eviction rate, late-payment / NSF rate, and stable-employment percentage? A property-management company in the area should have these aggregated.
- How much new for-sale + rental construction is in the pipeline within 1–3 miles? Heavy new supply typically softens prices + rents 12–24 months out; constrained supply supports both.
Investment metrics
- 1% rule
- 0.85% ✗
- Cap rate
- 6.63%
- Cash-on-cash
- 1.22%
- DSCR
- 1.05
- GRM
- 9.8
CMA / ARV
- ARV (on-the-fly)
- $181,740
- Comps found
- 12
Show comp detail 12 sales within ~0.75 mi
| Address | Dist | Beds/Ba | Sqft | Sold | Price | $/sf | Match |
|---|---|---|---|---|---|---|---|
| 3114 Fairwood Ave | 0.27mi | 3/1.0 | 932 (0%) | 1mo | $170,000 | $182 | 86 |
| 3115 Houston Dr | 0.11mi | 3/1.0 | 864 (-7%) | 4mo | $106,000 | $123 | 79 |
| 3067 Huntington Dr | 0.18mi | 3/1.0 | 864 (-7%) | 4mo | $158,000 | $183 | 76 |
| 3018 Woodway Rd | 0.38mi | 3/1.0 | 896 (-4%) | 1mo | $176,400 | $197 | 75 |
| 1382 Southfield Dr S | 0.33mi | 3/1.0 | 896 (-4%) | 6mo | $175,000 | $195 | 73 |
| 3072 Bluefield Dr | 0.22mi | 3/1.0 | 864 (-7%) | 5mo | $180,000 | $208 | 73 |
| 2963 Fairwood Ave | 0.41mi | 3/1.0 | 896 (-4%) | 6mo | $180,200 | $201 | 69 |
| 3032 Baker Hill Rd | 0.63mi | 3/1.0 | 938 (+1%) | 2mo | $202,900 | $216 | 68 |
| 1471 Watkins Rd | 0.34mi | 3/1.0 | 864 (-7%) | 7mo | $165,000 | $191 | 66 |
| 1338 Clarfield Ave | 0.38mi | 2/1.0 (-1) | 985 (+6%) | 8mo | $170,000 | $173 | 61 |
| 3217 Fairwood Ave | 0.33mi | 3/1.0 | 825 (-12%) | 8mo | $230,000 | $279 | 59 |
| 1249 Evergreen Rd | 0.68mi | 3/1.0 | 1,012 (+9%) | 1mo | $120,000 | $119 | 53 |
Match score weights: distance 35% · size 25% · config 20% · recency 20%. Top-matched comps best support the ARV.
Projected returns pro-forma
-3.0% appreciation · 2.32% rent growth · sell at horizon
- IRR
- -15.1%
- Equity multiple
- 0.46×
- Total profit
- $-26,979
- Equity at exit
- $26,839
- IRR
- -7.6%
- Equity multiple
- 0.53×
- Total profit
- $-23,630
- Equity at exit
- $15,563
Cash invested: $50,400 (down + closing). Projections, not guarantees.
Landlord ↔ Tenant lean methodology
- Overall (STATE)
- 73 Landlord-Friendly
- State Ohio
- 73 Landlord-Friendly · R+6
- County
- — inherits STATE
- City
- — inherits STATE
ZIP-level market 43207
- Rents YoY
- 2.3%
- Active inventory
- 196
- Price-to-rent
- 9.8×
Monthly cashflow live
- Estimated rent
- $1,537 high interval (Pro) →
- Mortgage (P&I)
- −$944
- Tax from tax record
- −$144 /mo · $1,727/yr
- Insurance
- −$75
- HOA
- −$0
- Vacancy / Maint / Mgmt
- −$323
- Net cashflow
- $51
Break-even live
UW: 25.0% down · 7.5% · 30yr · 1.5% tax · 5.0% vac · 8.0% maint · 8.0% mgmt
Financing live
Cash to close
- Down payment
- $45,000
- Closing costs
- $5,400
- Reserves months
- —
- Total cash needed
- —
Loan-product check · same deal, 3 products live
Conventional
25% down · 7.5% · 30yr
- Down + closing
- —
- Monthly P&I
- —
- Monthly cashflow
- —
- DSCR
- —
- Eligible?
- —
Personal DTI + credit; lowest rate.
DSCR
20% down · 8.5% · 30yr
- Down + closing
- —
- Monthly P&I
- —
- Monthly cashflow
- —
- DSCR
- —
- Eligible?
- —
No personal income docs; deal must DSCR.
Hard money
10% down · 12.0% · 12mo
- Down + closing
- —
- Monthly P&I
- —
- Monthly cashflow
- —
- DSCR
- —
- Eligible?
- —
Short-term bridge; refi at stabilization.
Rent comps 5 comps
| Address | Beds | Baths | Sqft | Rent | $/sqft | DOM | Units | Dist |
|---|---|---|---|---|---|---|---|---|
| 1584 Southfield Dr S Columbus, OH | 3.0 | 1.0 | 934 | $1,495 | $1.60 | 3d | 1 | 0.03mi |
| 1503 Southfield Dr S Columbus, OH | 3.0 | 1.0 | 900 | $1,395 | $1.55 | 7d | 1 | 0.17mi |
| 3047 Baker Hill Rd Columbus, OH | 3.0 | 1.0 | 896 | $1,300 | $1.45 | 43d | 1 | 0.66mi |
| 1285 Evergreen Rd Columbus, OH | 3.0 | 2.0 | 888 | $1,750 | $1.97 | 20d | 1 | 0.68mi |
| 1074 Tobi Dr Columbus, OH | 3.0 | 1.0 | 1066 | $1,495 | $1.40 | 43d | 1 | 1.29mi |
Listing history 7 events
-
2026-06-18days on market $180,000 Active 6 DOM
-
2026-06-17days on market $180,000 Active 5 DOM
-
2026-06-16days on market $180,000 Active 4 DOM
-
2026-06-15days on market $180,000 Active 3 DOM
-
2026-06-13status $180,000 Active 1 DOM
-
2026-06-09remarks 403-char remark
-
2026-06-09$180,000 Coming Soon 1 DOM
ⓘ Source: listings_history table (triggers on properties + properties_extension) + one-shot
backfill from property_details.listing_events for pre-trigger history.
Tax reassessment forecast OH · Partial reset (capped growth)
- Current annual tax
- $1,727 · $144/mo
- Projected year-2 tax
- $2,267 · $189/mo
- Expected delta
- +$541/yr (+$45/mo · 31.3%)
ⓘ Screening estimate from a state-policy table — verify with the county assessor before closing.
Climate risk First Street
- Flood 1/10 Low FEMA zone X (unshaded) · 0% chance over 30 yrs
- Wildfire 1/10 Low
- Heat 4/10 Moderate 7 d/yr ≥100°F today · 18 d/yr by 30 yrs out
- Wind 2/10 Low 100% chance of damaging wind over 30 yrs
- Air quality 3/10 Moderate 2 unhealthy d/yr today · 3 by 30 yrs out
Nearby sold comps map
Loading sold comps map…
Walkable amenities ~0.75 mi
Loading nearby amenities…
Taxation est. · year 1
- Rental income
- $18,441
- − Mortgage interest
- −$10,083
- − Property taxes
- −$1,727
- − Insurance
- −$900
- − Repairs & maintenance
- −$1,475
- − Management
- −$1,475
- − Depreciation
- −$5,236
- Taxable loss
- −$2,456
- Est. tax savings @ 24.0%
- +$589
- After-tax cash flow
- $1,204/yr
For passive investors: Depreciation is non-cash, so a rental often shows a tax loss while cash-flowing — sheltering income. Rental losses are passive: they offset passive income freely, and up to $25,000/yr can offset ordinary (W-2) income if you actively participate and your MAGI is under $100k (phasing out to $0 by $150k); unused losses carry forward. On sale, claimed depreciation is recaptured at up to 25%, and gains may owe capital-gains tax (a 1031 exchange can defer both). Figures are a year-1 estimate at your 24.0% rate — not tax advice; consult a CPA.
Schools (NCES district)
- District
- Columbus City School District
- NCES district ID
- 3904380
- Math proficiency
- 15% ▼ -17.00%
- Reading proficiency
- 26% ▼ -12.00%
- Median HH income
- $38,483
- Composite
- 17.19/100
- National rank
- #9105
- State rank
- #626 of 656 in OH
Livability — Columbus
- Score
- 81/100
- State rank
- #97
- US rank
- #1491
Category grades
Schools grade is shown separately in the Schools card above.
Census & demographics
- Census place
- Columbus, OH
- County
- Franklin County · 1,351,780 people
- City population
- 612,189
- Metro
- Columbus, OH
- Population (ZIP)
- 47,272
- Household income
- $63,310
- Rent vs Own
- Severe rent burden
- 1679.0
Population outlook (Franklin County) Hauer SSP2
- Today (2025)
- 1,456,139 people
- By 2030
- 1,556,890 · +6.9%
- By 2040
- 1,757,349 · +20.7%
- By 2050
- 1,950,539 · +34.0%
- By 2075
- 2,376,171 · +63.2%
- By 2100
- 2,636,796 · +81.1%
Race, ethnicity, and origin ACS 2023
- Neighborhood character
- Diverse neighborhood (Simpson 0.57)
- Race & ethnicity
- White 59% Black 28% Two or more races 7% Hispanic / Latino 5% Asian 1%
- Hispanic origin (detail)
- Mexican 3%
- Common ancestry
- Italian 2% Romanian 2% Slovak 1%
- Foreign-born
- 4% · Canada
- Languages at home
- 95% English-only · Spanish 3% Other Indo-European 1%
Political lean MEDSL · Franklin
- 2024 margin
- Strong D (+28.4) · D 63.7% · R 35.3% · Other 1.0%
- 2008→2024 swing
- +7.7pp toward D · 2008: 20.7pp · 2024: 28.4pp
- All cycles
- 2024: D+28.4 2020: D+31.4 2016: D+25.9 2012: D+21.7 2008: D+20.7
Not yet ingested
- Civics
- —
Market trends
- HPI YoY
- ▼ -244.33%
- Current HPI
- 268.3028
- Rent YoY
- ▲ 2.32%
- Metro
- Columbus, OH
- State GDP YoY
- ▲ 1.98%
- F500 in state
- 48
Industry mix (Fortune 500 HQ in OH)
| Industry | F500 HQs | Revenue |
|---|---|---|
| Insurance | 3 | $145B |
|
||
| Industrial Machinery | 3 | $49B |
|
||
| Financial Services | 3 | $24B |
|
||
| Consumer Goods | 2 | $93B |
|
||
| Aerospace / Defense | 2 | $47B |
|
||
| Utilities | 2 | $33B |
|
||
Price history
+200.0% since first listed13 events — show timeline
- 2026-06-08 Coming Soon $180,000 CBRMLS
- 2024-11-02 Listing Removed — CBRMLS
- 2024-10-16 Price Changed $174,900 CBRMLS
- 2024-10-04 Relisted — CBRMLS
- 2024-09-13 Contingent — CBRMLS
- 2024-09-09 Price Changed $179,900 CBRMLS
- 2024-08-26 Listed $184,900 CBRMLS
- 2019-11-07 Sold (Public Records) $98,000 Public Records
- 2019-10-31 Sold (MLS) $98,000 CBRMLS
- 2019-09-19 Contingent — CBRMLS
- 2019-09-17 Listed $98,000 CBRMLS
- 2005-04-14 Sold (Public Records) $76,000 Public Records
- 2001-08-16 Sold (Public Records) $60,000 Public Records
Property tax history
+7.1%/yrLatest (2024): $1,727 · +1.3% YoY. Source: county tax records.
Cash-flow waterfall
monthlySold comps — $/sqft
last 12 mo · ≤1 miLoading sold comps…