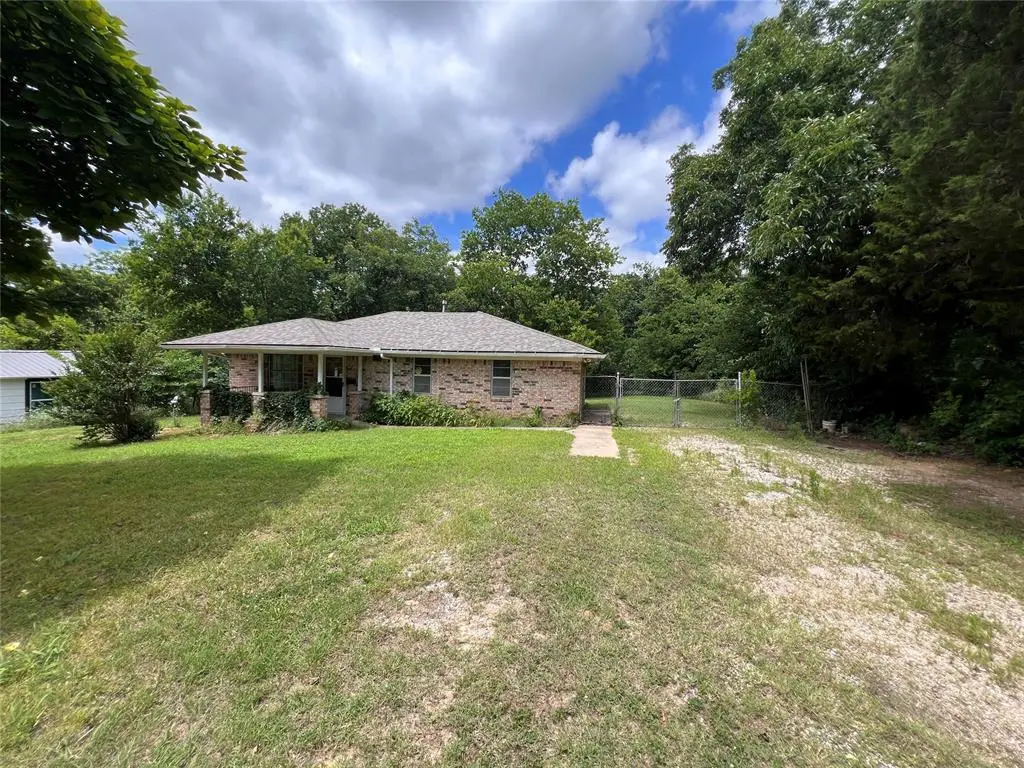
1209 Jefferson St · Seminole, OK
Flood risk 1/10 · Minimal
- FEMA flood zone
- X (unshaded)
- Chance of flooding over 30 yrs
- 0.0%
- Est. flood insurance / yr
- $507 – $1,088
Fire risk 9/10 · Severe
- Est. fire insurance / yr
- $2,463 – $4,575
Heat risk 5/10 · Moderate
- Hot days now (above 111°F)
- 7 days/yr
- Hot days in 30 yrs
- 19 days/yr
Wind risk 3/10 · Minor
- Chance of severe wind over 30 yrs
- 8.0%
Air-quality risk 2/10 · Minimal
- Unhealthy air days now
- 1 days/yr
- Unhealthy air days in 30 yrs
- 1 days/yr
Risk factors via First Street. Map © Google.
Why this score? — see what drove the B- grade
The composite is a weighted blend of 9 inputs, each scored 0–100. Each bar is that input's sub-score; the figure is the points it added to the 100-point composite (weight × sub-score).
- Cash flow +25.3/30.0
- ARV discount +10.5/15.0
- Appreciation +10.0/10.0
- DSCR +8.3/10.0
- 1% rule +6.0/10.0
- Livability +3.2/5.0
- Rent growth +2.5/5.0
- Condition / age +2.5/5.0
- Schools +1.6/10.0
$99,000
🖨 Deal sheet (PDF) 📄 Offer letter ✓ Due diligence
Listing remarks MLS
Updated 3 BR/1 Bath brick home on 6 city lots located in the heart of Seminole. This home has new flooring, paint and updated bath. Fenced backyard with two storage buildings, carport and deck.
Key facts
- Wood-look flooring
- Natural light
- Brick home
Tags
Property features AI
Finance
- Other: Homestead: No
- Financial info: Assumable: Unknown; Loan qualification: Unknown
- HOA & community: No mandatory association dues
Exterior
- Parking: 1-car garage
- Home design: Single-family residence; Single story; Existing property
- Construction: Brick and frame construction; Composition roof; Built status: existing
- Exterior features: Open deck; Open patio; Interior lot
Interior
- Bedrooms: 3 bedrooms
- Bathrooms: 1 full bathroom
- Heating & cooling: Conventional foundation
- Interior features: One living area; No fireplace; Storage
Neighborhood map
What this means for you Summary
Snapshot
- This is a 3-bed/1.0-bath single-family listed at $99k.
Deal economics
- At list price, monthly cash flow is $224 ($3k/yr) — positive.
- The deal already cash-flows at list — no discount required.
- Meets the 1% rule at list price ($1k rent vs $99k).
- Cap rate 9.0% vs local median 4.8% in Seminole — top-decile yield for the area; either an underpriced asset or a hidden risk that comps aren't pricing in. Stress-test before assuming the spread holds.
Location & tenants
- Location reads 63/100 on livability (#222 in OK) — a middle-class / working-renter tenant base. Strengths: cost of living A+, housing A; Watch: crime D+, amenities F, commute F.
- Seminole (town): math 17% / reading 21% proficiency, ranked #193 of 270 in OK (top 72%) — low school quality limits family demand, transient renter base, plan for 1-2y turnover; 63% free/reduced lunch — lower-income household profile, screen leases tightly.
- Zoned schools: Wilson Es (math 27% / reading 22%, grade F, #354 of 845 statewide, top 47%, 499 students, 0% FRL); Northwood Es (math 19% / reading 21%, grade F, #158 of 345 statewide, top 47%, 301 students, 0% FRL); Seminole Hs (math 17% / reading 27%, grade F, #222 of 447 statewide, top 52%, 451 students, 0% FRL) — zoned schools average 0% FRL vs 63% district-wide (63 pts lower); this property's tenant base skews higher-income than the district average.
- Market conditions: 136 active listings in the ZIP; 93 units permitted in Seminole County in 2024 (43 in 5+ unit buildings).
Forward outlook
- In year one you build about $11k of equity ($684 loan paydown + $10k appreciation (10.0% local appreciation)).
- At projected returns (10.0% appreciation + 3.0% rent growth), your $28k cash investment doubles in ~2 years — after that, you're playing with house money.
- By year 4, paydown + projected appreciation supports a ~$38k cash-out refi (75% LTV) — recoverable capital for the next deal without selling this one.
Negotiation context
- Only 9 days on market — expect competitive offers; lowballing is unlikely to land.
- 4 sale attempts since 8y ago; this cycle's ask has dropped $81k (45%) from the opening price — seller is motivated, your offer sets the floor, not the list.
- Current owner paid $70k; 41% above their basis — modest negotiation headroom, anchor on the comps not their cost.
Risks & watch-outs
- Climate carrying-cost: severe wildfire risk; extreme-heat days projected 7→19/yr by 2055 (HVAC capex compounding) — expect insurance premiums to compound above CPI over the hold.
Questions for the listing agent
- Built in 1975 — when were the roof, HVAC, electrical panel, plumbing, and water heater last replaced?
- Is there a deadline driving the sale (1031 exchange, divorce, estate, relocation)? That informs how much negotiation room exists.
- Schools are F-rated, which usually means shorter tenancies and higher turnover. Who's the typical renter profile here, and what's been the actual vacancy rate?
- Crime grade is D in this area — have there been break-ins, vandalism, or insurance claims at this property in the last 3 years? What carrier currently insures it and at what premium?
- What's the average days-on-market for RENTAL listings here right now (not sales)? A rising rental-DOM trend means longer vacancies and softer asking-rent achievability than the comps imply.
- What's the recent tenant-quality profile in this submarket — average credit score on applications, eviction rate, late-payment / NSF rate, and stable-employment percentage? A property-management company in the area should have these aggregated.
- How much new for-sale + rental construction is in the pipeline within 1–3 miles? Heavy new supply typically softens prices + rents 12–24 months out; constrained supply supports both.
Investment metrics
- 1% rule
- 1.10% ✓
- Cap rate
- 9.00%
- Cash-on-cash
- 9.68%
- DSCR
- 1.43
- GRM
- 7.6
CMA / ARV
- ARV (on-the-fly)
- $105,966
- Comps found
- 12
Show comp detail 12 sales within ~0.75 mi
| Address | Dist | Beds/Ba | Sqft | Sold | Price | $/sf | Match |
|---|---|---|---|---|---|---|---|
| 903 Jefferson St | 0.26mi | 3/1.0 | 1,235 (+1%) | 2mo | $100,000 | $81 | 84 |
| 600 Hoover St | 0.14mi | 3/1.0 | 1,152 (-5%) | 7mo | $17,000 | $15 | 78 |
| 1120 Eureka St | 0.07mi | 2/1.0 (-1) | 1,084 (-11%) | 3mo | $45,000 | $42 | 71 |
| 1314 Roosevelt St | 0.30mi | 3/1.0 | 1,092 (-10%) | 6mo | $26,000 | $24 | 64 |
| 712 Elm St | 0.71mi | 3/2.0 | 1,242 (+2%) | 1mo | $162,500 | $131 | 59 |
| 716 Elm St | 0.71mi | 3/2.0 | 1,242 (+2%) | 3mo | $165,900 | $134 | 57 |
| 1909 Grisso Dr | 0.54mi | 3/1.0 | 1,105 (-9%) | 6mo | $115,000 | $104 | 54 |
| 812 Hoover St | 0.33mi | 2/1.0 (-1) | 1,060 (-13%) | 6mo | $49,000 | $46 | 53 |
| 1809 Grisso Dr | 0.50mi | 3/1.0 | 1,077 (-12%) | 6mo | $110,000 | $102 | 52 |
| 307 W Evans Ave | 0.62mi | 2/1.0 (-1) | 1,136 (-7%) | 4mo | $6,500 | $6 | 52 |
| 219 W Seminole Ave | 0.55mi | 3/1.0 | 1,388 (+14%) | 2mo | $133,355 | $96 | 50 |
| 901 Lincoln St | 0.56mi | 3/1.5 | 1,384 (+14%) | 6mo | $120,000 | $87 | 44 |
Match score weights: distance 35% · size 25% · config 20% · recency 20%. Top-matched comps best support the ARV.
Projected returns pro-forma
10.0% appreciation · 3.0% rent growth · sell at horizon
- IRR
- 31.3%
- Equity multiple
- 3.46×
- Total profit
- $68,148
- Equity at exit
- $89,187
- IRR
- 27.1%
- Equity multiple
- 7.83×
- Total profit
- $189,463
- Equity at exit
- $192,335
Cash invested: $27,720 (down + closing). Projections, not guarantees.
Landlord ↔ Tenant lean methodology
- Overall (STATE)
- 83 Strongly Landlord-Friendly
- State Oklahoma
- 83 Strongly Landlord-Friendly · R+20
- County
- — inherits STATE
- City
- — inherits STATE
ZIP-level market 74868
- Home prices YoY
- 6.4%
- Active inventory
- 136
- Price-to-rent
- 7.6×
Monthly cashflow live
- Estimated rent
- $1,093 medium interval (Pro) →
- Mortgage (P&I)
- −$519
- Tax from tax record
- −$79 /mo · $949/yr
- Insurance
- −$41
- HOA
- −$0
- Vacancy / Maint / Mgmt
- −$229
- Net cashflow
- $224
Break-even live
Sensitivity live
| Price | -10% $280 | -5% $252 | +0% $224 | +5% $196 | +10% $168 |
|---|---|---|---|---|---|
| Rent | -10% $137 | -5% $180 | +0% $224 | +5% $267 | +10% $310 |
| Rate | -1.0pp $273 | -0.5pp $249 | base $224 | +0.5pp $198 | +1.0pp $172 |
UW: 25.0% down · 7.5% · 30yr · 1.5% tax · 5.0% vac · 8.0% maint · 8.0% mgmt
Financing live
Cash to close
- Down payment
- $24,750
- Closing costs
- $2,970
- Reserves months
- —
- Total cash needed
- —
Loan-product check · same deal, 3 products live
Conventional
25% down · 7.5% · 30yr
- Down + closing
- —
- Monthly P&I
- —
- Monthly cashflow
- —
- DSCR
- —
- Eligible?
- —
Personal DTI + credit; lowest rate.
DSCR
20% down · 8.5% · 30yr
- Down + closing
- —
- Monthly P&I
- —
- Monthly cashflow
- —
- DSCR
- —
- Eligible?
- —
No personal income docs; deal must DSCR.
Hard money
10% down · 12.0% · 12mo
- Down + closing
- —
- Monthly P&I
- —
- Monthly cashflow
- —
- DSCR
- —
- Eligible?
- —
Short-term bridge; refi at stabilization.
Listing history 25 events
-
2026-06-21days on market $99,000 Active 9 DOM
-
2026-06-21days on market $99,000 Active 8 DOM
-
2026-06-18days on market $99,000 Active 6 DOM
-
2026-06-17days on market $99,000 Active 5 DOM
-
2026-06-16days on market $99,000 Active 4 DOM
-
2026-06-15days on market $99,000 Active 3 DOM
-
2026-06-12remarks 699-char remark
-
2026-06-12pricedays on market $99,000 Active 1 DOM
-
2026-06-04days on market $130,000 Active 365 DOM
-
2026-06-02days on market $130,000 Active 364 DOM
-
2026-06-01days on market $130,000 Active 363 DOM
-
2026-05-31days on market $130,000 Active 362 DOM
-
2026-03-22price $130,000
-
2025-12-03status Active
-
2025-12-03price $160,000
-
2025-12-02historical
-
2025-08-13price $163,000
-
2025-07-03price $175,000
-
2025-06-02$180,000 Active
-
2019-12-05soldstatus $70,000
-
2019-12-04soldstatus $69,900 193-char remark
Show marketing remark (193 chars)
Updated 3 BR/1 Bath brick home on 6 city lots located in the heart of Seminole. This home has new flooring, paint and updated bath. Fenced backyard with two storage buildings, carport and deck.
-
2019-07-17$69,900 193-char remark
Show marketing remark (193 chars)
Updated 3 BR/1 Bath brick home on 6 city lots located in the heart of Seminole. This home has new flooring, paint and updated bath. Fenced backyard with two storage buildings, carport and deck.
-
2019-02-12soldstatus $20,000 171-char remark
Show marketing remark (171 chars)
3 BR/1BA brick home on 6 lots. This home needs a little TLC to be a great starter or investment property. Fenced yard and 1 car carport. Gas cooktop and built in gas oven.
-
2018-05-09$39,900 171-char remark
Show marketing remark (171 chars)
3 BR/1BA brick home on 6 lots. This home needs a little TLC to be a great starter or investment property. Fenced yard and 1 car carport. Gas cooktop and built in gas oven.
-
2004-08-10soldstatus $24,000
ⓘ Source: listings_history table (triggers on properties + properties_extension) + one-shot
backfill from property_details.listing_events for pre-trigger history.
Tax reassessment forecast OK · Resets to sale price
- Current annual tax
- $949 · $79/mo
- Projected year-2 tax
- $949 · $79/mo
- Expected delta
- $0/yr ($0/mo · 0.0%)
ⓘ Screening estimate from a state-policy table — verify with the county assessor before closing.
Climate risk First Street
- Flood 1/10 Low FEMA zone X (unshaded) · 0% chance over 30 yrs
- Wildfire 9/10 Extreme
- Heat 5/10 Major 7 d/yr ≥111°F today · 19 d/yr by 30 yrs out
- Wind 3/10 Moderate 8% chance of damaging wind over 30 yrs
- Air quality 2/10 Low 1 unhealthy d/yr today · 1 by 30 yrs out
Nearby sold comps map
Loading sold comps map…
Walkable amenities ~0.75 mi
Loading nearby amenities…
Taxation est. · year 1
- Rental income
- $13,110
- − Mortgage interest
- −$5,546
- − Property taxes
- −$949
- − Insurance
- −$495
- − Repairs & maintenance
- −$1,049
- − Management
- −$1,049
- − Depreciation
- −$2,880
- Taxable income
- $1,143
- Est. tax owed @ 24.0%
- −$274
- After-tax cash flow
- $2,409/yr
For passive investors: Depreciation is non-cash, so a rental often shows a tax loss while cash-flowing — sheltering income. Rental losses are passive: they offset passive income freely, and up to $25,000/yr can offset ordinary (W-2) income if you actively participate and your MAGI is under $100k (phasing out to $0 by $150k); unused losses carry forward. On sale, claimed depreciation is recaptured at up to 25%, and gains may owe capital-gains tax (a 1031 exchange can defer both). Figures are a year-1 estimate at your 24.0% rate — not tax advice; consult a CPA.
Schools (NCES district)
- District
- Seminole
- NCES district ID
- 4027300
- Math proficiency
- 17% ▼ -10.00%
- Reading proficiency
- 21% ▼ -5.00%
- Median HH income
- $33,661
- Composite
- 15.51/100
- National rank
- #9304
- State rank
- #193 of 270 in OK
Livability — Seminole
- Score
- 63/100
- State rank
- #222
- US rank
- #15706
Category grades
Schools grade is shown separately in the Schools card above.
Census & demographics
- Census place
- Seminole, OK
- Population (ZIP)
- 12,451
Population outlook (Seminole County) Hauer SSP2
- Today (2025)
- 25,628 people
- By 2030
- 25,617 · +-0.0%
- By 2040
- 25,619 · +-0.0%
- By 2050
- 25,726 · +0.4%
- By 2075
- 26,261 · +2.5%
- By 2100
- 25,844 · +0.8%
Race, ethnicity, and origin ACS 2023
- Neighborhood character
- Diverse neighborhood (Simpson 0.57)
- Race & ethnicity
- White 65% Native American 19% Two or more races 10% Hispanic / Latino 5% Black 4%
- Hispanic origin (detail)
- Mexican 4%
- Common ancestry
- Iranian 1% Italian 1% Slovak 1%
- Foreign-born
- 3% · Canada
- Languages at home
- 96% English-only · Spanish 2%
Political lean MEDSL · Seminole
- 2024 margin
- Solid R (+49.7) · D 24.2% · R 74.0% · Other 1.8%
- 2008→2024 swing
- -19.1pp toward R · 2008: -30.6pp · 2024: -49.7pp
- All cycles
- 2024: R+49.7 2020: R+46.3 2016: R+44.1 2012: R+30.3 2008: R+30.6
Not yet ingested
- Civics
- —
Market trends
- HPI YoY
- ▲ 15.39%
- Current HPI
- 255.6657
- Rent YoY
- —
- Metro
- —
- State GDP YoY
- ▲ 1.55%
- F500 in state
- 6
Industry mix (Fortune 500 HQ in OK)
| Industry | F500 HQs | Revenue |
|---|---|---|
| Energy | 3 | $48B |
|
||
Price history
+441.7% since first listed13 events — show timeline
- 2026-03-22 Price Changed $130,000 MLSOK
- 2025-12-03 Relisted — MLSOK
- 2025-12-03 Price Changed $160,000 MLSOK
- 2025-12-02 Listing Removed — MLSOK
- 2025-08-13 Price Changed $163,000 MLSOK
- 2025-07-03 Price Changed $175,000 MLSOK
- 2025-06-02 Listed $180,000 MLSOK
- 2019-12-05 Sold (Public Records) $70,000 Public Records
- 2019-12-04 Sold (MLS) $69,900 MLSOK
- 2019-07-17 Listed $69,900 MLSOK
- 2019-02-12 Sold (MLS) $20,000 MLSOK
- 2018-05-09 Listed $39,900 MLSOK
- 2004-08-10 Sold (Public Records) $24,000 Public Records
Property tax history
+9.5%/yrLatest (2025): $949 · +6.5% YoY. Source: county tax records.
Cash-flow waterfall
monthlySold comps — $/sqft
last 12 mo · ≤1 miLoading sold comps…