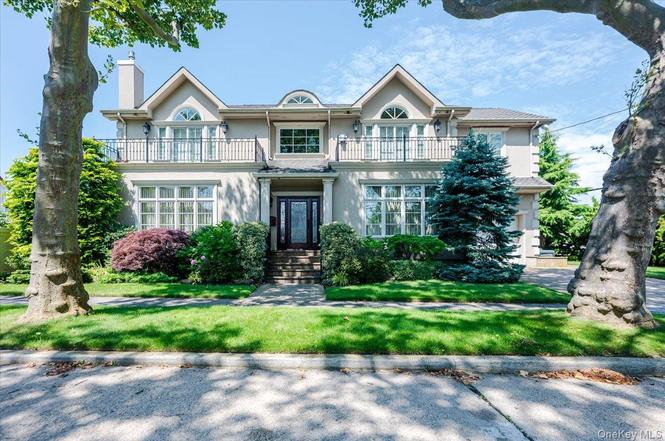
83 Ithaca Ave · Atlantic Beach, NY
Flood risk 4/10 · Minor
- FEMA flood zone
- AE
- Chance of flooding over 30 yrs
- 0.2%
- Est. flood insurance / yr
- $2,026 – $9,024
Fire risk 3/10 · Minor
- Est. fire insurance / yr
- $691 – $1,283
Heat risk 6/10 · Moderate
- Hot days now (above 95°F)
- 7 days/yr
- Hot days in 30 yrs
- 14 days/yr
Wind risk 8/10 · Major
- Chance of severe wind over 30 yrs
- 80.0%
Air-quality risk 4/10 · Minor
- Unhealthy air days now
- 4 days/yr
- Unhealthy air days in 30 yrs
- 6 days/yr
Risk factors via First Street. Map © Google.
Why this score? — see what drove the C grade
The composite is a weighted blend of 9 inputs, each scored 0–100. Each bar is that input's sub-score; the figure is the points it added to the 100-point composite (weight × sub-score).
- Cash flow +18.3/30.0
- Appreciation +10.0/10.0
- ARV discount +7.5/15.0
- DSCR +5.8/10.0
- Schools +4.2/10.0
- 1% rule +4.1/10.0
- Livability +3.6/5.0
- Rent growth +2.5/5.0
- Condition / age +2.5/5.0
$2,750,000
🖨 Deal sheet (PDF) 📄 Offer letter ✓ Due diligence
Listing remarks
Recently Reduced Price !!! Thinking about buying a home in Atlantic Beach, this is the perfect house at the perfect time and perfect price!!!! Summer is around the corner. A one of-a-kind CUSTOM BUILT HOME WITH INGROUND GUNITE HEATED POOL. FULL FINISHED BASEMENT WITH FAMILY ROOM, BEDROOM, FULL BATH, SUMMER KITCHEN & MUCH MORE * * * * * * * * * Mint Condition. * * * * AN AMAZING OPPORTUNITY TO OWN THIS HOME * * * SHORT WALK TO BEACH * * * * SHORT WALK TO ALL HOUSES OF WORSHIP * * * * Using only the best quality and materials this Home Combines A Mediterranean & Contemporary Style giving it a Bright Open Warm Feeling . .. .. 5 Bedrooms, 4.5 Bath
Key facts
- Grand foyer
- Enormous kitchen
- Custom moldings
Tags
Neighborhood map
What this means for you Summary
Snapshot
- This is a 5-bed/5.0-bath single-family listed at $2.75M.
Deal economics
- At list price, monthly cash flow is $2k ($25k/yr) — positive.
- The deal already cash-flows at list — no discount required.
- To meet the 1% rule (rent ≥ 1% of price), the offer needs to be $2.50M (9.0% below list).
- Recommended offer: $2.42M (12.0% below list) — sets the bar for market timing.
Location & tenants
- Location reads 72/100 on livability (#376 in NY) — a middle-class / working-renter tenant base. Strengths: crime A+, commute A+, employment A+; Watch: amenities F, cost of living F.
- Lawrence Union Free School District (suburban): math 43% / reading 46% proficiency, ranked #399 of 590 in NY (top 68%) — families likely to look elsewhere, expect single-tenant / working-renter base with shorter leases.
- Zoned schools: Lawrence Elementary School At Broadway Campus (math 35% / reading 52%, grade F, #1,350 of 2,108 statewide, top 64%, 480 students, 78% FRL); Lawrence Middle School At Broadway Campus (math 12% / reading 37%, grade F, #611 of 729 statewide, top 88%, 405 students, 79% FRL); Lawrence Senior High School (math 87% / reading 30%, grade C, #877 of 1,100 statewide, top 80%, 770 students, 70% FRL) — zoned schools average 76% FRL vs 52% district-wide (24 pts higher); higher-poverty schools than district average — tighter screening recommended.
- Market conditions: 31 active listings in the ZIP; 5 comparable units currently listed for rent nearby; rentals at typical pace (median 27d on market — plan ~3-4 weeks tenant-placement turnaround); 824 units permitted in Nassau County in 2024 (153 in 5+ unit buildings).
Forward outlook
- In year one you build about $294k of equity ($19k loan paydown + $275k appreciation (10.0% local appreciation)).
- Nassau County population projected at +7% by 2050 — modest demand growth; plan on rents tracking national, not racing it.
- At projected returns (10.0% appreciation + 3.0% rent growth), your $770k cash investment doubles in ~3 years — after that, you're playing with house money.
- By year 2, paydown + projected appreciation supports a ~$473k cash-out refi (75% LTV) — recoverable capital for the next deal without selling this one.
Negotiation context
- It's been on market 342 days — a 12% lower offer ($2.42M) is reasonable based on typical stale-listing flexibility.
- 4 sale attempts since 6y ago; this cycle's ask has dropped $450k (14%) from the opening price — seller is motivated, your offer sets the floor, not the list.
- Current owner paid $675k; list at $2.75M implies a 307% gain — meaningful room to come down on a strong offer.
Risks & watch-outs
- Watch-outs: flood insurance adds $460/mo.
- Climate carrying-cost: in FEMA flood zone AE (mandatory federal flood insurance); severe wind risk, 80% chance of damaging wind over 30y; extreme-heat days projected 7→14/yr by 2055 (HVAC capex compounding) — expect insurance premiums to compound above CPI over the hold.
Questions for the listing agent
- It's been on market 342 days. Have you received any prior offers? Is the seller open to a 12% concession, seller financing, or rate buy-down credit?
- What's the actual annual flood-insurance premium (NFIP or private), and is the property in a SFHA with mandatory coverage?
- Why hasn't it sold? Are there any deal-killer items the seller is aware of (foundation, flood, title, zoning, code violations)?
- Is there a deadline driving the sale (1031 exchange, divorce, estate, relocation)? That informs how much negotiation room exists.
- What's the average days-on-market for RENTAL listings here right now (not sales)? A rising rental-DOM trend means longer vacancies and softer asking-rent achievability than the comps imply.
- What's the recent tenant-quality profile in this submarket — average credit score on applications, eviction rate, late-payment / NSF rate, and stable-employment percentage? A property-management company in the area should have these aggregated.
- How much new for-sale + rental construction is in the pipeline within 1–3 miles? Heavy new supply typically softens prices + rents 12–24 months out; constrained supply supports both.
Investment metrics
- 1% rule
- 0.91% ✗
- Cap rate
- 7.40%
- Cash-on-cash
- 3.94%
- DSCR
- 1.18
- GRM
- 9.2
CMA / ARV
- ARV (on-the-fly)
- $1,416,246
- Comps found
- 7
Show comp detail 7 sales within ~0.75 mi
| Address | Dist | Beds/Ba | Sqft | Sold | Price | $/sf | Match |
|---|---|---|---|---|---|---|---|
| 83 Ithaca Ave | 0.00mi | 5/4.5 | 4,000 (+14%) | 0mo | $2,225,000 | $556 | 75 |
| 1830 Bay Blvd | 0.12mi | 5/5.0 | 3,602 (+2%) | 20mo | $3,700,000 | $1,027 | 74 |
| 113 Dutchess Blvd | 0.22mi | 4/4.5 (-1) | 3,530 (+0%) | 19mo | $3,400,000 | $963 | 66 |
| 1590 Beech St | 0.57mi | 5/4.0 | 3,300 (-6%) | 6mo | $1,325,000 | $402 | 54 |
| 1515 Park St | 0.70mi | 5/4.0 | 3,600 (+2%) | 17mo | $1,350,000 | $375 | 46 |
| 146 Beach 5th St | 0.71mi | 6/4.0 (+1) | 3,942 (+12%) | 9mo | $1,425,000 | $361 | 30 |
| 229 Beach 3rd St | 0.72mi | 4/2.5 (-1) | 3,000 (-15%) | 23mo | $875,000 | $292 | 8 |
Match score weights: distance 35% · size 25% · config 20% · recency 20%. Top-matched comps best support the ARV.
Projected returns pro-forma
10.0% appreciation · 3.0% rent growth · sell at horizon
- IRR
- 26.6%
- Equity multiple
- 3.12×
- Total profit
- $1,628,919
- Equity at exit
- $2,477,418
- IRR
- 23.3%
- Equity multiple
- 7.09×
- Total profit
- $4,692,542
- Equity at exit
- $5,342,645
Cash invested: $770,000 (down + closing). Projections, not guarantees.
Landlord ↔ Tenant lean methodology
- Overall (STATE)
- 15 Strongly Tenant-Friendly
- State New York
- 15 Strongly Tenant-Friendly · D+10
- County
- — inherits STATE
- City
- — inherits STATE
ZIP-level market 11509
- Home prices YoY
- 2.9%
- Active inventory
- 31
- Price-to-rent
- 9.2×
Monthly cashflow live
- Estimated rent
- $25,016 medium interval (Pro) →
- Mortgage (P&I)
- −$14,421
- Tax from tax record
- −$1,669 /mo · $20,026/yr
- Insurance
- −$1,146
- Flood insurance flood zone
- −$460 /mo · $5,525/yr
- HOA
- −$0
- Vacancy / Maint / Mgmt
- −$5,253
- Net cashflow
- $2,067
Break-even live
Sensitivity live
| Price | -10% $3,623 | -5% $2,845 | +0% $2,067 | +5% $1,288 | +10% $510 |
|---|---|---|---|---|---|
| Rent | -10% $90 | -5% $1,078 | +0% $2,067 | +5% $3,055 | +10% $4,043 |
| Rate | -1.0pp $3,451 | -0.5pp $2,766 | base $2,067 | +0.5pp $1,354 | +1.0pp $629 |
UW: 25.0% down · 7.5% · 30yr · 1.5% tax · 5.0% vac · 8.0% maint · 8.0% mgmt
Financing live
Cash to close
- Down payment
- $687,500
- Closing costs
- $82,500
- Reserves months
- —
- Total cash needed
- —
Loan-product check · same deal, 3 products live
Conventional
25% down · 7.5% · 30yr
- Down + closing
- —
- Monthly P&I
- —
- Monthly cashflow
- —
- DSCR
- —
- Eligible?
- —
Personal DTI + credit; lowest rate.
DSCR
20% down · 8.5% · 30yr
- Down + closing
- —
- Monthly P&I
- —
- Monthly cashflow
- —
- DSCR
- —
- Eligible?
- —
No personal income docs; deal must DSCR.
Hard money
10% down · 12.0% · 12mo
- Down + closing
- —
- Monthly P&I
- —
- Monthly cashflow
- —
- DSCR
- —
- Eligible?
- —
Short-term bridge; refi at stabilization.
Rent comps 5 comps
| Address | Beds | Baths | Sqft | Rent | $/sqft | DOM | Units | Dist |
|---|---|---|---|---|---|---|---|---|
| 1701 Bay Blvd Atlantic Beach, NY | 4.0 | 3.0 | 2730 | $25,000 | $9.16 | 26d | 1 | 0.35mi |
| 77 Tioga Ave Atlantic Beach, NY | 4.0 | 2.5 | 2800 | $5,800 | $2.07 | 26d | 1 | 0.47mi |
| 1495 Bay Blvd Atlantic Beach, NY | 6.0 | 4.5 | 3744 | $20,000 | $5.34 | 1d | 1 | 0.73mi |
| 49 Harborview W Lawrence, NY | 4.0 | 4.5 | 3877 | $35,000 | $9.03 | 45d | 1 | 1.09mi |
| 215 Scott Dr Atlantic Beach, NY | 5.0 | 3.0 | 2862 | $22,500 | $7.86 | 1d | 1 | 1.11mi |
Listing history 13 events
-
2026-04-06status Pending
-
2026-03-27price $2,750,000
-
2026-01-01historical
-
2026-01-01status Active
-
2025-09-15price $2,995,000
-
2025-04-30$3,200,000 Active
-
2021-04-17historical
-
2021-04-01status Active
-
2021-03-26historical
-
2020-10-04$2,800,000 Active
-
2005-04-01soldstatus $675,000
-
1999-07-08soldstatus $311,000
-
1987-09-09soldstatus $305,000
ⓘ Source: listings_history table (triggers on properties + properties_extension) + one-shot
backfill from property_details.listing_events for pre-trigger history.
Tax reassessment forecast NY · Partial reset (capped growth)
- Current annual tax
- $20,026 · $1,669/mo
- Projected year-2 tax
- $33,251 · $2,771/mo
- Expected delta
- +$13,224/yr (+$1,102/mo · 66.0%)
ⓘ Screening estimate from a state-policy table — verify with the county assessor before closing.
Climate risk First Street
- Flood 4/10 Moderate FEMA zone AE · 20% chance over 30 yrs
- Wildfire 3/10 Moderate
- Heat 6/10 Major 7 d/yr ≥95°F today · 14 d/yr by 30 yrs out
- Wind 8/10 Severe 80% chance of damaging wind over 30 yrs
- Air quality 4/10 Moderate 4 unhealthy d/yr today · 6 by 30 yrs out
Nearby sold comps map
Loading sold comps map…
Walkable amenities ~0.75 mi
Loading nearby amenities…
Taxation est. · year 1
- Rental income
- $300,197
- − Mortgage interest
- −$154,043
- − Property taxes
- −$20,026
- − Insurance
- −$19,275
- − Repairs & maintenance
- −$24,016
- − Management
- −$24,016
- − Depreciation
- −$80,000
- Taxable loss
- −$21,178
- Est. tax savings @ 24.0%
- +$5,083
- After-tax cash flow
- $29,882/yr
For passive investors: Depreciation is non-cash, so a rental often shows a tax loss while cash-flowing — sheltering income. Rental losses are passive: they offset passive income freely, and up to $25,000/yr can offset ordinary (W-2) income if you actively participate and your MAGI is under $100k (phasing out to $0 by $150k); unused losses carry forward. On sale, claimed depreciation is recaptured at up to 25%, and gains may owe capital-gains tax (a 1031 exchange can defer both). Figures are a year-1 estimate at your 24.0% rate — not tax advice; consult a CPA.
Schools (NCES district)
- District
- Lawrence Union Free School District
- NCES district ID
- 3616830
- Math proficiency
- 43% ▼ -2.00%
- Reading proficiency
- 46% ▼ -8.00%
- Median HH income
- $91,008
- Composite
- 42.14/100
- National rank
- #3307
- State rank
- #399 of 590 in NY
Livability — Atlantic Beach
- Score
- 72/100
- State rank
- #376
- US rank
- #6459
Category grades
Schools grade is shown separately in the Schools card above.
Census & demographics
- Census place
- Atlantic Beach, NY
- City population
- 1,747
- Population (ZIP)
- 1,747
Population outlook (Nassau County) Hauer SSP2
- Today (2025)
- 1,409,302 people
- By 2030
- 1,431,482 · +1.6%
- By 2040
- 1,471,607 · +4.4%
- By 2050
- 1,502,845 · +6.6%
- By 2075
- 1,575,403 · +11.8%
- By 2100
- 1,554,356 · +10.3%
Race, ethnicity, and origin ACS 2023
- Neighborhood character
- Predominantly White (92%)
- Race & ethnicity
- White 92% Hispanic / Latino 5% Two or more races 3%
- Hispanic origin (detail)
- Mexican 2%
- Common ancestry
- Romanian 9% Scotch-Irish 8% Italian 3%
- Foreign-born
- 7% · Canada
- Languages at home
- 94% English-only · Other Indo-European 3% Spanish 1% Russian/Polish/Slavic 1%
Political lean MEDSL · Nassau
- 2024 margin
- Toss-up / Even · D 47.9% · R 52.1%
- 2008→2024 swing
- -12.6pp toward R · 2008: 8.4pp · 2024: -4.2pp
- All cycles
- 2024: R+4.2 2020: D+9.5 2016: D+5.3 2012: D+6.7 2008: D+8.4
Not yet ingested
- Civics
- —
Market trends
- HPI YoY
- ▲ 11.04%
- Current HPI
- 392.2777
- Rent YoY
- —
- Metro
- —
- State GDP YoY
- ▲ 2.60%
- F500 in state
- 92
Industry mix (Fortune 500 HQ in NY)
| Industry | F500 HQs | Revenue |
|---|---|---|
| Financial Services | 10 | $950B |
|
||
| Consumer Goods | 9 | $162B |
|
||
| Insurance | 4 | $225B |
|
||
| Telecommunications | 2 | $144B |
|
||
| Pharmaceuticals | 2 | $112B |
|
||
| Media / Entertainment | 2 | $69B |
|
||
Price history
+801.6% since first listed13 events — show timeline
- 2026-04-06 Pending — OneKey® MLS as Distributed by MLS Grid
- 2026-03-27 Price Changed $2,750,000 OneKey® MLS as Distributed by MLS Grid
- 2026-01-01 Listing Removed — OneKey® MLS as Distributed by MLS Grid
- 2026-01-01 Relisted — OneKey® MLS as Distributed by MLS Grid
- 2025-09-15 Price Changed $2,995,000 OneKey® MLS as Distributed by MLS Grid
- 2025-04-30 Listed $3,200,000 OneKey® MLS as Distributed by MLS Grid
- 2021-04-17 Listing Removed — OneKey® MLS as Distributed by MLS Grid
- 2021-04-01 Relisted — OneKey® MLS as Distributed by MLS Grid
- 2021-03-26 Listing Removed — OneKey® MLS as Distributed by MLS Grid
- 2020-10-04 Listed $2,800,000 OneKey® MLS as Distributed by MLS Grid
- 2005-04-01 Sold (Public Records) $675,000 Public Records
- 1999-07-08 Sold (Public Records) $311,000 Public Records
- 1987-09-09 Sold (Public Records) $305,000 Public Records
Property tax history
+1.6%/yrLatest (2024): $20,026 · +3.0% YoY. Source: county tax records.
Cash-flow waterfall
monthlySold comps — $/sqft
last 12 mo · ≤1 miLoading sold comps…