760 Cardinal Dr · Laplace, LA
Flood risk No data
- FEMA flood zone
- —
- Chance of flooding over 30 yrs
- —
- Est. flood insurance / yr
- —
Fire risk No data
- Est. fire insurance / yr
- —
Heat risk No data
- Hot days now (above threshold)
- —
- Hot days in 30 yrs
- —
Wind risk No data
- Chance of severe wind over 30 yrs
- —
Air-quality risk No data
- Unhealthy air days now
- —
- Unhealthy air days in 30 yrs
- —
Risk factors via First Street. Map © Google.
Why this score? — see what drove the C+ grade
The composite is a weighted blend of 9 inputs, each scored 0–100. Each bar is that input's sub-score; the figure is the points it added to the 100-point composite (weight × sub-score).
- Cash flow +27.3/30.0
- DSCR +9.5/10.0
- ARV discount +7.5/15.0
- 1% rule +6.3/10.0
- Livability +3.5/5.0
- Rent growth +2.5/5.0
- Condition / age +2.5/5.0
- Schools +1.7/10.0
- Appreciation +0.0/10.0
$165,000
🖨 Deal sheet 📄 Offer letter ✓ Due diligence
Listing remarks MLS
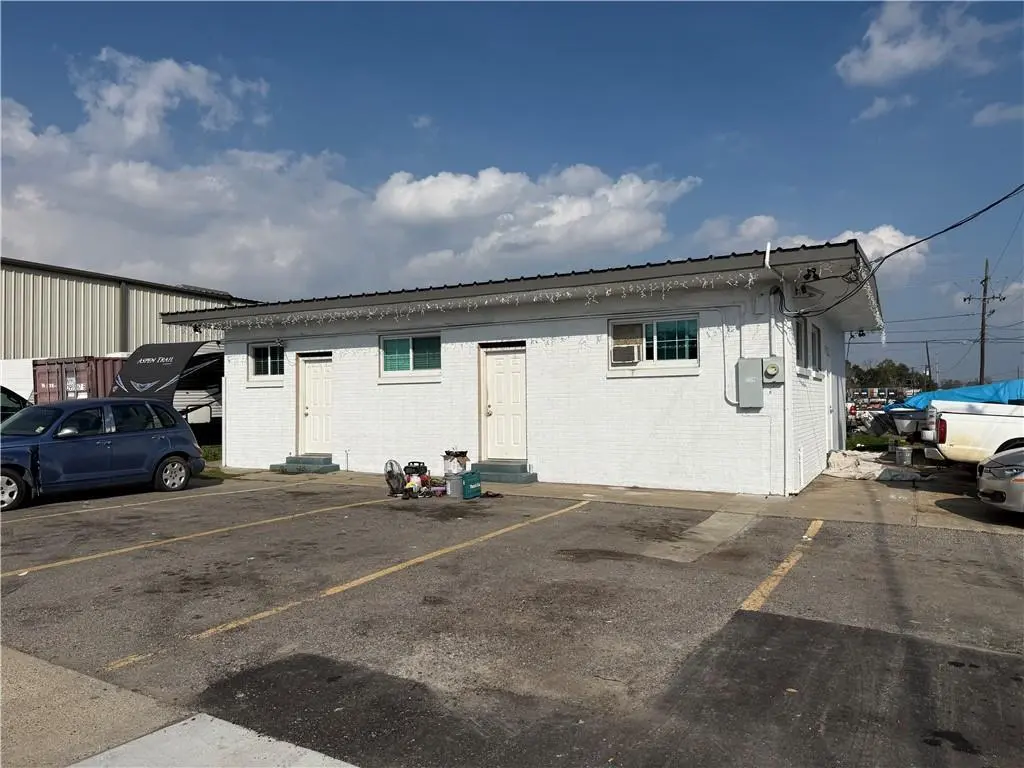
Duplex presently rented in Laplace area. Located near Airline Hwy. Each unit paying $1,250 at this time. Shared washer/dryer in rear or building. Freshly painted. Newer metal roof. Newer windows.
Key facts
- Laplace area
- Shared washer dryer
- Airline hwy
Tags
Neighborhood map
What this means for you Summary
Snapshot
- This is a 4-bed/4.0-bath land listed at $165k.
Deal economics
- At list price, monthly cash flow is $479 ($6k/yr) — positive.
- The deal already cash-flows at list — no discount required.
- Meets the 1% rule at list price ($2k rent vs $165k).
- Recommended offer: $145k (12.0% below list) — sets the bar for market timing.
- Cap rate 9.8% vs local median 4.8% in Laplace — top-decile yield for the area; either an underpriced asset or a hidden risk that comps aren't pricing in. Stress-test before assuming the spread holds.
Location & tenants
- Location reads 70/100 on livability (#61 in LA) — a middle-class / working-renter tenant base. Strengths: cost of living A+, housing A+, health & safety A+; Watch: crime F, amenities F, commute F.
- St. John The Baptist Parish (suburban): math 13% / reading 25% proficiency, ranked #68 of 98 in LA (top 69%) — low school quality limits family demand, transient renter base, plan for 1-2y turnover; 82% free/reduced lunch — lower-income household profile, screen leases tightly.
- Market conditions: 180 active listings in the ZIP; 61 units permitted in St. John the Baptist Parish in 2024 (0 in 5+ unit buildings).
- This rent runs 33% of the median local income ($68k/yr) — at the standard rent-burdened threshold; future hikes will face affordability resistance.
Forward outlook
- Local home prices are declining (-3.0%/yr); year-one equity from $1k of loan paydown is wiped out by about $5k of value loss. Plan a longer hold.
- St. John the Baptist County population projected at -20% by 2050 — secular population decline; favor cash flow + early exit over multi-decade hold.
- At projected returns (-3.0% appreciation + 3.0% rent growth), your $46k cash investment doubles in ~10 years — after that, you're playing with house money.
Negotiation context
- It's been on market 142 days — a 12% lower offer ($145k) is reasonable based on typical stale-listing flexibility.
- 2 sale attempts with the ask held roughly flat each time — persistent listings suggest the price (not the market) is what's stuck; bring a comps-based counter.
Risks & watch-outs
- Watch-outs: built in 1950 — expect roof / HVAC / electrical / plumbing capex.
Questions for the listing agent
- It's been on market 142 days. Have you received any prior offers? Is the seller open to a 12% concession, seller financing, or rate buy-down credit?
- Built in 1950 — when were the roof, HVAC, electrical panel, plumbing, and water heater last replaced?
- Why hasn't it sold? Are there any deal-killer items the seller is aware of (foundation, flood, title, zoning, code violations)?
- Is there a deadline driving the sale (1031 exchange, divorce, estate, relocation)? That informs how much negotiation room exists.
- Crime grade is F in this area — have there been break-ins, vandalism, or insurance claims at this property in the last 3 years? What carrier currently insures it and at what premium?
- What's the average days-on-market for RENTAL listings here right now (not sales)? A rising rental-DOM trend means longer vacancies and softer asking-rent achievability than the comps imply.
- What's the recent tenant-quality profile in this submarket — average credit score on applications, eviction rate, late-payment / NSF rate, and stable-employment percentage? A property-management company in the area should have these aggregated.
- How much new for-sale + rental construction is in the pipeline within 1–3 miles? Heavy new supply typically softens prices + rents 12–24 months out; constrained supply supports both.
Investment metrics
- 1% rule
- 1.13% ✓
- Cap rate
- 9.78%
- Cash-on-cash
- 12.45%
- DSCR
- 1.55
- GRM
- 7.4
CMA / ARV
No comps found within radius.
Projected returns pro-forma
-3.0% appreciation · 3.0% rent growth · sell at horizon
- IRR
- 2.1%
- Equity multiple
- 1.08×
- Total profit
- $3,720
- Equity at exit
- $24,602
- IRR
- 11.7%
- Equity multiple
- 1.92×
- Total profit
- $42,282
- Equity at exit
- $14,266
Cash invested: $46,200 (down + closing). Projections, not guarantees.
Landlord ↔ Tenant lean methodology
- Overall (STATE)
- 90 Strongly Landlord-Friendly
- State Louisiana
- 90 Strongly Landlord-Friendly · R+12
- County
- — inherits STATE
- City
- — inherits STATE
ZIP-level market 70068
- Home prices YoY
- -20.1%
- Active inventory
- 180
- Price-to-rent
- 7.4×
Monthly cashflow live
- Estimated rent
- $1,861 medium interval (Pro) →
- Mortgage (P&I)
- −$865
- Tax from tax record
- −$57 /mo · $687/yr
- Insurance
- −$69
- HOA
- −$0
- Vacancy / Maint / Mgmt
- −$391
- Net cashflow
- $479
Break-even live
UW: 25.0% down · 7.5% · 30yr · 1.5% tax · 5.0% vac · 8.0% maint · 8.0% mgmt
Financing live
Cash to close
- Down payment
- $41,250
- Closing costs
- $4,950
- Reserves months
- —
- Total cash needed
- —
Loan-product check · same deal, 3 products live
Conventional
25% down · 7.5% · 30yr
- Down + closing
- —
- Monthly P&I
- —
- Monthly cashflow
- —
- DSCR
- —
- Eligible?
- —
Personal DTI + credit; lowest rate.
DSCR
20% down · 8.5% · 30yr
- Down + closing
- —
- Monthly P&I
- —
- Monthly cashflow
- —
- DSCR
- —
- Eligible?
- —
No personal income docs; deal must DSCR.
Hard money
10% down · 12.0% · 12mo
- Down + closing
- —
- Monthly P&I
- —
- Monthly cashflow
- —
- DSCR
- —
- Eligible?
- —
Short-term bridge; refi at stabilization.
Listing history 11 events
-
2026-06-13statusdays on market $165,000 Pending 142 DOM
-
2026-06-10days on market $165,000 Active 140 DOM
-
2026-06-09days on market $165,000 Active 139 DOM
-
2026-06-08days on market $165,000 Active 138 DOM
-
2026-06-07days on market $165,000 Active 137 DOM
-
2026-06-02days on market $165,000 Active 132 DOM
-
2026-06-01days on market $165,000 Active 131 DOM
-
2026-05-31days on market $165,000 Active 130 DOM
-
2026-05-30days on market $165,000 Active 129 DOM
-
2026-01-08$165,000 Active 195-char remark
Show marketing remark (195 chars)
Duplex presently rented in Laplace area. Located near Airline Hwy. Each unit paying $1,250 at this time. Shared washer/dryer in rear or building. Freshly painted. Newer metal roof. Newer windows.
-
2026-01-08$165,000 Active 195-char remark
Show marketing remark (195 chars)
Duplex presently rented in Laplace area. Located near Airline Hwy. Each unit paying $1,250 at this time. Shared washer/dryer in rear or building. Freshly painted. Newer metal roof. Newer windows.
ⓘ Source: listings_history table (triggers on properties + properties_extension) + one-shot
backfill from property_details.listing_events for pre-trigger history.
Tax reassessment forecast LA · Resets to sale price
- Current annual tax
- $687 · $57/mo
- Projected year-2 tax
- $908 · $76/mo
- Expected delta
- +$220/yr (+$18/mo · 32.0%)
ⓘ Screening estimate from a state-policy table — verify with the county assessor before closing.
Nearby sold comps map
Loading sold comps map…
Walkable amenities ~0.75 mi
Loading nearby amenities…
Taxation est. · year 1
- Rental income
- $22,337
- − Mortgage interest
- −$9,243
- − Property taxes
- −$687
- − Insurance
- −$825
- − Repairs & maintenance
- −$1,787
- − Management
- −$1,787
- − Depreciation
- −$4,800
- Taxable income
- $3,208
- Est. tax owed @ 24.0%
- −$770
- After-tax cash flow
- $4,981/yr
For passive investors: Depreciation is non-cash, so a rental often shows a tax loss while cash-flowing — sheltering income. Rental losses are passive: they offset passive income freely, and up to $25,000/yr can offset ordinary (W-2) income if you actively participate and your MAGI is under $100k (phasing out to $0 by $150k); unused losses carry forward. On sale, claimed depreciation is recaptured at up to 25%, and gains may owe capital-gains tax (a 1031 exchange can defer both). Figures are a year-1 estimate at your 24.0% rate — not tax advice; consult a CPA.
Schools (NCES district)
- District
- St. John The Baptist Parish
- NCES district ID
- 2201530
- Math proficiency
- 13% ▼ -42.00%
- Reading proficiency
- 25% ▼ -39.00%
- Median HH income
- $50,280
- Composite
- 17.07/100
- National rank
- #9120
- State rank
- #68 of 98 in LA
Livability — Laplace
- Score
- 70/100
- State rank
- #61
- US rank
- #7898
Category grades
Schools grade is shown separately in the Schools card above.
Census & demographics
- Census place
- Laplace, LA
- County
- Saint John the Baptist Parish · 32,720 people
- Metro
- New Orleans-Metairie, LA
- Population (ZIP)
- 32,720
- Household income
- $68,459
- Rent vs Own
- Severe rent burden
- 750.0
Population outlook (St. John the Baptist County) Hauer SSP2
- Today (2025)
- 40,972 people
- By 2030
- 39,295 · -4.1%
- By 2040
- 35,902 · -12.4%
- By 2050
- 32,988 · -19.5%
- By 2075
- 28,661 · -30.0%
- By 2100
- 26,456 · -35.4%
Race, ethnicity, and origin ACS 2023
- Neighborhood character
- Diverse neighborhood (Simpson 0.62)
- Race & ethnicity
- Black 51% White 34% Hispanic / Latino 9% Two or more races 5% Asian 1%
- Hispanic origin (detail)
- Puerto Rican 1%
- Common ancestry
- Lithuanian 11%
- Foreign-born
- 5% · Canada
- Languages at home
- 91% English-only · Spanish 6% Tagalog/Filipino 1%
Political lean MEDSL · St. John the Baptist
- 2024 margin
- Strong D (+29.1) · D 64.0% · R 34.8% · Other 1.2%
- 2008→2024 swing
- +12.9pp toward D · 2008: 16.2pp · 2024: 29.1pp
- All cycles
- 2024: D+29.1 2020: D+28.2 2016: D+24.5 2012: D+26.3 2008: D+16.2
Not yet ingested
- Civics
- —
Market trends
- HPI YoY
- ▼ -60.04%
- Current HPI
- 239.1429
- Rent YoY
- —
- Metro
- New Orleans-Metairie, LA
- State GDP YoY
- ▲ 3.29%
- F500 in state
- 10
Industry mix (Fortune 500 HQ in LA)
| Industry | F500 HQs | Revenue |
|---|---|---|
| Telecommunications | 2 | $23B |
|
||
| Utilities | 1 | $12B |
|
||
| Wholesale / Distribution | 1 | $5B |
|
||
| Advertising | 1 | $2B |
|
||
Price history
+0.0% since first listed2 events — show timeline
- 2026-01-08 Listed $165,000 GSREIN
- 2026-01-08 Listed $165,000 AcadianaMLS
Property tax history
+9.0%/yrLatest (2025): $687 · +0.1% YoY. Source: county tax records.
Cash-flow waterfall
monthlySold comps — $/sqft
last 12 mo · ≤1 miLoading sold comps…