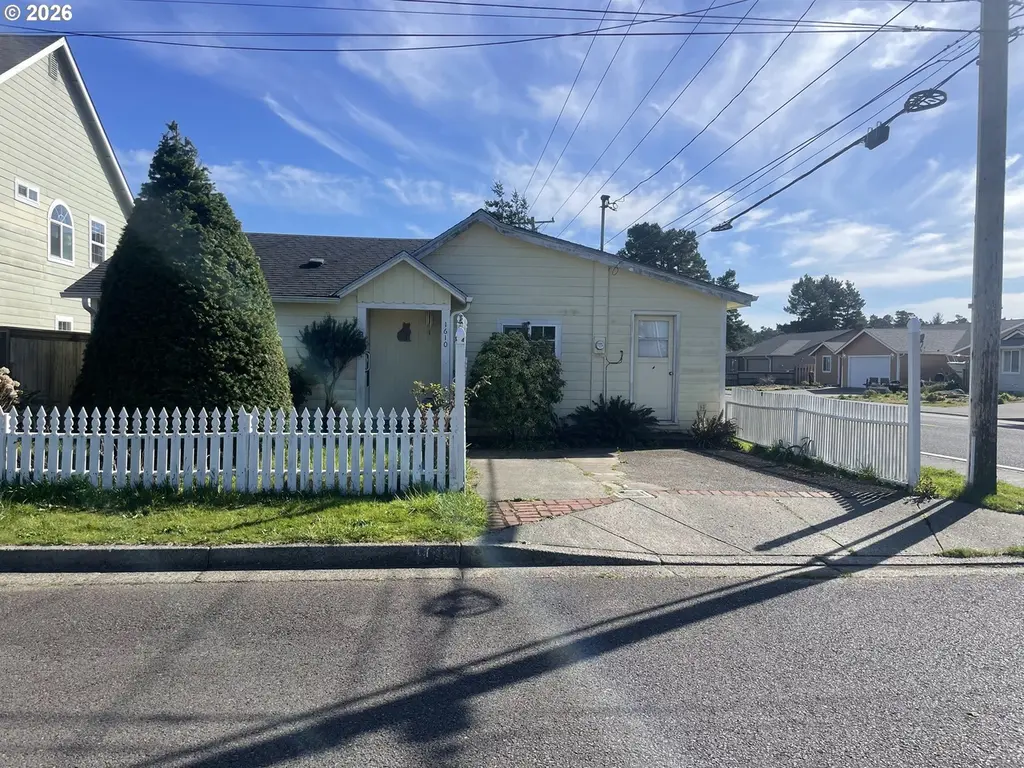
1610 36th St · Florence, OR
Flood risk 1/10 · Minimal
- FEMA flood zone
- X (unshaded)
- Chance of flooding over 30 yrs
- 0.0%
- Est. flood insurance / yr
- $507 – $1,088
Fire risk 3/10 · Minor
- Est. fire insurance / yr
- $498 – $926
Heat risk 1/10 · Minimal
- Hot days now (above 75°F)
- 8 days/yr
- Hot days in 30 yrs
- 21 days/yr
Wind risk 1/10 · Minimal
- Chance of severe wind over 30 yrs
- —
Air-quality risk 6/10 · Moderate
- Unhealthy air days now
- 7 days/yr
- Unhealthy air days in 30 yrs
- 7 days/yr
Risk factors via First Street. Map © Google.
Why this score? — see what drove the C grade
The composite is a weighted blend of 9 inputs, each scored 0–100. Each bar is that input's sub-score; the figure is the points it added to the 100-point composite (weight × sub-score).
- ARV discount +15.0/15.0
- Cash flow +14.9/30.0
- Appreciation +10.0/10.0
- DSCR +4.6/10.0
- Schools +3.7/10.0
- Livability +3.5/5.0
- 1% rule +3.2/10.0
- Rent growth +2.5/5.0
- Condition / age +2.5/5.0
$215,000
🖨 Deal sheet 📄 Offer letter ✓ Due diligence
Listing remarks
INVESTOR ALERT!!! Fantastic location on a corner lot in Florence! This 3-bedroom, 1-bath home is a prime investment opportunity with endless potential. Being sold as-is. Bring your vision and make it your own. Don't miss this chance to invest in a great location at an affordable price!
Key facts
- Great location
- Corner lot
- 2,613 sq ft lot
Tags
Property features AI
Finance
- Other: Main level area approximately 995 (listed building area); Lot about 0.06 acres (approx. 2,613 sq ft)
Exterior
- Parking: Driveway; On-street parking
- Utilities: Public water; Public sewer; Electric service
- Home design: Single family residence; Residential property; Not attached to other units; Fixer condition; No view
- Construction: Built in 1947; Composition roof; Concrete perimeter foundation
- Exterior features: Wood composite exterior; Corner lot; Concrete road surface
Interior
- Kitchen: Kitchen (main level)
- Bedrooms: Primary bedroom (main level); Second bedroom (main level); Third bedroom (main level)
- Bathrooms: 1 full bathroom (main level)
- Heating & cooling: Baseboard heating; No cooling specified; Electric hot water
- Interior features: Vinyl window frames; Crawl space basement; Dining room; Family room; Great room; Living room
Neighborhood map
What this means for you Summary
Snapshot
- This is a 3-bed/1.0-bath single-family listed at $215k.
Deal economics
- At list price, monthly cash flow is $64 ($771/yr) — positive.
- The deal already cash-flows at list — no discount required.
- To meet the 1% rule (rent ≥ 1% of price), the offer needs to be $176k (18.1% below list).
- Recommended offer: $176k (18.1% below list) — sets the bar for 1% rule.
- Cap rate 6.7% vs local median 2.6% in Florence — top-decile yield for the area; either an underpriced asset or a hidden risk that comps aren't pricing in. Stress-test before assuming the spread holds.
Location & tenants
- Location reads 70/100 on livability (#142 in OR) — a middle-class / working-renter tenant base. Strengths: health & safety A+, housing A, crime A-; Watch: employment C-, amenities F, commute F.
- Siuslaw SD 97J (town): math 33% / reading 50% proficiency, ranked #106 of 183 in OR (top 58%) — families likely to look elsewhere, expect single-tenant / working-renter base with shorter leases.
- Zoned schools: Siuslaw Elementary School (math 22% / reading 37%, grade F, #263 of 412 statewide, top 68%, 520 students, 68% FRL); Siuslaw Middle School (math 15% / reading 37%, grade F, #101 of 128 statewide, top 80%, 270 students, 68% FRL); Siuslaw High School (math 24% / reading 75%, grade D+, #32 of 143 statewide, top 34%, 459 students, 68% FRL).
- Market conditions: 406 active listings in the ZIP; 1,808 units permitted in Lane County in 2024 (972 in 5+ unit buildings).
Forward outlook
- In year one you build about $23k of equity ($1k loan paydown + $22k appreciation (10.0% local appreciation)).
- Lane County population projected at +15% by 2050 — long-run rental-demand tailwind backs the buy-and-hold thesis.
- At projected returns (10.0% appreciation + 3.0% rent growth), your $60k cash investment doubles in ~3 years — after that, you're playing with house money.
- By year 2, paydown + projected appreciation supports a ~$37k cash-out refi (75% LTV) — recoverable capital for the next deal without selling this one.
Negotiation context
- Only 12 days on market — expect competitive offers; lowballing is unlikely to land.
- 2 sale attempts since 23y ago with the ask held roughly flat each time — persistent listings suggest the price (not the market) is what's stuck; bring a comps-based counter.
- Current owner paid $85k; list at $215k implies a 153% gain — meaningful room to come down on a strong offer.
Risks & watch-outs
- Watch-outs: built in 1947 — expect roof / HVAC / electrical / plumbing capex.
Questions for the listing agent
- Built in 1947 — when were the roof, HVAC, electrical panel, plumbing, and water heater last replaced?
- Is there a deadline driving the sale (1031 exchange, divorce, estate, relocation)? That informs how much negotiation room exists.
- What's the average days-on-market for RENTAL listings here right now (not sales)? A rising rental-DOM trend means longer vacancies and softer asking-rent achievability than the comps imply.
- What's the recent tenant-quality profile in this submarket — average credit score on applications, eviction rate, late-payment / NSF rate, and stable-employment percentage? A property-management company in the area should have these aggregated.
- How much new for-sale + rental construction is in the pipeline within 1–3 miles? Heavy new supply typically softens prices + rents 12–24 months out; constrained supply supports both.
Investment metrics
- 1% rule
- 0.82% ✗
- Cap rate
- 6.65%
- Cash-on-cash
- 1.28%
- DSCR
- 1.06
- GRM
- 10.2
CMA / ARV
- ARV (on-the-fly)
- $293,525
- Comps found
- 12
Show comp detail 12 sales within ~0.75 mi
| Address | Dist | Beds/Ba | Sqft | Sold | Price | $/sf | Match |
|---|---|---|---|---|---|---|---|
| 1660 34th St | 0.12mi | 3/1.0 | 1,010 (+2%) | 8mo | $345,000 | $342 | 85 |
| 1640 34th St | 0.12mi | 3/1.0 | 1,008 (+1%) | 14mo | $297,000 | $295 | 80 |
| 1667 30th St | 0.33mi | 2/1.0 (-1) | 976 (-2%) | 5mo | $250,000 | $256 | 72 |
| 32 Easy St | 0.54mi | 2/1.0 (-1) | 1,028 (+3%) | 1mo | $275,000 | $268 | 64 |
| 1651 29th St | 0.39mi | 2/1.0 (-1) | 1,076 (+8%) | 1mo | $380,000 | $353 | 62 |
| 1684 29th St | 0.42mi | 3/1.0 | 1,012 (+2%) | 20mo | $322,000 | $318 | 61 |
| 1611 25th St | 0.62mi | 3/2.0 | 1,056 (+6%) | 1mo | $205,000 | $194 | 56 |
| 1685 28th St | 0.45mi | 3/1.0 | 1,076 (+8%) | 12mo | $317,000 | $295 | 56 |
| 1629 N Siano Loop | 0.60mi | 2/1.0 (-1) | 924 (-7%) | 9mo | $270,000 | $292 | 48 |
| 1945 32nd St | 0.30mi | 2/2.0 (-1) | 1,100 (+11%) | 14mo | $355,000 | $323 | 48 |
| 29 Easy St | 0.54mi | 2/1.0 (-1) | 1,136 (+14%) | 4mo | $285,000 | $251 | 43 |
| 206 Bourbon St | 0.67mi | 2/2.0 (-1) | 1,045 (+5%) | 19mo | $210,000 | $201 | 36 |
Match score weights: distance 35% · size 25% · config 20% · recency 20%. Top-matched comps best support the ARV.
Projected returns pro-forma
10.0% appreciation · 3.0% rent growth · sell at horizon
- IRR
- 25.2%
- Equity multiple
- 3.01×
- Total profit
- $121,116
- Equity at exit
- $193,689
- IRR
- 22.2%
- Equity multiple
- 6.87×
- Total profit
- $353,309
- Equity at exit
- $417,698
Cash invested: $60,200 (down + closing). Projections, not guarantees.
Landlord ↔ Tenant lean methodology
- Overall (STATE)
- 28 Tenant-Leaning
- State Oregon
- 28 Tenant-Leaning · D+6
- County
- — inherits STATE
- City
- — inherits STATE
ZIP-level market 97439
- Home prices YoY
- 2.5%
- Active inventory
- 406
- Price-to-rent
- 10.2×
Monthly cashflow live
- Estimated rent
- $1,762 medium interval (Pro) →
- Mortgage (P&I)
- −$1,127
- Tax from tax record
- −$111 /mo · $1,327/yr
- Insurance
- −$90
- HOA
- −$0
- Vacancy / Maint / Mgmt
- −$370
- Net cashflow
- $64
Break-even live
UW: 25.0% down · 7.5% · 30yr · 1.5% tax · 5.0% vac · 8.0% maint · 8.0% mgmt
Financing live
Cash to close
- Down payment
- $53,750
- Closing costs
- $6,450
- Reserves months
- —
- Total cash needed
- —
Loan-product check · same deal, 3 products live
Conventional
25% down · 7.5% · 30yr
- Down + closing
- —
- Monthly P&I
- —
- Monthly cashflow
- —
- DSCR
- —
- Eligible?
- —
Personal DTI + credit; lowest rate.
DSCR
20% down · 8.5% · 30yr
- Down + closing
- —
- Monthly P&I
- —
- Monthly cashflow
- —
- DSCR
- —
- Eligible?
- —
No personal income docs; deal must DSCR.
Hard money
10% down · 12.0% · 12mo
- Down + closing
- —
- Monthly P&I
- —
- Monthly cashflow
- —
- DSCR
- —
- Eligible?
- —
Short-term bridge; refi at stabilization.
Listing history 10 events
-
2026-06-16status $215,000 Pending 12 DOM
-
2026-06-15days on market $215,000 Active 12 DOM
-
2026-06-13days on market $215,000 Active 10 DOM
-
2026-06-12days on market $215,000 Active 9 DOM
-
2026-06-09days on market $215,000 Active 6 DOM
-
2026-06-08days on market $215,000 Active 5 DOM
-
2026-06-08days on market $215,000 Active 4 DOM
-
2026-06-07days on market $215,000 Active 3 DOM
-
2026-06-04remarks 286-char remark
-
2026-06-04$215,000 Active 1 DOM
ⓘ Source: listings_history table (triggers on properties + properties_extension) + one-shot
backfill from property_details.listing_events for pre-trigger history.
Tax reassessment forecast OR · Resets to sale price
- Current annual tax
- $1,327 · $111/mo
- Projected year-2 tax
- $2,086 · $174/mo
- Expected delta
- +$759/yr (+$63/mo · 57.2%)
ⓘ Screening estimate from a state-policy table — verify with the county assessor before closing.
Climate risk First Street
- Flood 1/10 Low FEMA zone X (unshaded) · 0% chance over 30 yrs
- Wildfire 3/10 Moderate
- Heat 1/10 Low 8 d/yr ≥75°F today · 21 d/yr by 30 yrs out
- Wind 1/10 Low
- Air quality 6/10 Major 7 unhealthy d/yr today · 7 by 30 yrs out
Nearby sold comps map
Loading sold comps map…
Walkable amenities ~0.75 mi
Loading nearby amenities…
Taxation est. · year 1
- Rental income
- $21,142
- − Mortgage interest
- −$12,043
- − Property taxes
- −$1,327
- − Insurance
- −$1,075
- − Repairs & maintenance
- −$1,691
- − Management
- −$1,691
- − Depreciation
- −$6,255
- Taxable loss
- −$2,940
- Est. tax savings @ 24.0%
- +$706
- After-tax cash flow
- $1,477/yr
For passive investors: Depreciation is non-cash, so a rental often shows a tax loss while cash-flowing — sheltering income. Rental losses are passive: they offset passive income freely, and up to $25,000/yr can offset ordinary (W-2) income if you actively participate and your MAGI is under $100k (phasing out to $0 by $150k); unused losses carry forward. On sale, claimed depreciation is recaptured at up to 25%, and gains may owe capital-gains tax (a 1031 exchange can defer both). Figures are a year-1 estimate at your 24.0% rate — not tax advice; consult a CPA.
Schools (NCES district)
- District
- Siuslaw SD 97J
- NCES district ID
- 4105100
- Math proficiency
- 33% ▼ -3.00%
- Reading proficiency
- 50% ▼ -2.00%
- Median HH income
- $36,892
- Composite
- 36.82/100
- National rank
- #9169
- State rank
- #106 of 183 in OR
Livability — Florence
- Score
- 70/100
- State rank
- #142
- US rank
- #8094
Category grades
Schools grade is shown separately in the Schools card above.
Census & demographics
- Census place
- Florence, OR
- Population (ZIP)
- 15,643
Population outlook (Lane County) Hauer SSP2
- Today (2025)
- 391,933 people
- By 2030
- 405,860 · +3.6%
- By 2040
- 429,386 · +9.6%
- By 2050
- 452,016 · +15.3%
- By 2075
- 508,825 · +29.8%
- By 2100
- 531,208 · +35.5%
Race, ethnicity, and origin ACS 2023
- Neighborhood character
- Predominantly White (88%)
- Race & ethnicity
- White 88% Hispanic / Latino 5% Two or more races 5% Asian 2% Black 1%
- Hispanic origin (detail)
- Mexican 4%
- Common ancestry
- Lithuanian 4% Portuguese 3% Slovak 3%
- Foreign-born
- 5% · Canada, China
- Languages at home
- 96% English-only · Spanish 1% German/W. Germanic 1% Other Asian/Pacific 1%
Political lean MEDSL · Lane
- 2024 margin
- Strong D (+23.1) · D 60.0% · R 36.9% · Other 3.1%
- 2008→2024 swing
- -4.3pp toward R · 2008: 27.4pp · 2024: 23.1pp
- All cycles
- 2024: D+23.1 2020: D+24.3 2016: D+18.9 2012: D+23.4 2008: D+27.4
Not yet ingested
- Civics
- —
Market trends
- HPI YoY
- ▲ 17.79%
- Current HPI
- 717.84
- Rent YoY
- —
- Metro
- —
- State GDP YoY
- ▲ 2.05%
- F500 in state
- 2
Industry mix (Fortune 500 HQ in OR)
| Industry | F500 HQs | Revenue |
|---|---|---|
| Consumer Goods | 1 | $51B |
|
||
Price history
+604.9% since first listed6 events — show timeline
- 2026-06-03 Listed $215,000 RMLS
- 2003-12-12 Sold (Public Records) $85,000 Public Records
- 2003-12-12 Sold (MLS) $85,000 RMLS
- 2003-09-19 Listed $87,500 RMLS
- 2002-05-07 Sold (Public Records) $59,900 Public Records
- 1991-04-24 Sold (Public Records) $30,500 Public Records
Property tax history
+3.4%/yrLatest (2025): $1,327 · +3.0% YoY. Source: county tax records.
Cash-flow waterfall
monthlySold comps — $/sqft
last 12 mo · ≤1 miLoading sold comps…