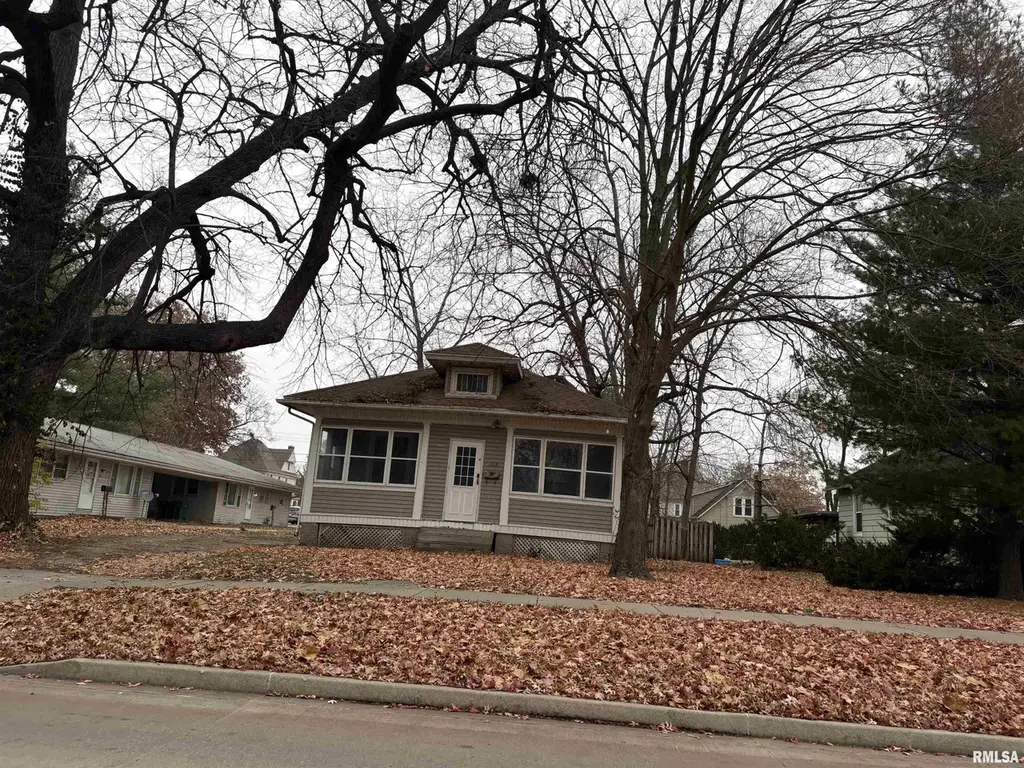
209 N Ward St · Macomb, IL
Flood risk 1/10 · Minimal
- FEMA flood zone
- —
- Chance of flooding over 30 yrs
- 0.0%
- Est. flood insurance / yr
- —
Fire risk 1/10 · Minimal
- Est. fire insurance / yr
- $804 – $1,492
Heat risk 3/10 · Minor
- Hot days now (above 107°F)
- 7 days/yr
- Hot days in 30 yrs
- 17 days/yr
Wind risk 2/10 · Minimal
- Chance of severe wind over 30 yrs
- —
Air-quality risk 2/10 · Minimal
- Unhealthy air days now
- 1 days/yr
- Unhealthy air days in 30 yrs
- 1 days/yr
Risk factors via First Street. Map © Google.
Why this score? — see what drove the C grade
The composite is a weighted blend of 9 inputs, each scored 0–100. Each bar is that input's sub-score; the figure is the points it added to the 100-point composite (weight × sub-score).
- Cash flow +20.3/30.0
- ARV discount +14.5/15.0
- DSCR +6.4/10.0
- 1% rule +6.1/10.0
- Livability +3.5/5.0
- Rent growth +2.5/5.0
- Condition / age +2.5/5.0
- Schools +1.8/10.0
- Appreciation +0.0/10.0
$65,000
🖨 Deal sheet 📄 Offer letter ✓ Due diligence
Listing remarks MLS
Very nice two bedroom bungalow conveniently located just 2 blocks from WIU. The outside of this home has vinyl siding, newer roof, some newer windows, nice fenced in back yard, 1 1/2 car garage, newer back steps with sliding glass door opening to kitchen. Inside enjoy the newer kitchen, bath, kitchen flooring and neutral colored paint. The main living areas have original hardwood floors, natural woodwork, beautiful built in hutch/China cupboard. There is also a large pantry/storage room just off the kitchen. The enclosed front porch is an inviting room to relax and watch the rest of the world go by. Only one block walk to the iconic Dairy Queen.
Key facts
- Newer roof
- Sliding glass door
- Vinyl siding
Tags
Neighborhood map
What this means for you Summary
Snapshot
- This is a 2-bed/1.0-bath single-family listed at $65k.
Deal economics
- At list price, monthly cash flow is $83 ($993/yr) — positive.
- The deal already cash-flows at list — no discount required.
- Meets the 1% rule at list price ($721 rent vs $65k).
- Recommended offer: $57k (12.0% below list) — sets the bar for market timing.
- Cap rate 7.8% vs local median 6.2% in Macomb — meaningfully above typical; check what's discounted (condition, days-on-market, listing class) to confirm the premium yield is real.
Location & tenants
- Location reads 70/100 on livability (#379 in IL) — a middle-class / working-renter tenant base. Strengths: cost of living A+, health & safety A+, housing B; Watch: schools D, crime D, amenities D.
- Macomb CUSD 185 (town): math 19% / reading 26% proficiency, ranked #410 of 620 in IL (top 66%) — low school quality limits family demand, transient renter base, plan for 1-2y turnover.
- Market conditions: 135 active listings in the ZIP; 4 comparable units currently listed for rent nearby; rentals lingering (median 44d on market — plan ~5-8 weeks vacancy on turnover, expect pricing pressure); 100% of comp listings sitting > 30 days — soft ceiling on asking rent.
- This rent is only 18% of the median local income ($49k/yr) — well below the 30% rent-burden line; pricing power to push rent on renewal without tenant pushback.
Forward outlook
- Local home prices are declining (-3.0%/yr); year-one equity from $449 of loan paydown is wiped out by about $2k of value loss. Plan a longer hold.
Negotiation context
- It's been on market 190 days — a 12% lower offer ($57k) is reasonable based on typical stale-listing flexibility.
- 4 sale attempts since 6y ago with the ask held roughly flat each time — persistent listings suggest the price (not the market) is what's stuck; bring a comps-based counter.
- Current owner paid $40k; list at $65k implies a 62% gain — meaningful room to come down on a strong offer.
Risks & watch-outs
- Watch-outs: built in 1937 — expect roof / HVAC / electrical / plumbing capex.
Questions for the listing agent
- It's been on market 190 days. Have you received any prior offers? Is the seller open to a 12% concession, seller financing, or rate buy-down credit?
- Built in 1937 — when were the roof, HVAC, electrical panel, plumbing, and water heater last replaced?
- Why hasn't it sold? Are there any deal-killer items the seller is aware of (foundation, flood, title, zoning, code violations)?
- Is there a deadline driving the sale (1031 exchange, divorce, estate, relocation)? That informs how much negotiation room exists.
- Schools are D-rated, which usually means shorter tenancies and higher turnover. Who's the typical renter profile here, and what's been the actual vacancy rate?
- Crime grade is D in this area — have there been break-ins, vandalism, or insurance claims at this property in the last 3 years? What carrier currently insures it and at what premium?
- What's the average days-on-market for RENTAL listings here right now (not sales)? A rising rental-DOM trend means longer vacancies and softer asking-rent achievability than the comps imply.
- What's the recent tenant-quality profile in this submarket — average credit score on applications, eviction rate, late-payment / NSF rate, and stable-employment percentage? A property-management company in the area should have these aggregated.
- How much new for-sale + rental construction is in the pipeline within 1–3 miles? Heavy new supply typically softens prices + rents 12–24 months out; constrained supply supports both.
Investment metrics
- 1% rule
- 1.11% ✓
- Cap rate
- 7.82%
- Cash-on-cash
- 5.46%
- DSCR
- 1.24
- GRM
- 7.5
CMA / ARV
- ARV (median comp)
- $76,920
- List price
- $65,000
- Delta
- -15.50%
- Verdict
- UNDERPRICED
- Comps
- 20 within 1.0 mi
Show comp detail 12 sales within ~0.75 mi
| Address | Dist | Beds/Ba | Sqft | Sold | Price | $/sf | Match |
|---|---|---|---|---|---|---|---|
| 1110 W Piper St | 0.35mi | 1/— (-1) | 1,002 (+1%) | 2mo | $17,500 | $17 | 76 |
| 721 W Carroll St | 0.16mi | 2/1.0 | 1,065 (+7%) | 13mo | $82,850 | $78 | 71 |
| 408 S Johnson St | 0.64mi | 2/1.0 | 1,001 (+0%) | 1mo | $70,000 | $70 | 69 |
| 416 W Wheeler St | 0.46mi | 2/1.0 | 1,008 (+1%) | 10mo | $62,000 | $62 | 69 |
| 411 W Jefferson St | 0.48mi | 2/1.0 | 972 (-2%) | 7mo | $60,000 | $62 | 68 |
| 117 W Jefferson St | 0.71mi | 2/1.5 | 968 (-3%) | 11mo | $31,000 | $32 | 51 |
| 715 W Chandler St | 0.19mi | 3/2.5 (+1) | 1,142 (+15%) | 8mo | $87,000 | $76 | 49 |
| 420 W Jefferson St | 0.45mi | 2/2.0 | 1,138 (+14%) | 3mo | $85,000 | $75 | 48 |
| 522 W Chase St | 0.59mi | 2/1.0 | 879 (-12%) | 12mo | $30,750 | $35 | 43 |
| 716 N Albert St | 0.61mi | 3/1.0 (+1) | 864 (-13%) | 4mo | $37,000 | $43 | 41 |
| 434 W Murray St | 0.55mi | 3/1.0 (+1) | 1,129 (+13%) | 11mo | $70,000 | $62 | 38 |
| 115 W Washington St | 0.68mi | 3/3.0 (+1) | 1,141 (+15%) | 10mo | $60,000 | $53 | 23 |
Match score weights: distance 35% · size 25% · config 20% · recency 20%. Top-matched comps best support the ARV.
Projected returns pro-forma
-3.0% appreciation · 3.0% rent growth · sell at horizon
- IRR
- -7.8%
- Equity multiple
- 0.71×
- Total profit
- $-5,229
- Equity at exit
- $9,692
- IRR
- 1.8%
- Equity multiple
- 1.13×
- Total profit
- $2,370
- Equity at exit
- $5,620
Cash invested: $18,200 (down + closing). Projections, not guarantees.
Landlord ↔ Tenant lean methodology
- Overall (STATE)
- 43 Moderately Tenant-Leaning
- State Illinois
- 43 Moderately Tenant-Leaning · D+7
- County
- — inherits STATE
- City
- — inherits STATE
ZIP-level market 61455
- Home prices YoY
- -33.3%
- Active inventory
- 135
- Price-to-rent
- 7.5×
Monthly cashflow live
- Estimated rent
- $721 medium interval (Pro) →
- Mortgage (P&I)
- −$341
- Tax from tax record
- −$119 /mo · $1,425/yr
- Insurance
- −$27
- HOA
- −$0
- Vacancy / Maint / Mgmt
- −$151
- Net cashflow
- $83
Break-even live
UW: 25.0% down · 7.5% · 30yr · 1.5% tax · 5.0% vac · 8.0% maint · 8.0% mgmt
Financing live
Cash to close
- Down payment
- $16,250
- Closing costs
- $1,950
- Reserves months
- —
- Total cash needed
- —
Loan-product check · same deal, 3 products live
Conventional
25% down · 7.5% · 30yr
- Down + closing
- —
- Monthly P&I
- —
- Monthly cashflow
- —
- DSCR
- —
- Eligible?
- —
Personal DTI + credit; lowest rate.
DSCR
20% down · 8.5% · 30yr
- Down + closing
- —
- Monthly P&I
- —
- Monthly cashflow
- —
- DSCR
- —
- Eligible?
- —
No personal income docs; deal must DSCR.
Hard money
10% down · 12.0% · 12mo
- Down + closing
- —
- Monthly P&I
- —
- Monthly cashflow
- —
- DSCR
- —
- Eligible?
- —
Short-term bridge; refi at stabilization.
Rent comps 4 comps
| Address | Beds | Baths | Sqft | Rent | $/sqft | DOM | Units | Dist |
|---|---|---|---|---|---|---|---|---|
| 217 Charleston Blvd Unit 1 Macomb, IL | 1.0 | 1.0 | 535 | $610 | $1.14 | 43d | 1 | 0.41mi |
| 218 Charleston Blvd Unit 5 Macomb, IL | 1.0 | 1.0 | 535 | $610 | $1.14 | 43d | 1 | 0.41mi |
| 902 N Charles St Macomb, IL | 2.0 | 1.5 | 840 | $695 | $0.83 | 43d | 1 | 0.69mi |
| 303 S Dudley St Macomb, IL | 1.0 | 1.0 | 625 | $575 | $0.92 | 43d | 1 | 0.98mi |
Listing history 16 events
-
2026-06-19days on market $65,000 Active 190 DOM
-
2026-06-18days on market $65,000 Active 189 DOM
-
2026-06-17status $65,000 Active 188 DOM
-
2026-06-03status $65,000 Pending 188 DOM
-
2026-06-02days on market $65,000 Active 188 DOM
-
2026-06-01days on market $65,000 Active 187 DOM
-
2026-05-31days on market $65,000 Active 186 DOM
-
2026-05-31days on market $65,000 Active 185 DOM
-
2025-11-23$65,000 Active 664-char remark
Show marketing remark (664 chars)
Very nice two bedroom bungalow conveniently located just 2 blocks from WIU. The outside of this home has vinyl siding, newer roof, some newer windows, nice fenced in back yard, 1 1/2 car garage, newer back steps with sliding glass door opening to kitchen. Inside enjoy the newer kitchen, bath, kitchen flooring and neutral colored paint. The main living areas have original hardwood floors, natural woodwork, beautiful built in hutch/China cupboard. There is also a large pantry/storage room just off the kitchen. The enclosed front porch is an inviting room to relax and watch the rest of the world go by. Only one block walk to the iconic Dairy Queen.
-
2024-11-13price
-
2024-09-30status Active
-
2024-09-30historical
-
2024-09-05status Pending
-
2024-07-02Active
-
2021-07-16soldstatus $40,000
-
2020-03-09$45,000
ⓘ Source: listings_history table (triggers on properties + properties_extension) + one-shot
backfill from property_details.listing_events for pre-trigger history.
Tax reassessment forecast IL · Partial reset (capped growth)
- Current annual tax
- $1,425 · $119/mo
- Projected year-2 tax
- $1,450 · $121/mo
- Expected delta
- +$25/yr (+$2/mo · 1.8%)
ⓘ Screening estimate from a state-policy table — verify with the county assessor before closing.
Climate risk First Street
- Flood 1/10 Low 0% chance over 30 yrs
- Wildfire 1/10 Low
- Heat 3/10 Moderate 7 d/yr ≥107°F today · 17 d/yr by 30 yrs out
- Wind 2/10 Low
- Air quality 2/10 Low 1 unhealthy d/yr today · 1 by 30 yrs out
Nearby sold comps map
Loading sold comps map…
Walkable amenities ~0.75 mi
Loading nearby amenities…
Taxation est. · year 1
- Rental income
- $8,649
- − Mortgage interest
- −$3,641
- − Property taxes
- −$1,425
- − Insurance
- −$325
- − Repairs & maintenance
- −$692
- − Management
- −$692
- − Depreciation
- −$1,891
- Taxable loss
- −$16
- Est. tax savings @ 24.0%
- +$4
- After-tax cash flow
- $997/yr
For passive investors: Depreciation is non-cash, so a rental often shows a tax loss while cash-flowing — sheltering income. Rental losses are passive: they offset passive income freely, and up to $25,000/yr can offset ordinary (W-2) income if you actively participate and your MAGI is under $100k (phasing out to $0 by $150k); unused losses carry forward. On sale, claimed depreciation is recaptured at up to 25%, and gains may owe capital-gains tax (a 1031 exchange can defer both). Figures are a year-1 estimate at your 24.0% rate — not tax advice; consult a CPA.
Schools (NCES district)
- District
- Macomb CUSD 185
- NCES district ID
- 1723920
- Math proficiency
- 19% ▼ -7.00%
- Reading proficiency
- 26% ▼ -8.00%
- Median HH income
- $34,162
- Composite
- 18.45/100
- National rank
- #8927
- State rank
- #410 of 620 in IL
Livability — Macomb
- Score
- 70/100
- State rank
- #379
- US rank
- #7918
Category grades
Schools grade is shown separately in the Schools card above.
Census & demographics
- Census place
- Macomb, IL
- County
- McDonough County · 17,317 people
- City population
- 17,317
- Metro
- Macomb, IL
- Population (ZIP)
- 17,317
- Household income
- $48,679
- Rent vs Own
- Severe rent burden
- 1062.0
Population outlook (McDonough County) Hauer SSP2
- Today (2025)
- 33,242 people
- By 2030
- 33,318 · +0.2%
- By 2040
- 33,520 · +0.8%
- By 2050
- 33,630 · +1.2%
- By 2075
- 33,657 · +1.2%
- By 2100
- 33,127 · -0.3%
Race, ethnicity, and origin ACS 2023
- Neighborhood character
- Predominantly White (81%)
- Race & ethnicity
- White 81% Black 9% Two or more races 5% Hispanic / Latino 5% Asian 3%
- Common ancestry
- Romanian 3% Italian 3% Iranian 2%
- Foreign-born
- 4% · Canada, South Korea, China
- Languages at home
- 94% English-only · Spanish 2% Other Indo-European 1% Russian/Polish/Slavic 1%
Political lean MEDSL · McDonough
- 2024 margin
- R (+18.9) · D 39.7% · R 58.5% · Other 1.8%
- 2008→2024 swing
- -24.4pp toward R · 2008: 5.6pp · 2024: -18.9pp
- All cycles
- 2024: R+18.9 2020: R+16.6 2016: R+11.7 2012: R+1.5 2008: D+5.6
Not yet ingested
- Civics
- —
Market trends
- HPI YoY
- ▼ -70.20%
- Current HPI
- 140.4351
- Rent YoY
- —
- Metro
- Macomb, IL
- State GDP YoY
- ▲ 1.59%
- F500 in state
- 60
Industry mix (Fortune 500 HQ in IL)
| Industry | F500 HQs | Revenue |
|---|---|---|
| Insurance | 4 | $201B |
|
||
| Consumer Goods | 4 | $87B |
|
||
| Industrial Machinery | 3 | $64B |
|
||
| Healthcare | 2 | $55B |
|
||
| Retail / Pharmacy | 1 | $148B |
|
||
| Agriculture / Food | 1 | $86B |
|
||
Price history
+44.4% since first listed8 events — show timeline
- 2025-11-23 Listed $65,000 RMLSA as Distributed by MLS Grid
- 2024-11-13 Price Changed — RMLSA as Distributed by MLS Grid
- 2024-09-30 Relisted — RMLSA as Distributed by MLS Grid
- 2024-09-30 Listing Removed — RMLSA as Distributed by MLS Grid
- 2024-09-05 Pending — RMLSA as Distributed by MLS Grid
- 2024-07-02 Listed — RMLSA as Distributed by MLS Grid
- 2021-07-16 Sold (MLS) $40,000 RMLSA as Distributed by MLS Grid
- 2020-03-09 Listed $45,000 RMLSA as Distributed by MLS Grid
Property tax history
+2.9%/yrLatest (2024): $1,425 · -0.4% YoY. Source: county tax records.
Cash-flow waterfall
monthlySold comps — $/sqft
last 12 mo · ≤1 miLoading sold comps…