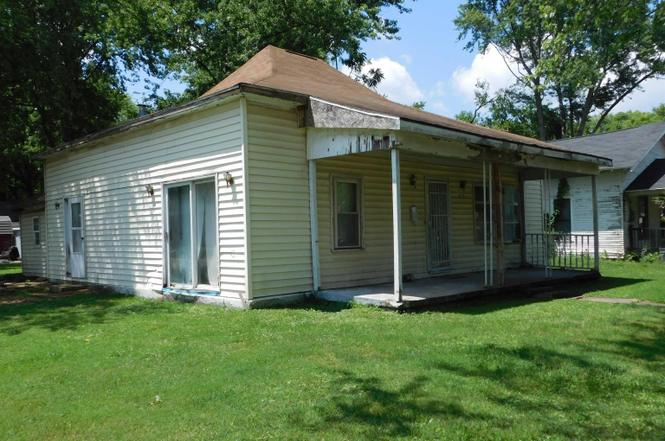
419 S Pearl St · Salem, IL
Flood risk 1/10 · Minimal
- FEMA flood zone
- X (unshaded)
- Chance of flooding over 30 yrs
- 0.0%
- Est. flood insurance / yr
- $473 – $860
Fire risk 1/10 · Minimal
- Est. fire insurance / yr
- $804 – $1,492
Heat risk 4/10 · Minor
- Hot days now (above 106°F)
- 7 days/yr
- Hot days in 30 yrs
- 20 days/yr
Wind risk 2/10 · Minimal
- Chance of severe wind over 30 yrs
- 2.0%
Air-quality risk 2/10 · Minimal
- Unhealthy air days now
- 1 days/yr
- Unhealthy air days in 30 yrs
- 2 days/yr
Risk factors via First Street. Map © Google.
Why this score? — see what drove the D grade
The composite is a weighted blend of 9 inputs, each scored 0–100. Each bar is that input's sub-score; the figure is the points it added to the 100-point composite (weight × sub-score).
- Cash flow +15.0/30.0
- ARV discount +7.5/15.0
- 1% rule +5.0/10.0
- DSCR +5.0/10.0
- Livability +3.4/5.0
- Schools +2.6/10.0
- Rent growth +2.5/5.0
- Condition / age +2.5/5.0
- Appreciation +0.0/10.0
$12,500
🖨 Deal sheet (PDF) 📄 Offer letter ✓ Due diligence
Listing remarks MLS
Investment opportunity! 2 or 3 bedroom home with 2 baths located on corner lot. Utilities currently not on, has been vacant for 2 years and will be sold as is. Heat source is gas wall furnace, no AC. Wall Furnace in living room is not hooked up to gas line. Will not qualify for special financing such as rural dev, VA, FHA or IHDA grant.
Key facts
- 8,750 sq ft lot
- 10 parking spots
- Listed 165 days
Property features AI
Finance
- Other: Possession: immediate
- HOA & community: No master association fee required
Exterior
- Parking: Parking for about 10 vehicles
- Utilities: Public water; Public sewer
- Home design: Detached single-family home; One-story layout; Fee simple ownership; Aluminum siding exterior; Built before 1978 (property age estimated 51–60 years)
- Construction: Aluminum siding construction
- Exterior features: Lot dimensions approximately 50 x 175; Property sits on roughly 1.0–1.99 acres; Directions: take highway to roads leading to property
Interior
- Kitchen: Kitchen on the main level (approximately 10 x 10)
- Bedrooms: 3 bedrooms (all on the main level); Bedroom dimensions include 12 x 12 (master), 11 x 11, and 10 x 10
- Bathrooms: 2 full bathrooms
- Heating & cooling: Natural gas heating; Window air conditioning units
- Interior features: 7 total rooms
- Laundry & utility: Main-level laundry (approximately 8 x 8)
Neighborhood map
What this means for you Summary
Snapshot
- This is a 3-bed/2.0-bath single-family listed at $12k.
Deal economics
- At list price, monthly cash flow is $885 ($11k/yr) — positive.
- The deal already cash-flows at list — no discount required.
- Meets the 1% rule at list price ($1k rent vs $12k).
- Recommended offer: $11k (12.0% below list) — sets the bar for market timing.
- Cap rate 91.3% vs local median 5.6% in Salem — top-decile yield for the area; either an underpriced asset or a hidden risk that comps aren't pricing in. Stress-test before assuming the spread holds.
Location & tenants
- Location reads 68/100 on livability (#467 in IL) — a middle-class / working-renter tenant base. Strengths: cost of living A+, housing A+, health & safety A+; Watch: amenities F, commute F, employment D-.
- Salem Chsd 600 (town): math 25% / reading 30% proficiency, ranked #571 of 919 in IL (top 62%) — low school quality limits family demand, transient renter base, plan for 1-2y turnover.
- Zoned schools: Hawthorn Elem School (math 22% / reading 32%, grade F, #749 of 2,056 statewide, top 40%, 399 students, 0% FRL); Franklin Park Middle School (math 25% / reading 44%, grade F, #201 of 665 statewide, top 31%, 529 students, 0% FRL); Salem Community High School (math 22% / reading 17%, grade F, #397 of 693 statewide, top 61%, 732 students, 0% FRL).
- Market conditions: 49 active listings in the ZIP; 2 units permitted in Marion County in 2024 (0 in 5+ unit buildings).
Forward outlook
- Local home prices are declining (-3.0%/yr); year-one equity from $86 of loan paydown is wiped out by about $375 of value loss. Plan a longer hold.
- Marion County population projected at -20% by 2050 — secular population decline; favor cash flow + early exit over multi-decade hold.
- At projected returns (-3.0% appreciation + 3.0% rent growth), your $4k cash investment doubles in ~1 year — after that, you're playing with house money.
Negotiation context
- It's been on market 166 days — a 12% lower offer ($11k) is reasonable based on typical stale-listing flexibility.
- 7 sale attempts since 4y ago; this cycle's ask has dropped $8k (38%) from the opening price — seller is motivated, your offer sets the floor, not the list.
- Current owner paid $8k; list at $12k implies a 56% gain — meaningful room to come down on a strong offer.
Questions for the listing agent
- It's been on market 166 days. Have you received any prior offers? Is the seller open to a 12% concession, seller financing, or rate buy-down credit?
- Why hasn't it sold? Are there any deal-killer items the seller is aware of (foundation, flood, title, zoning, code violations)?
- Is there a deadline driving the sale (1031 exchange, divorce, estate, relocation)? That informs how much negotiation room exists.
- Schools are D-rated, which usually means shorter tenancies and higher turnover. Who's the typical renter profile here, and what's been the actual vacancy rate?
- The area grade is low — what's the realistic commute time and amenity access for the typical tenant pool here? Any planned neighborhood developments (good or bad) we should know about?
- What's the average days-on-market for RENTAL listings here right now (not sales)? A rising rental-DOM trend means longer vacancies and softer asking-rent achievability than the comps imply.
- What's the recent tenant-quality profile in this submarket — average credit score on applications, eviction rate, late-payment / NSF rate, and stable-employment percentage? A property-management company in the area should have these aggregated.
- How much new for-sale + rental construction is in the pipeline within 1–3 miles? Heavy new supply typically softens prices + rents 12–24 months out; constrained supply supports both.
Investment metrics
- 1% rule
- 9.85% ✓
- Cap rate
- 91.27%
- Cash-on-cash
- 303.50%
- DSCR
- 14.50
- GRM
- 0.8
CMA / ARV
- ARV (on-the-fly)
- $141,625
- Comps found
- 12
Show comp detail 12 sales within ~0.75 mi
| Address | Dist | Beds/Ba | Sqft | Sold | Price | $/sf | Match |
|---|---|---|---|---|---|---|---|
| 304 S Castle St | 0.16mi | 4/2.0 (+1) | 1,366 (-1%) | 8mo | $68,000 | $50 | 80 |
| 416 S Maple St | 0.07mi | 3/1.0 | 1,259 (-8%) | 2mo | $112,500 | $89 | 77 |
| 501 W Mcmackin St | 0.14mi | 2/1.0 (-1) | 1,292 (-6%) | 1mo | $8,000 | $6 | 73 |
| 727 N Broadway Ave | 0.59mi | 3/1.0 | 1,375 (0%) | 2mo | $84,800 | $62 | 67 |
| 732 W Lovell St | 0.47mi | 3/1.5 | 1,419 (+3%) | 11mo | $140,000 | $99 | 61 |
| 905 W Blair | 0.54mi | 3/2.0 | 1,282 (-7%) | 5mo | $146,000 | $114 | 60 |
| 509 W Warmouth St | 0.46mi | 3/2.0 | 1,300 (-6%) | 12mo | $190,000 | $146 | 59 |
| 120 E Bennett St | 0.72mi | 3/1.5 | 1,407 (+2%) | 2mo | $138,990 | $99 | 59 |
| 326 N Indiana St | 0.49mi | 4/1.0 (+1) | 1,297 (-6%) | 9mo | $145,000 | $112 | 51 |
| 515 Oglesby St | 0.74mi | 4/2.5 (+1) | 1,436 (+4%) | 9mo | $148,500 | $103 | 44 |
| 620 W Allmon St | 0.56mi | 3/2.0 | 1,561 (+14%) | 10mo | $170,000 | $109 | 43 |
| 441 N Ohio Ave | 0.56mi | 2/1.0 (-1) | 1,184 (-14%) | 6mo | $126,000 | $106 | 36 |
Match score weights: distance 35% · size 25% · config 20% · recency 20%. Top-matched comps best support the ARV.
Projected returns pro-forma
-3.0% appreciation · 3.0% rent growth · sell at horizon
- IRR
- —
- Equity multiple
- 16.54×
- Total profit
- $54,374
- Equity at exit
- $1,864
- IRR
- —
- Equity multiple
- 35.29×
- Total profit
- $120,024
- Equity at exit
- $1,081
Cash invested: $3,500 (down + closing). Projections, not guarantees.
Landlord ↔ Tenant lean methodology
- Overall (STATE)
- 43 Moderately Tenant-Leaning
- State Illinois
- 43 Moderately Tenant-Leaning · D+7
- County
- — inherits STATE
- City
- — inherits STATE
ZIP-level market 62881
- Home prices YoY
- -28.0%
- Active inventory
- 49
- Price-to-rent
- 0.8×
Monthly cashflow live
- Estimated rent
- $1,231 medium interval (Pro) →
- Mortgage (P&I)
- −$66
- Tax from tax record
- −$17 /mo · $201/yr
- Insurance
- −$5
- HOA
- −$0
- Lot rent
- −$0
- Vacancy / Maint / Mgmt
- −$259
- Net cashflow
- $885
Break-even live
Sensitivity live
| Price | -10% $892 | -5% $889 | +0% $885 | +5% $882 | +10% $878 |
|---|---|---|---|---|---|
| Rent | -10% $788 | -5% $837 | +0% $885 | +5% $934 | +10% $982 |
| Rate | -1.0pp $892 | -0.5pp $888 | base $885 | +0.5pp $882 | +1.0pp $879 |
UW: 25.0% down · 7.5% · 30yr · 1.5% tax · 5.0% vac · 8.0% maint · 8.0% mgmt
Financing live
Cash to close
- Down payment
- $3,125
- Closing costs
- $375
- Reserves months
- —
- Total cash needed
- —
Loan-product check · same deal, 3 products live
Conventional
25% down · 7.5% · 30yr
- Down + closing
- —
- Monthly P&I
- —
- Monthly cashflow
- —
- DSCR
- —
- Eligible?
- —
Personal DTI + credit; lowest rate.
DSCR
20% down · 8.5% · 30yr
- Down + closing
- —
- Monthly P&I
- —
- Monthly cashflow
- —
- DSCR
- —
- Eligible?
- —
No personal income docs; deal must DSCR.
Hard money
10% down · 12.0% · 12mo
- Down + closing
- —
- Monthly P&I
- —
- Monthly cashflow
- —
- DSCR
- —
- Eligible?
- —
Short-term bridge; refi at stabilization.
Listing history 20 events
-
2026-04-02status Active
-
2026-03-31historical
-
2026-02-04price $12,500
-
2026-01-14price $15,000
-
2025-12-12status Active
-
2025-12-11historical
-
2025-12-11status Temporarily No Showings
-
2025-12-11historical
-
2025-12-09$20,000 Active
-
2022-11-18soldstatus $8,000 341-char remark
Show marketing remark (341 chars)
Investment opportunity! 2 or 3 bedroom home with 2 baths located on corner lot. Utilities currently not on, has been vacant for 2 years and will be sold as is. Heat source is gas wall furnace, no AC. Wall Furnace in living room is not hooked up to gas line. Will not qualify for special financing such as rural dev, VA, FHA or IHDA grant.
-
2022-11-18soldstatus $8,000 Closed 341-char remark
Show marketing remark (341 chars)
Investment opportunity! 2 or 3 bedroom home with 2 baths located on corner lot. Utilities currently not on, has been vacant for 2 years and will be sold as is. Heat source is gas wall furnace, no AC. Wall Furnace in living room is not hooked up to gas line. Will not qualify for special financing such as rural dev, VA, FHA or IHDA grant.
-
2022-10-24status Pending 341-char remark
Show marketing remark (341 chars)
Investment opportunity! 2 or 3 bedroom home with 2 baths located on corner lot. Utilities currently not on, has been vacant for 2 years and will be sold as is. Heat source is gas wall furnace, no AC. Wall Furnace in living room is not hooked up to gas line. Will not qualify for special financing such as rural dev, VA, FHA or IHDA grant.
-
2022-09-19price $9,500 341-char remark
Show marketing remark (341 chars)
Investment opportunity! 2 or 3 bedroom home with 2 baths located on corner lot. Utilities currently not on, has been vacant for 2 years and will be sold as is. Heat source is gas wall furnace, no AC. Wall Furnace in living room is not hooked up to gas line. Will not qualify for special financing such as rural dev, VA, FHA or IHDA grant.
-
2022-08-28status Active 341-char remark
Show marketing remark (341 chars)
Investment opportunity! 2 or 3 bedroom home with 2 baths located on corner lot. Utilities currently not on, has been vacant for 2 years and will be sold as is. Heat source is gas wall furnace, no AC. Wall Furnace in living room is not hooked up to gas line. Will not qualify for special financing such as rural dev, VA, FHA or IHDA grant.
-
2022-08-25historical Under Contract 341-char remark
Show marketing remark (341 chars)
Investment opportunity! 2 or 3 bedroom home with 2 baths located on corner lot. Utilities currently not on, has been vacant for 2 years and will be sold as is. Heat source is gas wall furnace, no AC. Wall Furnace in living room is not hooked up to gas line. Will not qualify for special financing such as rural dev, VA, FHA or IHDA grant.
-
2022-08-01price $14,500 341-char remark
Show marketing remark (341 chars)
Investment opportunity! 2 or 3 bedroom home with 2 baths located on corner lot. Utilities currently not on, has been vacant for 2 years and will be sold as is. Heat source is gas wall furnace, no AC. Wall Furnace in living room is not hooked up to gas line. Will not qualify for special financing such as rural dev, VA, FHA or IHDA grant.
-
2022-07-21$9,500 341-char remark
Show marketing remark (341 chars)
Investment opportunity! 2 or 3 bedroom home with 2 baths located on corner lot. Utilities currently not on, has been vacant for 2 years and will be sold as is. Heat source is gas wall furnace, no AC. Wall Furnace in living room is not hooked up to gas line. Will not qualify for special financing such as rural dev, VA, FHA or IHDA grant.
-
2022-07-21$16,500 Active 341-char remark
Show marketing remark (341 chars)
Investment opportunity! 2 or 3 bedroom home with 2 baths located on corner lot. Utilities currently not on, has been vacant for 2 years and will be sold as is. Heat source is gas wall furnace, no AC. Wall Furnace in living room is not hooked up to gas line. Will not qualify for special financing such as rural dev, VA, FHA or IHDA grant.
-
2021-08-06historical
-
2019-01-25historical
ⓘ Source: listings_history table (triggers on properties + properties_extension) + one-shot
backfill from property_details.listing_events for pre-trigger history.
Tax reassessment forecast IL · Partial reset (capped growth)
- Current annual tax
- $201 · $17/mo
- Projected year-2 tax
- $242 · $20/mo
- Expected delta
- +$41/yr (+$3/mo · 20.7%)
ⓘ Screening estimate from a state-policy table — verify with the county assessor before closing.
Climate risk First Street
- Flood 1/10 Low FEMA zone X (unshaded) · 0% chance over 30 yrs
- Wildfire 1/10 Low
- Heat 4/10 Moderate 7 d/yr ≥106°F today · 20 d/yr by 30 yrs out
- Wind 2/10 Low 2% chance of damaging wind over 30 yrs
- Air quality 2/10 Low 1 unhealthy d/yr today · 2 by 30 yrs out
Nearby sold comps map
Loading sold comps map…
Walkable amenities ~0.75 mi
Loading nearby amenities…
Taxation est. · year 1
- Rental income
- $14,775
- − Mortgage interest
- −$700
- − Property taxes
- −$201
- − Insurance
- −$62
- − Repairs & maintenance
- −$1,182
- − Management
- −$1,182
- − Depreciation
- −$364
- Taxable income
- $11,084
- Est. tax owed @ 24.0%
- −$2,660
- After-tax cash flow
- $7,962/yr
For passive investors: Depreciation is non-cash, so a rental often shows a tax loss while cash-flowing — sheltering income. Rental losses are passive: they offset passive income freely, and up to $25,000/yr can offset ordinary (W-2) income if you actively participate and your MAGI is under $100k (phasing out to $0 by $150k); unused losses carry forward. On sale, claimed depreciation is recaptured at up to 25%, and gains may owe capital-gains tax (a 1031 exchange can defer both). Figures are a year-1 estimate at your 24.0% rate — not tax advice; consult a CPA.
Schools (NCES district)
- District
- Salem Chsd 600
- NCES district ID
- 1735190
- Math proficiency
- 25% ▲ 10.00%
- Reading proficiency
- 30% ▲ 5.00%
- Median HH income
- $39,305
- Composite
- 26.04/100
- National rank
- #12738
- State rank
- #571 of 919 in IL
Livability — Salem
- Score
- 68/100
- State rank
- #467
- US rank
- #9634
Category grades
Schools grade is shown separately in the Schools card above.
Census & demographics
- Census place
- Salem, IL
- City population
- 11,218
- Population (ZIP)
- 11,218
Population outlook (Marion County) Hauer SSP2
- Today (2025)
- 36,071 people
- By 2030
- 34,598 · -4.1%
- By 2040
- 31,754 · -12.0%
- By 2050
- 28,912 · -19.8%
- By 2075
- 22,527 · -37.5%
- By 2100
- 16,455 · -54.4%
Race, ethnicity, and origin ACS 2023
- Neighborhood character
- Predominantly White (93%)
- Race & ethnicity
- White 93% Black 3% Two or more races 2%
- Common ancestry
- Romanian 2% Italian 2% Iranian 2%
- Foreign-born
- 1%
- Languages at home
- 99% English-only · Spanish 1%
Political lean MEDSL · Marion
- 2024 margin
- Solid R (+49.5) · D 24.6% · R 74.1% · Other 1.4%
- 2008→2024 swing
- -47.5pp toward R · 2008: -2.0pp · 2024: -49.5pp
- All cycles
- 2024: R+49.5 2020: R+46.6 2016: R+44.9 2012: R+19.2 2008: R+2.0
Not yet ingested
- Civics
- —
Market trends
- HPI YoY
- ▼ -63.16%
- Current HPI
- 162.55
- Rent YoY
- —
- Metro
- —
- State GDP YoY
- ▲ 1.59%
- F500 in state
- 60
Industry mix (Fortune 500 HQ in IL)
| Industry | F500 HQs | Revenue |
|---|---|---|
| Insurance | 4 | $201B |
|
||
| Consumer Goods | 4 | $87B |
|
||
| Industrial Machinery | 3 | $64B |
|
||
| Healthcare | 2 | $55B |
|
||
| Retail / Pharmacy | 1 | $148B |
|
||
| Agriculture / Food | 1 | $86B |
|
||
Price history
+31.6% since first listed20 events — show timeline
- 2026-04-02 Relisted — MRED as Distributed by MLS Grid
- 2026-03-31 Listing Removed — MRED as Distributed by MLS Grid
- 2026-02-04 Price Changed $12,500 MRED as Distributed by MLS Grid
- 2026-01-14 Price Changed $15,000 MRED as Distributed by MLS Grid
- 2025-12-12 Relisted — MRED as Distributed by MLS Grid
- 2025-12-11 Listing Removed — MRED as Distributed by MLS Grid
- 2025-12-11 Relisted — MRED as Distributed by MLS Grid
- 2025-12-11 Listing Removed — MRED as Distributed by MLS Grid
- 2025-12-09 Listed $20,000 MRED as Distributed by MLS Grid
- 2022-11-18 Sold (MLS) $8,000 RMLSA as Distributed by MLS Grid
- 2022-11-18 Sold (MLS) $8,000 MRED as Distributed by MLS Grid
- 2022-10-24 Pending — RMLSA as Distributed by MLS Grid
- 2022-09-19 Price Changed $9,500 RMLSA as Distributed by MLS Grid
- 2022-08-28 Relisted — RMLSA as Distributed by MLS Grid
- 2022-08-25 Contingent — RMLSA as Distributed by MLS Grid
- 2022-08-01 Price Changed $14,500 RMLSA as Distributed by MLS Grid
- 2022-07-21 Listed $16,500 RMLSA as Distributed by MLS Grid
- 2022-07-21 Listed $9,500 MRED as Distributed by MLS Grid
- 2021-08-06 Listing Removed — RMLSA as Distributed by MLS Grid
- 2019-01-25 Listing Removed — MRED as Distributed by MLS Grid
Property tax history
-7.8%/yrLatest (2024): $201 · -6.9% YoY. Source: county tax records.
Cash-flow waterfall
monthlySold comps — $/sqft
last 12 mo · ≤1 miLoading sold comps…