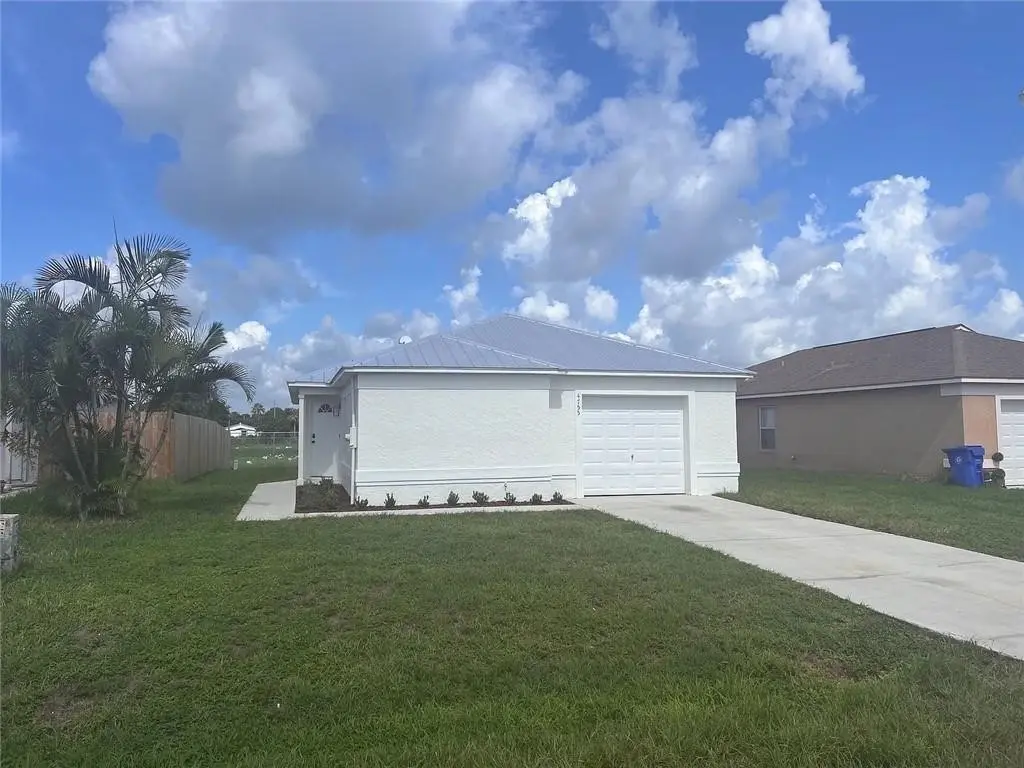
4755 30th Ave · Gifford, FL
Flood risk 1/10 · Minimal
- FEMA flood zone
- X (unshaded)
- Chance of flooding over 30 yrs
- 0.0%
- Est. flood insurance / yr
- $507 – $1,088
Fire risk 3/10 · Minor
- Est. fire insurance / yr
- $947 – $1,759
Heat risk 10/10 · Severe
- Hot days now (above 105°F)
- 7 days/yr
- Hot days in 30 yrs
- 24 days/yr
Wind risk 10/10 · Severe
- Chance of severe wind over 30 yrs
- 99.0%
Air-quality risk 1/10 · Minimal
- Unhealthy air days now
- 0 days/yr
- Unhealthy air days in 30 yrs
- 0 days/yr
Risk factors via First Street. Map © Google.
Why this score? — see what drove the C+ grade
The composite is a weighted blend of 9 inputs, each scored 0–100. Each bar is that input's sub-score; the figure is the points it added to the 100-point composite (weight × sub-score).
- Cash flow +27.2/30.0
- DSCR +9.5/10.0
- 1% rule +7.0/10.0
- Schools +4.2/10.0
- ARV discount +4.0/15.0
- Livability +3.4/5.0
- Condition / age +2.5/5.0
- Rent growth +2.2/5.0
- Appreciation +0.0/10.0
$225,000
🖨 Deal sheet 📄 Offer letter ✓ Due diligence
Listing remarks MLS
nice 4 bedroom 2 full bath single car garage in desired area of Gifford, close to 53rd street Publix shopping plaza. Limited showing times, available to show Mon-Fri 1pm or 6pm, Saturday after 12:00pm
Key facts
- New metal roof
- Tenant occupied
- A/c installed
Tags
Property features AI
Finance
- Financial info: Pets allowed
- HOA & community: No HOA (association listed as n/a)
Exterior
- Parking: Attached garage with 1 car space
- Security: Smoke detectors
- Utilities: Public water; County sewer
- Home design: Single-story home; East-facing
- Construction: Block and concrete construction; Metal roof; Built on a single story
- Exterior features: Less than quarter acre lot (approx. 40x98); Has a view; No other exterior features listed
Interior
- Kitchen: Dishwasher; Microwave; Range; Refrigerator
- Bedrooms: Four bedrooms approximately 11x10; One bedroom approximately 14x11; One bedroom approximately 11x10
- Flooring: Tile
- Bathrooms: Two full bathrooms
- Heating & cooling: Central heating; Central air conditioning
- Interior features: Sliding doors; Pantry; Split bedroom floor plan; Unfurnished; Tile flooring
- Laundry & utility: Laundry area in garage
Neighborhood map
What this means for you Summary
Snapshot
- This is a 3-bed/2.0-bath single-family listed at $225k.
Deal economics
- At list price, monthly cash flow is $645 ($8k/yr) — positive.
- The deal already cash-flows at list — no discount required.
- Meets the 1% rule at list price ($3k rent vs $225k).
- Recommended offer: $222k (1.5% below list) — sets the bar for market timing.
- Cap rate 9.7% vs local median 3.0% in Gifford — top-decile yield for the area; either an underpriced asset or a hidden risk that comps aren't pricing in. Stress-test before assuming the spread holds.
Location & tenants
- Location reads 68/100 on livability (#538 in FL) — a middle-class / working-renter tenant base. Strengths: commute A+, cost of living A+, health & safety A; Watch: schools D+, amenities F, employment F.
- Indian River (other): math 48% / reading 52% proficiency, ranked #35 of 73 in FL (top 48%) — acceptable for families but not a draw, mixed tenant base, ~2y average lease.
- Market conditions: Rents soft (-1.2%/yr); 612 active listings in the ZIP; 24 comparable units currently listed for rent nearby; rentals at typical pace (median 21d on market — plan ~3-4 weeks tenant-placement turnaround); solid renter incomes; 564 units permitted in Indian River County in 2024 (281 in 5+ unit buildings).
- This rent runs 42% of the median local income ($78k/yr) — at the standard rent-burdened threshold; future hikes will face affordability resistance.
Forward outlook
- Local home prices are declining (-3.0%/yr); year-one equity from $2k of loan paydown is wiped out by about $7k of value loss. Plan a longer hold.
- Indian River County population projected at +18% by 2050 — long-run rental-demand tailwind backs the buy-and-hold thesis.
Negotiation context
- It's been on market 16 days — a 2% lower offer ($222k) is reasonable based on typical stale-listing flexibility.
- 4 sale attempts since 14y ago with the ask held roughly flat each time — persistent listings suggest the price (not the market) is what's stuck; bring a comps-based counter.
- Current owner paid $156k; 44% above their basis — modest negotiation headroom, anchor on the comps not their cost.
Risks & watch-outs
- Climate carrying-cost: severe wind risk, 99% chance of damaging wind over 30y; extreme-heat days projected 7→24/yr by 2055 (HVAC capex compounding) — expect insurance premiums to compound above CPI over the hold.
Questions for the listing agent
- Is there a deadline driving the sale (1031 exchange, divorce, estate, relocation)? That informs how much negotiation room exists.
- Schools are D-rated, which usually means shorter tenancies and higher turnover. Who's the typical renter profile here, and what's been the actual vacancy rate?
- What's the average days-on-market for RENTAL listings here right now (not sales)? A rising rental-DOM trend means longer vacancies and softer asking-rent achievability than the comps imply.
- What's the recent tenant-quality profile in this submarket — average credit score on applications, eviction rate, late-payment / NSF rate, and stable-employment percentage? A property-management company in the area should have these aggregated.
- How much new for-sale + rental construction is in the pipeline within 1–3 miles? Heavy new supply typically softens prices + rents 12–24 months out; constrained supply supports both.
Investment metrics
- 1% rule
- 1.20% ✓
- Cap rate
- 9.73%
- Cash-on-cash
- 12.29%
- DSCR
- 1.55
- GRM
- 6.9
CMA / ARV
- ARV (on-the-fly)
- $208,817
- Comps found
- 12
Show comp detail 12 sales within ~0.75 mi
| Address | Dist | Beds/Ba | Sqft | Sold | Price | $/sf | Match |
|---|---|---|---|---|---|---|---|
| 4885 29th Ave | 0.13mi | 3/2.0 | 1,297 (0%) | 12mo | $158,000 | $122 | 84 |
| 4755 29th Ave | 0.05mi | 4/2.0 (+1) | 1,297 (0%) | 12mo | $209,000 | $161 | 83 |
| 4855 30th Ave | 0.09mi | 4/2.0 (+1) | 1,297 (0%) | 14mo | $209,000 | $161 | 79 |
| 4835 29th Ave | 0.09mi | 4/2.0 (+1) | 1,297 (0%) | 14mo | $209,000 | $161 | 79 |
| 4815 30th Ave | 0.06mi | 4/2.0 (+1) | 1,297 (0%) | 16mo | $210,000 | $162 | 79 |
| 4826 29th Ave | 0.10mi | 4/2.0 (+1) | 1,297 (0%) | 17mo | $204,000 | $157 | 76 |
| 4786 30th Ave | 0.04mi | 4/2.0 (+1) | 1,200 (-8%) | 15mo | $206,000 | $172 | 68 |
| 4746 30th Ave | 0.03mi | 4/2.0 (+1) | 1,200 (-8%) | 15mo | $205,000 | $171 | 68 |
| 4866 29th Ave | 0.13mi | 4/2.0 (+1) | 1,200 (-8%) | 20mo | $199,500 | $166 | 60 |
| 4353 30th Ave | 0.54mi | 3/2.0 | 1,102 (-15%) | 5mo | $127,000 | $115 | 46 |
| 4248 26th Ave | 0.70mi | 3/2.0 | 1,470 (+13%) | 3mo | $230,000 | $156 | 43 |
| 5015 Fairways Cir Unit A205 | 0.63mi | 2/2.0 (-1) | 1,471 (+13%) | 16mo | $305,000 | $207 | 30 |
Match score weights: distance 35% · size 25% · config 20% · recency 20%. Top-matched comps best support the ARV.
Projected returns pro-forma
-3.0% appreciation · 0.0% rent growth · sell at horizon
- IRR
- -1.4%
- Equity multiple
- 0.95×
- Total profit
- $-3,296
- Equity at exit
- $33,548
- IRR
- 4.8%
- Equity multiple
- 1.31×
- Total profit
- $19,382
- Equity at exit
- $19,454
Cash invested: $63,000 (down + closing). Projections, not guarantees.
Landlord ↔ Tenant lean methodology
- Overall (STATE)
- 87 Strongly Landlord-Friendly
- State Florida
- 87 Strongly Landlord-Friendly · R+3
- County
- — inherits STATE
- City
- — inherits STATE
ZIP-level market 32967
- Home prices YoY
- -24.4%
- Rents YoY
- -1.2%
- Active inventory
- 612
- Price-to-rent
- 6.9×
Monthly cashflow live
- Estimated rent
- $2,710 high interval (Pro) →
- Mortgage (P&I)
- −$1,180
- Tax from tax record
- −$222 /mo · $2,659/yr
- Insurance
- −$94
- HOA
- −$0
- Vacancy / Maint / Mgmt
- −$569
- Net cashflow
- $645
Break-even live
UW: 25.0% down · 7.5% · 30yr · 1.5% tax · 5.0% vac · 8.0% maint · 8.0% mgmt
Financing live
Cash to close
- Down payment
- $56,250
- Closing costs
- $6,750
- Reserves months
- —
- Total cash needed
- —
Loan-product check · same deal, 3 products live
Conventional
25% down · 7.5% · 30yr
- Down + closing
- —
- Monthly P&I
- —
- Monthly cashflow
- —
- DSCR
- —
- Eligible?
- —
Personal DTI + credit; lowest rate.
DSCR
20% down · 8.5% · 30yr
- Down + closing
- —
- Monthly P&I
- —
- Monthly cashflow
- —
- DSCR
- —
- Eligible?
- —
No personal income docs; deal must DSCR.
Hard money
10% down · 12.0% · 12mo
- Down + closing
- —
- Monthly P&I
- —
- Monthly cashflow
- —
- DSCR
- —
- Eligible?
- —
Short-term bridge; refi at stabilization.
Rent comps 24 comps
| Address | Beds | Baths | Sqft | Rent | $/sqft | DOM | Units | Dist |
|---|---|---|---|---|---|---|---|---|
| 5045 Fairways Cir Unit D101 Vero Beach, FL | 3.0 | 2.0 | 1848 | $2,200 | $1.19 | 13d | 1 | 0.49mi |
| 5050 Fairways Cir Vero Beach, FL | 2.0 | 2.0 | 1085 | $1,750 | $1.61 | 21d | 2 | 0.54mi |
| 5035 Fairways Cir Vero Beach, FL | 1.0–2.0 | 1.0–2.0 | 1191 | $2,400 | $2.01 | 21d | 5 | 0.57mi |
| 5020 Fairways Cir Vero Beach, FL | 2.0 | 2.0 | 1345 | $2,125 | $1.58 | 21d | 2 | 0.57mi |
| 5095 Fairways Cir Vero Beach, FL | 3.0 | 2.0 | 1190 | $2,450 | $2.06 | 21d | 2 | 0.66mi |
| 5095 Fairways Cir Vero Beach, FL | 2.0–3.0 | 2.0 | 1092 | $2,500 | $2.29 | 13d | 3 | 0.66mi |
| 4248 26th Ave Vero Beach, FL | 3.0 | 2.0 | 1531 | $2,200 | $1.44 | 13d | 1 | 0.68mi |
| 4016 Basket Oak Cir Vero Beach, FL | 2.0 | 2.0 | 1577 | $2,550 | $1.62 | 21d | 1 | 0.77mi |
| 2010 Bridgepointe Cir Unit 102 Vero Beach, FL | 3.0 | 3.0 | 1774 | $5,000 | $2.82 | 21d | 1 | 0.77mi |
| 2025 Bridgepointe Cir #118 Vero Beach, FL | 3.0 | 2.5 | 1702 | $3,450 | $2.03 | 13d | 1 | 0.80mi |
| 5075 Harmony Cir #103 Vero Beach, FL | 2.0 | 2.0 | 1368 | $2,500 | $1.83 | 13d | 1 | 1.02mi |
| 4350 Doubles Alley Dr #203 Vero Beach, FL | 2.0 | 2.0 | 1168 | $2,000 | $1.71 | 13d | 1 | 1.06mi |
| 5080 Harmony Cir #304 Vero Beach, FL | 2.0 | 2.0 | 1368 | $8,500 | $6.21 | 13d | 1 | 1.09mi |
| 5045 Harmony Cir #102 Vero Beach, FL | 2.0 | 2.0 | 1368 | $9,500 | $6.94 | 13d | 1 | 1.11mi |
| 1638 Baseline Ln Vero Beach, FL | 3.0 | 2.5 | 1766 | $4,500 | $2.55 | 21d | 1 | 1.12mi |
| 1590 S 42nd Cir Vero Beach, FL | 2.0–3.0 | 2.0 | 1234 | $2,500 | $2.03 | 21d | 3 | 1.19mi |
| 1640 N 42nd Cir Vero Beach, FL | 2.0 | 2.0 | 1127 | $1,998 | $1.77 | 21d | 2 | 1.20mi |
| 1345 Saint Davids Ln Vero Beach, FL | 2.0 | 2.5 | 1581 | $4,000 | $2.53 | 21d | 1 | 1.22mi |
| 4890 48th Ave Vero Beach, FL | 3.0 | 2.0 | 1469 | $2,300 | $1.57 | 21d | 1 | 1.26mi |
| 1550 S 42nd Cir Vero Beach, FL | 2.0–3.0 | 2.0 | 1234 | $2,300 | $1.86 | 13d | 3 | 1.28mi |
| 5204 Jasper Sq Vero Beach, FL | 4.0 | 2.0 | 1850 | $3,000 | $1.62 | 21d | 1 | 1.28mi |
| 4920 48th Pl Vero Beach, FL | 3.0 | 2.0 | 1643 | $3,200 | $1.95 | 13d | 1 | 1.31mi |
| 5225 E Harbor Village Dr #303 Vero Beach, FL | 3.0 | 2.0 | 1582 | $13,000 | $8.22 | 21d | 1 | 1.46mi |
| 4625 55th St Vero Beach, FL | 4.0 | 2.0 | 1613 | $2,800 | $1.74 | 13d | 1 | 1.49mi |
Listing history 13 events
-
2026-06-19days on market $225,000 Active 16 DOM
-
2026-06-18days on market $225,000 Active 15 DOM
-
2026-06-17days on market $225,000 Active 14 DOM
-
2026-06-16days on market $225,000 Active 13 DOM
-
2026-06-15days on market $225,000 Active 12 DOM
-
2026-06-14days on market $225,000 Active 10 DOM
-
2026-06-13statusdays on market $225,000 Active 9 DOM
-
2026-06-08status $225,000 Pending 7 DOM
-
2026-06-07days on market $225,000 Active 7 DOM
-
2026-06-05days on market $225,000 Active 4 DOM
-
2026-06-02days on market $225,000 Active 2 DOM
-
2026-06-01remarks 502-char remark
-
2026-06-01$225,000 Active 1 DOM
ⓘ Source: listings_history table (triggers on properties + properties_extension) + one-shot
backfill from property_details.listing_events for pre-trigger history.
Tax reassessment forecast FL · Resets to sale price
- Current annual tax
- $2,659 · $222/mo
- Projected year-2 tax
- $2,659 · $222/mo
- Expected delta
- $0/yr ($0/mo · 0.0%)
ⓘ Screening estimate from a state-policy table — verify with the county assessor before closing.
Climate risk First Street
- Flood 1/10 Low FEMA zone X (unshaded) · 0% chance over 30 yrs
- Wildfire 3/10 Moderate
- Heat 10/10 Extreme 7 d/yr ≥105°F today · 24 d/yr by 30 yrs out
- Wind 10/10 Extreme 99% chance of damaging wind over 30 yrs
- Air quality 1/10 Low 0 unhealthy d/yr today · 0 by 30 yrs out
Nearby sold comps map
Loading sold comps map…
Walkable amenities ~0.75 mi
Loading nearby amenities…
Taxation est. · year 1
- Rental income
- $32,515
- − Mortgage interest
- −$12,603
- − Property taxes
- −$2,659
- − Insurance
- −$1,125
- − Repairs & maintenance
- −$2,601
- − Management
- −$2,601
- − Depreciation
- −$6,545
- Taxable income
- $4,380
- Est. tax owed @ 24.0%
- −$1,051
- After-tax cash flow
- $6,693/yr
For passive investors: Depreciation is non-cash, so a rental often shows a tax loss while cash-flowing — sheltering income. Rental losses are passive: they offset passive income freely, and up to $25,000/yr can offset ordinary (W-2) income if you actively participate and your MAGI is under $100k (phasing out to $0 by $150k); unused losses carry forward. On sale, claimed depreciation is recaptured at up to 25%, and gains may owe capital-gains tax (a 1031 exchange can defer both). Figures are a year-1 estimate at your 24.0% rate — not tax advice; consult a CPA.
Schools (NCES district)
- District
- Indian River
- NCES district ID
- 1200930
- Math proficiency
- 48% ▼ -9.00%
- Reading proficiency
- 52% ▼ -3.00%
- Median HH income
- $46,597
- Composite
- 42.45/100
- National rank
- #3218
- State rank
- #35 of 73 in FL
Livability — Gifford
- Score
- 68/100
- State rank
- #538
- US rank
- #10083
Category grades
Schools grade is shown separately in the Schools card above.
Census & demographics
- Census place
- Gifford, FL
- County
- Indian River County · 143,738 people
- Metro
- Sebastian-Vero Beach, FL
- Population (ZIP)
- 27,240
- Household income
- $78,058
- Rent vs Own
- Severe rent burden
- 674.0
Population outlook (Indian River County) Hauer SSP2
- Today (2025)
- 165,104 people
- By 2030
- 172,869 · +4.7%
- By 2040
- 185,640 · +12.4%
- By 2050
- 194,465 · +17.8%
- By 2075
- 211,115 · +27.9%
- By 2100
- 211,781 · +28.3%
Race, ethnicity, and origin ACS 2023
- Neighborhood character
- Diverse neighborhood (Simpson 0.59)
- Race & ethnicity
- White 60% Black 17% Two or more races 16% Hispanic / Latino 15%
- Hispanic origin (detail)
- Mexican 4% Puerto Rican 4% Cuban 2% Salvadoran 2%
- Common ancestry
- Romanian 3% Hispanic 3% Lithuanian 3%
- Foreign-born
- 10% · Canada, Jamaica
- Languages at home
- 86% English-only · Spanish 9% French/Haitian/Cajun 3% Russian/Polish/Slavic 1%
Political lean MEDSL · Indian River
- 2024 margin
- Strong R (+27.4) · D 36.0% · R 63.4%
- 2008→2024 swing
- -12.5pp toward R · 2008: -14.8pp · 2024: -27.4pp
- All cycles
- 2024: R+27.4 2020: R+21.6 2016: R+24.5 2012: R+22.3 2008: R+14.8
Not yet ingested
- Civics
- —
Market trends
- HPI YoY
- ▼ -91.34%
- Current HPI
- 282.6156
- Rent YoY
- ▼ -1.16%
- Metro
- Sebastian-Vero Beach, FL
- State GDP YoY
- ▲ 3.28%
- F500 in state
- 36
Industry mix (Fortune 500 HQ in FL)
| Industry | F500 HQs | Revenue |
|---|---|---|
| Industrial Technology | 2 | $29B |
|
||
| Insurance | 2 | $17B |
|
||
| Retail | 1 | $60B |
|
||
| Technology Distribution | 1 | $58B |
|
||
| Homebuilding | 1 | $35B |
|
||
| Technology Manufacturing | 1 | $35B |
|
||
Price history
+200.4% since first listed10 events — show timeline
- 2026-05-31 Listed $225,000 RAIRCMLS
- 2024-08-02 Sold (MLS) $156,350 RAIRCMLS
- 2024-07-29 Sold (Public Records) $156,300 Public Records
- 2024-06-15 Pending — RAIRCMLS
- 2024-06-07 Listed $180,000 RAIRCMLS
- 2024-06-07 Listed $180,000 RAIRCMLS
- 2016-08-16 Listing Removed — SCMLS
- 2013-07-23 Sold (Public Records) $81,000 Public Records
- 2013-07-16 Sold (MLS) $81,000 RAIRCMLS
- 2012-06-07 Listed $74,900 SCMLS
Property tax history
+9.5%/yrLatest (2025): $2,659 · +28.0% YoY. Source: county tax records.
Cash-flow waterfall
monthlySold comps — $/sqft
last 12 mo · ≤1 miLoading sold comps…