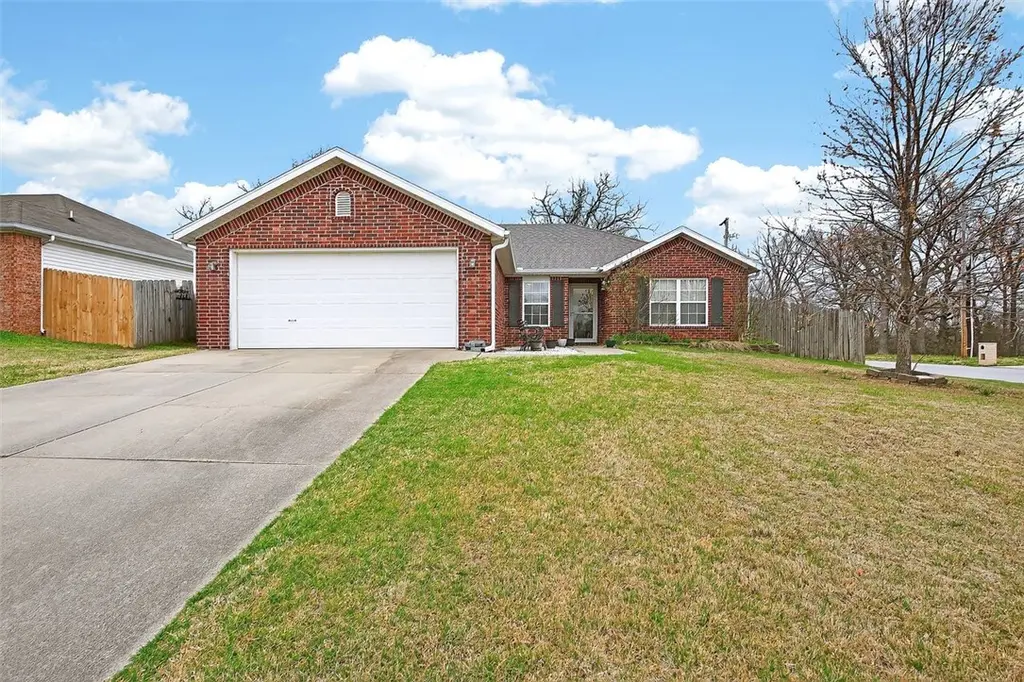
6100 High Meadow Blvd · Bentonville, AR
Flood risk 1/10 · Minimal
- FEMA flood zone
- X (unshaded)
- Chance of flooding over 30 yrs
- 0.0%
- Est. flood insurance / yr
- $507 – $1,088
Fire risk 5/10 · Moderate
- Est. fire insurance / yr
- $1,499 – $2,785
Heat risk 5/10 · Moderate
- Hot days now (above 106°F)
- 7 days/yr
- Hot days in 30 yrs
- 20 days/yr
Wind risk 2/10 · Minimal
- Chance of severe wind over 30 yrs
- 2.0%
Air-quality risk 1/10 · Minimal
- Unhealthy air days now
- 0 days/yr
- Unhealthy air days in 30 yrs
- 0 days/yr
Risk factors via First Street. Map © Google.
Why this score? — see what drove the D+ grade
The composite is a weighted blend of 9 inputs, each scored 0–100. Each bar is that input's sub-score; the figure is the points it added to the 100-point composite (weight × sub-score).
- ARV discount +10.5/15.0
- Appreciation +10.0/10.0
- Cash flow +7.5/30.0
- Schools +5.2/10.0
- Livability +4.2/5.0
- Rent growth +2.6/5.0
- Condition / age +2.5/5.0
- DSCR +1.6/10.0
- 1% rule +1.1/10.0
$315,000
🖨 Deal sheet (PDF) 📄 Offer letter ✓ Due diligence
Listing remarks MLS
Check out this beautiful 4 bedroom home with large backyard. Bentonville schools. Features include open floor plan, split floor plan, wood burning fireplace, refrigerator, very well manicured yard and wood privacy fence. ,Recent updates include new carpet, flooring, and paint!!
Key facts
- Double vanity
- Tray ceiling
- Warming fireplace
Tags
Property features AI
Finance
- HOA & community: Monthly association fee
Exterior
- Parking: Attached garage with garage door opener; 2 covered parking spaces
- Security: Smoke detector(s)
- Utilities: Electricity available; Natural gas available; Public water; Public sewer; Recycling collection
- Home design: Single-story; Brick and vinyl siding exterior; Shingle architectural roof; Slab foundation
- Construction: Brick construction; Vinyl siding; Architectural shingle roof; Slab foundation; Built with attached garage
- Exterior features: Concrete driveway; Deck; Back yard fencing; Corner lot; Public road frontage; Central business district location
Interior
- Kitchen: Dishwasher; Electric range; Disposal; Plumbed for ice maker
- Bedrooms: Split bedroom layout
- Flooring: Luxury vinyl plank
- Bathrooms: 2 full bathrooms
- Heating & cooling: Central heating; Central air conditioning
- Interior features: Attic; Ceiling fan(s); Eat-in kitchen; Split bedrooms; Storage; Walk-in closet(s); Window treatments; Blinds
- Laundry & utility: Washer hookup; Dryer hookup; Electric water heater
Neighborhood map
What this means for you Summary
Snapshot
- This is a 4-bed/2.0-bath single-family listed at $315k.
Deal economics
- At list price, monthly cash flow is $-393 ($-5k/yr) — negative.
- To cash-flow at today's rent, offer at most $246k (22.1% below list).
- To meet the 1% rule (rent ≥ 1% of price), the offer needs to be $192k (38.9% below list).
- Recommended offer: $192k (38.9% below list) — sets the bar for 1% rule.
- Cap rate 4.8% vs local median 2.6% in Bentonville — top-decile yield for the area; either an underpriced asset or a hidden risk that comps aren't pricing in. Stress-test before assuming the spread holds.
Location & tenants
- Location reads 83/100 on livability (#2 in AR, #864 nationally) — a professional / high-income tenant draw. Strengths: employment A+, housing A+, health & safety A+; Watch: amenities F.
- Bentonville School District (urban): math 59% / reading 59% proficiency, ranked #3 of 238 in AR (top 1%) — acceptable for families but not a draw, mixed tenant base, ~2y average lease.
- Market conditions: Rents flat; 710 active listings in the ZIP; 11 comparable units currently listed for rent nearby; rentals at typical pace (median 26d on market — plan ~3-4 weeks tenant-placement turnaround); high-income renter base; 4,359 units permitted in Benton County in 2024 (402 in 5+ unit buildings).
Forward outlook
- In year one you build about $34k of equity ($2k loan paydown + $32k appreciation (10.0% local appreciation)).
- Benton County population projected at +56% by 2050 — long-run rental-demand tailwind backs the buy-and-hold thesis.
- By year 2, paydown + projected appreciation supports a ~$54k cash-out refi (75% LTV) — recoverable capital for the next deal without selling this one.
Negotiation context
- It's been on market 82 days — a 6% lower offer ($296k) is reasonable based on typical stale-listing flexibility.
- 2 sale attempts since 12y ago with the ask held roughly flat each time — persistent listings suggest the price (not the market) is what's stuck; bring a comps-based counter.
- Current owner paid $125k; list at $315k implies a 152% gain — meaningful room to come down on a strong offer.
Risks & watch-outs
- Climate carrying-cost: moderate wildfire risk; extreme-heat days projected 7→20/yr by 2055 (HVAC capex compounding) — expect insurance premiums to compound above CPI over the hold.
Questions for the listing agent
- What do current leases actually rent for vs. the listed asking? Can we see a recent rent roll and the last 12 months of T-12 income?
- It's been on market 82 days. Have you received any prior offers? Is the seller open to a 39% concession, seller financing, or rate buy-down credit?
- Why hasn't it sold? Are there any deal-killer items the seller is aware of (foundation, flood, title, zoning, code violations)?
- Is there a deadline driving the sale (1031 exchange, divorce, estate, relocation)? That informs how much negotiation room exists.
- Schools are A-rated — typically a magnet for longer-tenancy family renters. What's the average tenant stay here, and is there a school-zone premium baked into asking?
- The area grade is low — what's the realistic commute time and amenity access for the typical tenant pool here? Any planned neighborhood developments (good or bad) we should know about?
- What's the average days-on-market for RENTAL listings here right now (not sales)? A rising rental-DOM trend means longer vacancies and softer asking-rent achievability than the comps imply.
- What's the recent tenant-quality profile in this submarket — average credit score on applications, eviction rate, late-payment / NSF rate, and stable-employment percentage? A property-management company in the area should have these aggregated.
- How much new for-sale + rental construction is in the pipeline within 1–3 miles? Heavy new supply typically softens prices + rents 12–24 months out; constrained supply supports both.
Investment metrics
- 1% rule
- 0.61% ✗
- Cap rate
- 4.79%
- Cash-on-cash
- -5.35%
- DSCR
- 0.76
- GRM
- 13.6
CMA / ARV
- ARV (on-the-fly)
- $337,765
- Comps found
- 12
Show comp detail 12 sales within ~0.75 mi
| Address | Dist | Beds/Ba | Sqft | Sold | Price | $/sf | Match |
|---|---|---|---|---|---|---|---|
| 6403 SW Meadow Well Ave | 0.19mi | 4/2.0 | 1,500 (-4%) | 2mo | $304,000 | $203 | 82 |
| 6701 SW High Meadow Blvd | 0.32mi | 3/2.0 (-1) | 1,598 (+2%) | 1mo | $351,900 | $220 | 77 |
| 6405 SW Meadow Well Ave | 0.20mi | 3/2.0 (-1) | 1,438 (-8%) | 2mo | $284,500 | $198 | 70 |
| 6606 SW High Meadow Ave | 0.31mi | 3/2.0 (-1) | 1,674 (+7%) | 2mo | $359,900 | $215 | 68 |
| 6703 SW Basswood Ave | 0.36mi | 3/2.0 (-1) | 1,663 (+6%) | 2mo | $357,900 | $215 | 66 |
| 6704 SW Basswood Ave | 0.35mi | 3/2.0 (-1) | 1,674 (+7%) | 2mo | $359,900 | $215 | 66 |
| 6406 SW Meadow Well Ave | 0.20mi | 3/2.0 (-1) | 1,438 (-8%) | 9mo | $287,000 | $200 | 64 |
| 6806 SW Basswood Ave | 0.40mi | 3/2.0 (-1) | 1,750 (+11%) | 1mo | $379,900 | $217 | 57 |
| 6909 SW Orange Ave | 0.47mi | 3/2.0 (-1) | 1,750 (+11%) | 0mo | $379,900 | $217 | 54 |
| 6911 SW Orange Ave | 0.48mi | 3/2.0 (-1) | 1,757 (+12%) | 3mo | $365,000 | $208 | 50 |
| 6901 SW Orange Ave | 0.42mi | 3/2.0 (-1) | 1,756 (+12%) | 7mo | $383,200 | $218 | 50 |
| 6909 SW High Meadow Blvd | 0.47mi | 3/2.0 (-1) | 1,750 (+11%) | 7mo | $390,000 | $223 | 48 |
Match score weights: distance 35% · size 25% · config 20% · recency 20%. Top-matched comps best support the ARV.
Projected returns pro-forma
10.0% appreciation · 0.39% rent growth · sell at horizon
- IRR
- 19.9%
- Equity multiple
- 2.60×
- Total profit
- $141,444
- Equity at exit
- $283,777
- IRR
- 17.8%
- Equity multiple
- 5.84×
- Total profit
- $427,000
- Equity at exit
- $611,976
Cash invested: $88,200 (down + closing). Projections, not guarantees.
Landlord ↔ Tenant lean methodology
- Overall (STATE)
- 92 Strongly Landlord-Friendly
- State Arkansas
- 92 Strongly Landlord-Friendly · R+14
- County
- — inherits STATE
- City
- — inherits STATE
ZIP-level market 72713
- Home prices YoY
- 3.5%
- Rents YoY
- 0.4%
- Active inventory
- 710
- Price-to-rent
- 13.6×
Monthly cashflow live
- Estimated rent
- $1,925 high interval (Pro) →
- Mortgage (P&I)
- −$1,652
- Tax from tax record
- −$131 /mo · $1,571/yr
- Insurance
- −$131
- HOA
- −$0
- Vacancy / Maint / Mgmt
- −$404
- Net cashflow
- $-393
Break-even live
Sensitivity live
| Price | -10% $-215 | -5% $-304 | +0% $-393 | +5% $-483 | +10% $-572 |
|---|---|---|---|---|---|
| Rent | -10% $-545 | -5% $-469 | +0% $-393 | +5% $-317 | +10% $-241 |
| Rate | -1.0pp $-235 | -0.5pp $-313 | base $-393 | +0.5pp $-475 | +1.0pp $-558 |
UW: 25.0% down · 7.5% · 30yr · 1.5% tax · 5.0% vac · 8.0% maint · 8.0% mgmt
Financing live
Cash to close
- Down payment
- $78,750
- Closing costs
- $9,450
- Reserves months
- —
- Total cash needed
- —
Loan-product check · same deal, 3 products live
Conventional
25% down · 7.5% · 30yr
- Down + closing
- —
- Monthly P&I
- —
- Monthly cashflow
- —
- DSCR
- —
- Eligible?
- —
Personal DTI + credit; lowest rate.
DSCR
20% down · 8.5% · 30yr
- Down + closing
- —
- Monthly P&I
- —
- Monthly cashflow
- —
- DSCR
- —
- Eligible?
- —
No personal income docs; deal must DSCR.
Hard money
10% down · 12.0% · 12mo
- Down + closing
- —
- Monthly P&I
- —
- Monthly cashflow
- —
- DSCR
- —
- Eligible?
- —
Short-term bridge; refi at stabilization.
Rent comps 11 comps
| Address | Beds | Baths | Sqft | Rent | $/sqft | DOM | Units | Dist |
|---|---|---|---|---|---|---|---|---|
| 6708 SW Shady Rd Bentonville, AR | 4.0 | 2.0 | 1500 | $1,800 | $1.20 | 25d | 1 | 0.21mi |
| 6804 SW Chalkstone Rd Bentonville, AR | 4.0 | 2.0 | 1650 | $1,885 | $1.14 | 16d | 1 | 1.05mi |
| 6611 SW Warrington Rd Bentonville, AR | 3.0 | 2.0 | 1353 | $1,700 | $1.26 | 16d | 1 | 1.08mi |
| 7806 SW Aviator Ave Bentonville, AR | 1.0–3.0 | 1.0–2.0 | 1009 | $1,550 | $1.54 | 16d | 19 | 1.11mi |
| 4404 SW Sackett Ave Bentonville, AR | 3.0 | 2.0 | 1480 | $1,700 | $1.15 | 25d | 1 | 1.12mi |
| 4405 SW Sackett Ave Bentonville, AR | 3.0 | 2.0 | 1480 | $1,700 | $1.15 | 25d | 1 | 1.14mi |
| 6706 SW Whitmarsh Rd Bentonville, AR | 4.0 | 2.0 | 1657 | $1,695 | $1.02 | 23d | 1 | 1.16mi |
| 6000 SW Desert Ave Bentonville, AR | 3.0 | 2.0 | 1669 | $2,050 | $1.23 | 16d | 1 | 1.18mi |
| 4205 SW Lenox Ave Bentonville, AR | 4.0 | 2.0 | 1652 | $1,850 | $1.12 | 25d | 1 | 1.20mi |
| 6801 SW Chestnut Hill Rd Bentonville, AR | 4.0 | 2.0 | 1652 | $1,750 | $1.06 | 25d | 1 | 1.25mi |
| 5809 SW Macasin Ave Bentonville, AR | 4.0 | 2.0 | 1745 | $2,100 | $1.20 | 25d | 1 | 1.48mi |
Listing history 19 events
-
2026-06-22pricedays on market $315,000 Active 82 DOM
-
2026-06-18days on market $320,000 Active 79 DOM
-
2026-06-17days on market $320,000 Active 78 DOM
-
2026-06-15days on market $320,000 Active 76 DOM
-
2026-06-14days on market $320,000 Active 74 DOM
-
2026-06-10days on market $320,000 Active 71 DOM
-
2026-06-09days on market $320,000 Active 70 DOM
-
2026-06-08days on market $320,000 Active 69 DOM
-
2026-06-07days on market $320,000 Active 68 DOM
-
2026-06-05days on market $320,000 Active 65 DOM
-
2026-06-03days on market $320,000 Active 64 DOM
-
2026-06-02days on market $320,000 Active 63 DOM
-
2026-06-01days on market $320,000 Active 62 DOM
-
2026-05-31days on market $320,000 Active 61 DOM
-
2026-05-31days on market $320,000 Active 60 DOM
-
2026-03-31$320,000 Active
-
2014-07-17soldstatus $124,999
-
2014-07-15soldstatus $124,749 278-char remark
Show marketing remark (278 chars)
Check out this beautiful 4 bedroom home with large backyard. Bentonville schools. Features include open floor plan, split floor plan, wood burning fireplace, refrigerator, very well manicured yard and wood privacy fence. ,Recent updates include new carpet, flooring, and paint!!
-
2014-04-04$124,999 278-char remark
Show marketing remark (278 chars)
Check out this beautiful 4 bedroom home with large backyard. Bentonville schools. Features include open floor plan, split floor plan, wood burning fireplace, refrigerator, very well manicured yard and wood privacy fence. ,Recent updates include new carpet, flooring, and paint!!
ⓘ Source: listings_history table (triggers on properties + properties_extension) + one-shot
backfill from property_details.listing_events for pre-trigger history.
Tax reassessment forecast AR · Resets to sale price
- Current annual tax
- $1,571 · $131/mo
- Projected year-2 tax
- $2,016 · $168/mo
- Expected delta
- +$445/yr (+$37/mo · 28.3%)
ⓘ Screening estimate from a state-policy table — verify with the county assessor before closing.
Climate risk First Street
- Flood 1/10 Low FEMA zone X (unshaded) · 0% chance over 30 yrs
- Wildfire 5/10 Major
- Heat 5/10 Major 7 d/yr ≥106°F today · 20 d/yr by 30 yrs out
- Wind 2/10 Low 2% chance of damaging wind over 30 yrs
- Air quality 1/10 Low 0 unhealthy d/yr today · 0 by 30 yrs out
Nearby sold comps map
Loading sold comps map…
Walkable amenities ~0.75 mi
Loading nearby amenities…
Taxation est. · year 1
- Rental income
- $23,099
- − Mortgage interest
- −$17,645
- − Property taxes
- −$1,571
- − Insurance
- −$1,575
- − Repairs & maintenance
- −$1,848
- − Management
- −$1,848
- − Depreciation
- −$9,164
- Taxable loss
- −$10,551
- Est. tax savings @ 24.0%
- +$2,532
- After-tax cash flow
- $-2,188/yr
For passive investors: Depreciation is non-cash, so a rental often shows a tax loss while cash-flowing — sheltering income. Rental losses are passive: they offset passive income freely, and up to $25,000/yr can offset ordinary (W-2) income if you actively participate and your MAGI is under $100k (phasing out to $0 by $150k); unused losses carry forward. On sale, claimed depreciation is recaptured at up to 25%, and gains may owe capital-gains tax (a 1031 exchange can defer both). Figures are a year-1 estimate at your 24.0% rate — not tax advice; consult a CPA.
Schools (NCES district)
- District
- Bentonville School District
- NCES district ID
- 0503060
- Math proficiency
- 59% ▼ -8.00%
- Reading proficiency
- 59% ▼ -6.00%
- Median HH income
- $66,721
- Composite
- 51.85/100
- National rank
- #1661
- State rank
- #3 of 238 in AR
Livability — Bentonville
- Score
- 83/100
- State rank
- #2
- US rank
- #864
Category grades
Schools grade is shown separately in the Schools card above.
Census & demographics
- Census place
- Bentonville, AR
- County
- Benton County · 259,241 people
- City population
- 67,689
- Metro
- Fayetteville-Springdale-Rogers, AR
- Population (ZIP)
- 28,999
- Household income
- $119,853
- Rent vs Own
- Severe rent burden
- 508.0
Population outlook (Benton County) Hauer SSP2
- Today (2025)
- 318,683 people
- By 2030
- 353,481 · +10.9%
- By 2040
- 425,280 · +33.4%
- By 2050
- 497,239 · +56.0%
- By 2075
- 662,114 · +107.8%
- By 2100
- 776,431 · +143.6%
Race, ethnicity, and origin ACS 2023
- Neighborhood character
- Diverse neighborhood (Simpson 0.66)
- Race & ethnicity
- White 54% Asian 20% Two or more races 16% Hispanic / Latino 11% Black 3%
- Hispanic origin (detail)
- Mexican 8%
- Common ancestry
- Italian 2% Slovak 2% Romanian 1%
- Foreign-born
- 22% · Canada, China, Vietnam
- Languages at home
- 79% English-only · Other Asian/Pacific 8% Spanish 6% Other Indo-European 5%
Political lean MEDSL · Benton
- 2024 margin
- Strong R (+27.0) · D 35.2% · R 62.1% · Other 2.7%
- 2008→2024 swing
- +9.6pp toward D · 2008: -36.5pp · 2024: -27.0pp
- All cycles
- 2024: R+27.0 2020: R+26.4 2016: R+34.9 2012: R+40.4 2008: R+36.5
Not yet ingested
- Civics
- —
Market trends
- HPI YoY
- ▲ 10.77%
- Current HPI
- 319.3081
- Rent YoY
- ▲ 0.39%
- Metro
- Fayetteville-Springdale-Rogers, AR
- State GDP YoY
- ▲ 3.80%
- F500 in state
- 10
Industry mix (Fortune 500 HQ in AR)
| Industry | F500 HQs | Revenue |
|---|---|---|
| Retail | 1 | $681B |
|
||
| Food / Agriculture | 1 | $53B |
|
||
| Retail / Energy | 1 | $22B |
|
||
| Transportation / Logistics | 1 | $12B |
|
||
| Energy | 1 | $4B |
|
||
Price history
+156.0% since first listed4 events — show timeline
- 2026-03-31 Listed $320,000 NWARMLS
- 2014-07-17 Sold (Public Records) $124,999 Public Records
- 2014-07-15 Sold (MLS) $124,749 NWARMLS
- 2014-04-04 Listed $124,999 NWARMLS
Property tax history
+3.2%/yrLatest (2025): $1,571 · +0.9% YoY. Source: county tax records.
Cash-flow waterfall
monthlySold comps — $/sqft
last 12 mo · ≤1 miLoading sold comps…