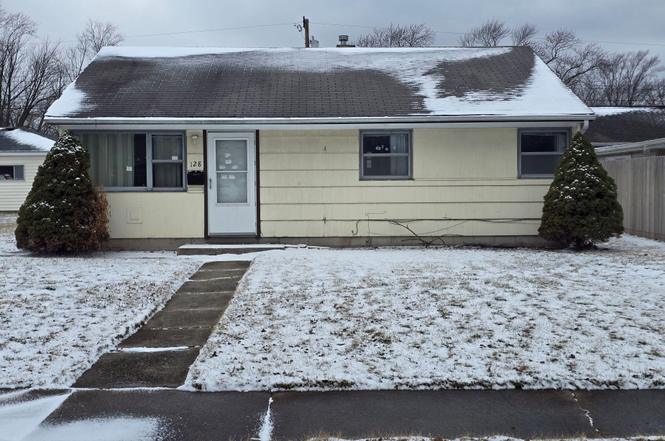
128 N Guyer St · Hobart, IN
Flood risk 1/10 · Minimal
- FEMA flood zone
- X (unshaded)
- Chance of flooding over 30 yrs
- 0.0%
- Est. flood insurance / yr
- $507 – $1,088
Fire risk 3/10 · Minor
- Est. fire insurance / yr
- $717 – $1,331
Heat risk 2/10 · Minimal
- Hot days now (above 102°F)
- 7 days/yr
- Hot days in 30 yrs
- 15 days/yr
Wind risk 2/10 · Minimal
- Chance of severe wind over 30 yrs
- —
Air-quality risk 3/10 · Minor
- Unhealthy air days now
- 2 days/yr
- Unhealthy air days in 30 yrs
- 3 days/yr
Risk factors via First Street. Map © Google.
Why this score? — see what drove the C grade
The composite is a weighted blend of 9 inputs, each scored 0–100. Each bar is that input's sub-score; the figure is the points it added to the 100-point composite (weight × sub-score).
- Cash flow +19.6/30.0
- ARV discount +15.0/15.0
- DSCR +6.2/10.0
- 1% rule +4.8/10.0
- Rent growth +3.9/5.0
- Livability +3.5/5.0
- Schools +3.3/10.0
- Condition / age +2.5/5.0
- Appreciation +0.0/10.0
$143,000
🖨 Deal sheet (PDF) 📄 Offer letter ✓ Due diligence
Listing remarks
Bring your Handy Hands and some Cash to make this one an excellent addition to your portfolio of rental properties or Flip it!! 3 bedroom ranch with one bath. 372 square feet of attached space can be a garage or converted to living space, your choice. This one is a fixer upper and a SHORT SALE (the bank must approve your offer after the seller does). Property has been winterized and utilities have been off since 2024 so an electric inspection will be needed before utilities can be turned on. Listed at 2022 price so could be a great buy for you!! Cash Offers Only.
Key facts
- 6,098 sq ft lot
- 2 garage spots
- Built 1955
Property features AI
Finance
- Other: Vacant occupant status
Exterior
- Parking: Rear-facing garage; 2-car garage; Paved parking and on-street parking available
- Utilities: Public water; Public sewer; Natural gas connected; Electricity connected (100 amp service); Cable available
- Home design: One-story property; Built in 1955; Fixer condition
- Construction: Other construction materials; Slab foundation; Shallow year: 1955
- Exterior features: Neighborhood view; Back yard fencing; Paved road access; Alley access
Interior
- Kitchen: No appliances listed
- Bedrooms: Primary bedroom; Two additional bedrooms
- Bathrooms: 1 full bathroom
- Heating & cooling: Forced-air heating (natural gas); No cooling
- Interior features: No notable interior features listed; 7 total rooms including living room, dining room, kitchen, primary bedroom, two additional bedrooms, bathroom, and bonus room
- Laundry & utility: Main-level laundry
Neighborhood map
What this means for you Summary
Snapshot
- This is a 3-bed/1.0-bath single-family listed at $143k.
Deal economics
- At list price, monthly cash flow is $164 ($2k/yr) — positive.
- The deal already cash-flows at list — no discount required.
- To meet the 1% rule (rent ≥ 1% of price), the offer needs to be $140k (2.0% below list).
- Recommended offer: $130k (9.0% below list) — sets the bar for market timing.
- Cap rate 7.7% vs local median 4.2% in Hobart — top-decile yield for the area; either an underpriced asset or a hidden risk that comps aren't pricing in. Stress-test before assuming the spread holds.
Location & tenants
- Location reads 69/100 on livability (#196 in IN) — a middle-class / working-renter tenant base. Strengths: cost of living A+, housing A+, crime B; Watch: amenities F, commute F, health & safety D-.
- School City Of Hobart (suburban): math 30% / reading 45% proficiency, ranked #161 of 301 in IN (top 54%) — families likely to look elsewhere, expect single-tenant / working-renter base with shorter leases.
- Zoned schools: Joan Martin Elementary School (math 43% / reading 42%, grade F, #425 of 994 statewide, top 44%, 501 students, 45% FRL); Hobart Middle School (math 23% / reading 42%, grade F, #186 of 330 statewide, top 57%, 917 students, 54% FRL); Hobart High School (math 25% / reading 65%, grade D-, #166 of 369 statewide, top 45%, 1,306 students, 48% FRL).
- Market conditions: Rents rising fast (+5.6%/yr); 261 active listings in the ZIP; 5 comparable units currently listed for rent nearby; rentals leasing fast (median 0d on market — plan ~1-2 weeks tenant-placement turnaround); solid renter incomes; 1,642 units permitted in Lake County in 2024 (14 in 5+ unit buildings).
Forward outlook
- Local home prices are declining (-3.0%/yr); year-one equity from $989 of loan paydown is wiped out by about $4k of value loss. Plan a longer hold.
- Lake County population projected to shrink 7% by 2050 — rents likely to lag national; underwrite the cash flow, not the appreciation.
Negotiation context
- It's been on market 98 days — a 9% lower offer ($130k) is reasonable based on typical stale-listing flexibility.
- 3 sale attempts since 7y ago with the ask held roughly flat each time — persistent listings suggest the price (not the market) is what's stuck; bring a comps-based counter.
Risks & watch-outs
- Watch-outs: built in 1955 — expect roof / HVAC / electrical / plumbing capex.
Questions for the listing agent
- It's been on market 98 days. Have you received any prior offers? Is the seller open to a 9% concession, seller financing, or rate buy-down credit?
- Built in 1955 — when were the roof, HVAC, electrical panel, plumbing, and water heater last replaced?
- Why hasn't it sold? Are there any deal-killer items the seller is aware of (foundation, flood, title, zoning, code violations)?
- Is there a deadline driving the sale (1031 exchange, divorce, estate, relocation)? That informs how much negotiation room exists.
- Schools are D-rated, which usually means shorter tenancies and higher turnover. Who's the typical renter profile here, and what's been the actual vacancy rate?
- What's the average days-on-market for RENTAL listings here right now (not sales)? A rising rental-DOM trend means longer vacancies and softer asking-rent achievability than the comps imply.
- What's the recent tenant-quality profile in this submarket — average credit score on applications, eviction rate, late-payment / NSF rate, and stable-employment percentage? A property-management company in the area should have these aggregated.
- How much new for-sale + rental construction is in the pipeline within 1–3 miles? Heavy new supply typically softens prices + rents 12–24 months out; constrained supply supports both.
Investment metrics
- 1% rule
- 0.98% ✗
- Cap rate
- 7.67%
- Cash-on-cash
- 4.92%
- DSCR
- 1.22
- GRM
- 8.5
CMA / ARV
- ARV (on-the-fly)
- $199,200
- Comps found
- 12
Show comp detail 12 sales within ~0.75 mi
| Address | Dist | Beds/Ba | Sqft | Sold | Price | $/sf | Match |
|---|---|---|---|---|---|---|---|
| 1337 W Cleveland Ave | 0.22mi | 3/1.0 | 1,008 (+1%) | 4mo | $223,500 | $222 | 84 |
| 30 N Delaware St | 0.26mi | 2/1.0 (-1) | 1,000 (+0%) | 0mo | $189,500 | $190 | 82 |
| 1236 W Cleveland Ave | 0.21mi | 2/1.0 (-1) | 1,015 (+2%) | 3mo | $185,000 | $182 | 79 |
| 308 N Wilson St | 0.20mi | 3/1.0 | 1,049 (+5%) | 3mo | $160,000 | $153 | 79 |
| 220 S Delaware St | 0.45mi | 3/1.0 | 960 (-4%) | 5mo | $203,000 | $211 | 69 |
| 400 N Virginia St | 0.39mi | 3/1.0 | 924 (-7%) | 2mo | $205,000 | $222 | 68 |
| 1322 W 1st Pl | 0.26mi | 3/1.0 | 875 (-12%) | 0mo | $189,000 | $216 | 67 |
| 1330 W 1st Pl | 0.26mi | 3/1.0 | 875 (-12%) | 1mo | $175,000 | $200 | 67 |
| 1209 W 1st Pl | 0.32mi | 3/1.0 | 875 (-12%) | 2mo | $156,000 | $178 | 63 |
| 121 S Wisconsin St | 0.51mi | 3/1.0 | 1,138 (+14%) | 3mo | $160,000 | $141 | 49 |
| 1001 W 38th Ave | 0.71mi | 2/1.0 (-1) | 904 (-9%) | 1mo | $180,000 | $199 | 46 |
| 233 S Washington St | 0.65mi | 2/1.5 (-1) | 1,107 (+11%) | 6mo | $256,500 | $232 | 40 |
Match score weights: distance 35% · size 25% · config 20% · recency 20%. Top-matched comps best support the ARV.
Projected returns pro-forma
-3.0% appreciation · 5.63% rent growth · sell at horizon
- IRR
- -5.8%
- Equity multiple
- 0.78×
- Total profit
- $-8,921
- Equity at exit
- $21,322
- IRR
- 6.6%
- Equity multiple
- 1.55×
- Total profit
- $22,141
- Equity at exit
- $12,364
Cash invested: $40,040 (down + closing). Projections, not guarantees.
Landlord ↔ Tenant lean methodology
- Overall (STATE)
- 90 Strongly Landlord-Friendly
- State Indiana
- 90 Strongly Landlord-Friendly · R+11
- County
- — inherits STATE
- City
- — inherits STATE
ZIP-level market 46342
- Rents YoY
- 5.6%
- Active inventory
- 261
- Price-to-rent
- 8.5×
Monthly cashflow live
- Estimated rent
- $1,401 high interval (Pro) →
- Mortgage (P&I)
- −$750
- Tax from tax record
- −$133 /mo · $1,598/yr
- Insurance
- −$60
- HOA
- −$0
- Vacancy / Maint / Mgmt
- −$294
- Net cashflow
- $164
Break-even live
Sensitivity live
| Price | -10% $245 | -5% $205 | +0% $164 | +5% $124 | +10% $83 |
|---|---|---|---|---|---|
| Rent | -10% $53 | -5% $109 | +0% $164 | +5% $219 | +10% $275 |
| Rate | -1.0pp $236 | -0.5pp $200 | base $164 | +0.5pp $127 | +1.0pp $89 |
UW: 25.0% down · 7.5% · 30yr · 1.5% tax · 5.0% vac · 8.0% maint · 8.0% mgmt
Financing live
Cash to close
- Down payment
- $35,750
- Closing costs
- $4,290
- Reserves months
- —
- Total cash needed
- —
Loan-product check · same deal, 3 products live
Conventional
25% down · 7.5% · 30yr
- Down + closing
- —
- Monthly P&I
- —
- Monthly cashflow
- —
- DSCR
- —
- Eligible?
- —
Personal DTI + credit; lowest rate.
DSCR
20% down · 8.5% · 30yr
- Down + closing
- —
- Monthly P&I
- —
- Monthly cashflow
- —
- DSCR
- —
- Eligible?
- —
No personal income docs; deal must DSCR.
Hard money
10% down · 12.0% · 12mo
- Down + closing
- —
- Monthly P&I
- —
- Monthly cashflow
- —
- DSCR
- —
- Eligible?
- —
Short-term bridge; refi at stabilization.
Rent comps 5 comps
| Address | Beds | Baths | Sqft | Rent | $/sqft | DOM | Units | Dist |
|---|---|---|---|---|---|---|---|---|
| 905 W 37th Ave Unit 48 Hobart, IN | 2.0 | 1.0 | 1000 | $1,200 | $1.20 | 45d | 1 | 0.87mi |
| 3612 Michigan St Unit 2nd Fl Hobart, IN | 3.0 | 1.0 | 675 | $925 | $1.37 | 17d | 1 | 0.92mi |
| 333 Neringa Ln Hobart, IN | 1.0–3.0 | 1.0–2.0 | 1009 | $1,780 | $1.76 | 0d | 11 | 1.10mi |
| 215 East St Unit 3 Hobart, IN | 2.0 | 1.0 | 850 | $1,350 | $1.59 | 0d | 1 | 1.33mi |
| 669 Lake St Unit 1 Hobart, IN | 2.0 | 1.0 | 849 | $1,150 | $1.35 | 0d | 1 | 1.41mi |
Listing history 10 events
-
2026-06-04status $143,000 Pending 98 DOM
-
2026-06-03days on market $143,000 Active 98 DOM
-
2026-06-02days on market $143,000 Active 97 DOM
-
2026-06-01days on market $143,000 Active 96 DOM
-
2026-05-31days on market $143,000 Active 95 DOM
-
2026-05-08status Active
-
2026-03-10historical Active Under Contract
-
2026-02-25$143,000 Active
-
2019-12-02historical
-
2019-07-01$110,000
ⓘ Source: listings_history table (triggers on properties + properties_extension) + one-shot
backfill from property_details.listing_events for pre-trigger history.
Tax reassessment forecast IN · Partial reset (capped growth)
- Current annual tax
- $1,598 · $133/mo
- Projected year-2 tax
- $1,598 · $133/mo
- Expected delta
- $0/yr ($0/mo · 0.0%)
ⓘ Screening estimate from a state-policy table — verify with the county assessor before closing.
Climate risk First Street
- Flood 1/10 Low FEMA zone X (unshaded) · 0% chance over 30 yrs
- Wildfire 3/10 Moderate
- Heat 2/10 Low 7 d/yr ≥102°F today · 15 d/yr by 30 yrs out
- Wind 2/10 Low
- Air quality 3/10 Moderate 2 unhealthy d/yr today · 3 by 30 yrs out
Nearby sold comps map
Loading sold comps map…
Walkable amenities ~0.75 mi
Loading nearby amenities…
Taxation est. · year 1
- Rental income
- $16,812
- − Mortgage interest
- −$8,010
- − Property taxes
- −$1,598
- − Insurance
- −$715
- − Repairs & maintenance
- −$1,345
- − Management
- −$1,345
- − Depreciation
- −$4,160
- Taxable loss
- −$361
- Est. tax savings @ 24.0%
- +$87
- After-tax cash flow
- $2,056/yr
For passive investors: Depreciation is non-cash, so a rental often shows a tax loss while cash-flowing — sheltering income. Rental losses are passive: they offset passive income freely, and up to $25,000/yr can offset ordinary (W-2) income if you actively participate and your MAGI is under $100k (phasing out to $0 by $150k); unused losses carry forward. On sale, claimed depreciation is recaptured at up to 25%, and gains may owe capital-gains tax (a 1031 exchange can defer both). Figures are a year-1 estimate at your 24.0% rate — not tax advice; consult a CPA.
Schools (NCES district)
- District
- School City Of Hobart
- NCES district ID
- 1804590
- Math proficiency
- 30% ▼ -14.00%
- Reading proficiency
- 45% ▼ -7.00%
- Median HH income
- $55,967
- Composite
- 32.93/100
- National rank
- #5594
- State rank
- #161 of 301 in IN
Livability — Hobart
- Score
- 69/100
- State rank
- #196
- US rank
- #8834
Category grades
Schools grade is shown separately in the Schools card above.
Census & demographics
- Census place
- Hobart, IN
- County
- Lake County · 422,878 people
- City population
- 32,224
- Metro
- Chicago-Naperville-Elgin, IL-IN-WI
- Population (ZIP)
- 32,224
- Household income
- $75,521
- Rent vs Own
- Severe rent burden
- 1033.0
Population outlook (Lake County) Hauer SSP2
- Today (2025)
- 484,026 people
- By 2030
- 478,091 · -1.2%
- By 2040
- 462,974 · -4.3%
- By 2050
- 449,894 · -7.1%
- By 2075
- 436,169 · -9.9%
- By 2100
- 426,607 · -11.9%
Race, ethnicity, and origin ACS 2023
- Neighborhood character
- Predominantly White (66%)
- Race & ethnicity
- White 66% Hispanic / Latino 21% Two or more races 10% Black 10% Asian 1%
- Hispanic origin (detail)
- Mexican 15% Puerto Rican 5%
- Common ancestry
- Romanian 11% Iranian 2% Lithuanian 1%
- Foreign-born
- 5% · Canada, China
- Languages at home
- 87% English-only · Spanish 9% Russian/Polish/Slavic 2% Chinese 1%
Political lean MEDSL · Lake
- 2024 margin
- Lean D (+5.6) · D 52.1% · R 46.5% · Other 1.5%
- 2008→2024 swing
- -28.6pp toward R · 2008: 34.3pp · 2024: 5.6pp
- All cycles
- 2024: D+5.6 2020: D+15.1 2016: D+20.6 2012: D+31.0 2008: D+34.3
Not yet ingested
- Civics
- —
Market trends
- HPI YoY
- ▼ -167.01%
- Current HPI
- 260.2635
- Rent YoY
- ▲ 5.63%
- Metro
- Chicago-Naperville-Elgin, IL-IN-WI
- State GDP YoY
- ▲ 2.90%
- F500 in state
- 18
Industry mix (Fortune 500 HQ in IN)
| Industry | F500 HQs | Revenue |
|---|---|---|
| Industrial Machinery | 2 | $37B |
|
||
| Healthcare | 1 | $177B |
|
||
| Pharmaceuticals | 1 | $45B |
|
||
| Metals / Steel | 1 | $18B |
|
||
| Agriculture | 1 | $17B |
|
||
| Packaging | 1 | $12B |
|
||
Price history
+30.0% since first listed5 events — show timeline
- 2026-05-08 Relisted — NIRA MLS as Distributed by MLS Grid
- 2026-03-10 Contingent — NIRA MLS as Distributed by MLS Grid
- 2026-02-25 Listed $143,000 NIRA MLS as Distributed by MLS Grid
- 2019-12-02 Listing Removed — NIRA MLS as Distributed by MLS Grid
- 2019-07-01 Listed $110,000 NIRA MLS as Distributed by MLS Grid
Property tax history
+4.0%/yrLatest (2024): $1,598 · +1.9% YoY. Source: county tax records.
Cash-flow waterfall
monthlySold comps — $/sqft
last 12 mo · ≤1 miLoading sold comps…