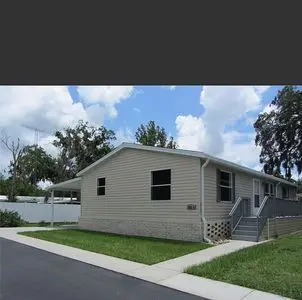
10720 Sturbridge Ct · Moon Lake, FL
Flood risk 1/10 · Minimal
- FEMA flood zone
- X (unshaded)
- Chance of flooding over 30 yrs
- 0.0%
- Est. flood insurance / yr
- $507 – $1,088
Fire risk 4/10 · Minor
- Est. fire insurance / yr
- $947 – $1,759
Heat risk 10/10 · Severe
- Hot days now (above 108°F)
- 7 days/yr
- Hot days in 30 yrs
- 25 days/yr
Wind risk 10/10 · Severe
- Chance of severe wind over 30 yrs
- 99.0%
Air-quality risk 2/10 · Minimal
- Unhealthy air days now
- 1 days/yr
- Unhealthy air days in 30 yrs
- 3 days/yr
Risk factors via First Street. Map © Google.
Why this score? — see what drove the B- grade
The composite is a weighted blend of 9 inputs, each scored 0–100. Each bar is that input's sub-score; the figure is the points it added to the 100-point composite (weight × sub-score).
- Cash flow +30.0/30.0
- 1% rule +10.0/10.0
- DSCR +10.0/10.0
- ARV discount +7.5/15.0
- Schools +4.3/10.0
- Livability +2.8/5.0
- Condition / age +2.5/5.0
- Rent growth +2.0/5.0
- Appreciation +0.0/10.0
$59,900
🖨 Deal sheet (PDF) 📄 Offer letter ✓ Due diligence
Listing remarks
MOVE IN READY FOR YOUR YEAR ROUND HOME OR YOUR WINTER HOME. BAYONET POINT VILLAGE IS AN ACTIVE 55+ COMMUNITY. THERE IS A COMMUNITY POOL, SHUFFLEBOARD WITH A CLUBHOUSE AND HANDICAP ACCESS BATHROOMS. GOLF CARTS ALLOWED WITH PLENTY OF SPACE TO PARK IT IN THE CARPORT. THIS SPACIOUS OPEN FLOOR PLAN IS A 3 BEDROOM, 2 BATH HOME AT THE END OF A QUIET STREET. THE HOME HAS BEEN PLACED ON A FULL SLAB OF CONCRETE NOT JUST THE PERIMETER OF THE HOME. THE HOME COMES WITH A LARGE WORKSHOP WITH ELECTRICITY OR IT CAN BE USED AS A STORAGE ROOM. NEW A/C UNIT AS OF AUGUST 2023. WATER SOFTENER SYSTEM IN PLACE. ORIGINAL SHINGLED ROOF. FLORIDA ROOM WITH CABLE AND PLENTY OF WINDOWS. NEW CARPETING IN LIVING ROOM &am
Key facts
- Clubhouse
- Community pool
- Golf carts allowed
Tags
Property features AI
Exterior
- Home design: Built in 2015; Single-family home (coop association)
- Construction: Living area approximately 1404
- Exterior features: Located in the Bayonet Point Village Co-op community
Neighborhood map
What this means for you Summary
Snapshot
- This is a 3-bed/2.0-bath manufactured listed at $60k.
Deal economics
- At list price, monthly cash flow is $1k ($14k/yr) — positive.
- The deal already cash-flows at list — no discount required.
- Meets the 1% rule at list price ($2k rent vs $60k).
- Recommended offer: $59k (1.5% below list) — sets the bar for market timing.
- Cap rate 30.4% vs local median 4.4% in Moon Lake — top-decile yield for the area; either an underpriced asset or a hidden risk that comps aren't pricing in. Stress-test before assuming the spread holds.
Location & tenants
- Location reads 56/100 on livability (#871 in FL) — a working-class tenant base; expect higher turnover. Strengths: cost of living A+, housing A+; Watch: schools F, amenities F, commute F.
- Pasco (suburban): math 50% / reading 52% proficiency, ranked #32 of 73 in FL (top 44%) — acceptable for families but not a draw, mixed tenant base, ~2y average lease.
- Market conditions: Rents soft (-1.9%/yr); 360 active listings in the ZIP; 9 comparable units currently listed for rent nearby; rentals at typical pace (median 26d on market — plan ~3-4 weeks tenant-placement turnaround); 6,765 units permitted in Pasco County in 2024 (1,250 in 5+ unit buildings).
- This rent runs 35% of the median local income ($74k/yr) — at the standard rent-burdened threshold; future hikes will face affordability resistance.
Forward outlook
- Local home prices are declining (-3.0%/yr); year-one equity from $414 of loan paydown is wiped out by about $2k of value loss. Plan a longer hold.
- Pasco County population projected at +29% by 2050 — long-run rental-demand tailwind backs the buy-and-hold thesis.
- At projected returns (-3.0% appreciation + 0.0% rent growth), your $17k cash investment doubles in ~2 years — after that, you're playing with house money.
Negotiation context
- It's been on market 23 days — a 2% lower offer ($59k) is reasonable based on typical stale-listing flexibility.
- 3 sale attempts since 2y ago with the ask held roughly flat each time — persistent listings suggest the price (not the market) is what's stuck; bring a comps-based counter.
Risks & watch-outs
- Watch-outs: property tax is 3.7% of price.
- Climate carrying-cost: severe wind risk, 99% chance of damaging wind over 30y; extreme-heat days projected 7→25/yr by 2055 (HVAC capex compounding) — expect insurance premiums to compound above CPI over the hold.
Questions for the listing agent
- Property tax is high relative to price — has the assessment been appealed recently, and will the sale trigger a re-assessment?
- Is there a deadline driving the sale (1031 exchange, divorce, estate, relocation)? That informs how much negotiation room exists.
- Schools are F-rated, which usually means shorter tenancies and higher turnover. Who's the typical renter profile here, and what's been the actual vacancy rate?
- What's the average days-on-market for RENTAL listings here right now (not sales)? A rising rental-DOM trend means longer vacancies and softer asking-rent achievability than the comps imply.
- What's the recent tenant-quality profile in this submarket — average credit score on applications, eviction rate, late-payment / NSF rate, and stable-employment percentage? A property-management company in the area should have these aggregated.
- How much new for-sale + rental construction is in the pipeline within 1–3 miles? Heavy new supply typically softens prices + rents 12–24 months out; constrained supply supports both.
Investment metrics
- 1% rule
- 3.65% ✓
- Cap rate
- 30.38%
- Cash-on-cash
- 86.03%
- DSCR
- 4.83
- GRM
- 2.3
CMA / ARV
- ARV (on-the-fly)
- $280,800
- Comps found
- 2
Show comp detail 2 sales within ~0.75 mi
| Address | Dist | Beds/Ba | Sqft | Sold | Price | $/sf | Match |
|---|---|---|---|---|---|---|---|
| 11801 Bruin Dr | 0.28mi | 3/2.0 | 1,512 (+8%) | 3mo | $280,000 | $185 | 72 |
| 10741 Pomelo Ct | 0.05mi | 3/2.0 | 1,200 (-14%) | 10mo | $240,000 | $200 | 65 |
Match score weights: distance 35% · size 25% · config 20% · recency 20%. Top-matched comps best support the ARV.
Projected returns pro-forma
-3.0% appreciation · 0.0% rent growth · sell at horizon
- IRR
- 82.9%
- Equity multiple
- 4.61×
- Total profit
- $60,580
- Equity at exit
- $8,931
- IRR
- 85.4%
- Equity multiple
- 8.57×
- Total profit
- $127,044
- Equity at exit
- $5,179
Cash invested: $16,772 (down + closing). Projections, not guarantees.
Landlord ↔ Tenant lean methodology
- Overall (STATE)
- 87 Strongly Landlord-Friendly
- State Florida
- 87 Strongly Landlord-Friendly · R+3
- County
- — inherits STATE
- City
- — inherits STATE
ZIP-level market 34654
- Home prices YoY
- -12.7%
- Rents YoY
- -1.9%
- Active inventory
- 360
- Price-to-rent
- 2.3×
Monthly cashflow live
- Estimated rent
- $2,184 high interval (Pro) →
- Mortgage (P&I)
- −$314
- Tax from tax record
- −$183 /mo · $2,201/yr
- Insurance
- −$25
- HOA
- −$0
- Vacancy / Maint / Mgmt
- −$459
- Net cashflow
- $1,202
Break-even live
Sensitivity live
| Price | -10% $1,236 | -5% $1,219 | +0% $1,202 | +5% $1,186 | +10% $1,169 |
|---|---|---|---|---|---|
| Rent | -10% $1,030 | -5% $1,116 | +0% $1,202 | +5% $1,289 | +10% $1,375 |
| Rate | -1.0pp $1,233 | -0.5pp $1,218 | base $1,202 | +0.5pp $1,187 | +1.0pp $1,171 |
UW: 25.0% down · 7.5% · 30yr · 1.5% tax · 5.0% vac · 8.0% maint · 8.0% mgmt
Financing live
Cash to close
- Down payment
- $14,975
- Closing costs
- $1,797
- Reserves months
- —
- Total cash needed
- —
Loan-product check · same deal, 3 products live
Conventional
25% down · 7.5% · 30yr
- Down + closing
- —
- Monthly P&I
- —
- Monthly cashflow
- —
- DSCR
- —
- Eligible?
- —
Personal DTI + credit; lowest rate.
DSCR
20% down · 8.5% · 30yr
- Down + closing
- —
- Monthly P&I
- —
- Monthly cashflow
- —
- DSCR
- —
- Eligible?
- —
No personal income docs; deal must DSCR.
Hard money
10% down · 12.0% · 12mo
- Down + closing
- —
- Monthly P&I
- —
- Monthly cashflow
- —
- DSCR
- —
- Eligible?
- —
Short-term bridge; refi at stabilization.
Rent comps 9 comps
| Address | Beds | Baths | Sqft | Rent | $/sqft | DOM | Units | Dist |
|---|---|---|---|---|---|---|---|---|
| 12065 Grizzly Ln New Port Richey, FL | 3.0 | 2.5 | 1440 | $2,200 | $1.53 | 19d | 1 | 1.14mi |
| 12245 Grizzly Ln New Port Richey, FL | 3.0 | 2.5 | 1207 | $2,280 | $1.89 | 25d | 1 | 1.15mi |
| 12250 Grizzly Ln New Port Richey, FL | 3.0 | 2.5 | 1632 | $2,200 | $1.35 | 25d | 1 | 1.16mi |
| 11920 Palm Bay Ct New Port Richey, FL | 3.0 | 2.0 | 1770 | $2,100 | $1.19 | 19d | 1 | 1.17mi |
| 11920 Palm Bay Ct New Port Richey, FL | 3.0 | 2.0 | 1770 | $2,100 | $1.19 | 13d | 1 | 1.17mi |
| 12316 Grizzly Ln New Port Richey, FL | 3.0 | 2.5 | 1632 | $2,150 | $1.32 | 4d | 1 | 1.22mi |
| 9444 Bourbon St Unit 12 New Port Richey, FL | 3.0 | 2.0 | 1152 | $1,875 | $1.63 | 25d | 1 | 1.30mi |
| 11550 Baywood Meadows Dr #7 New Port Richey, FL | 2.0 | 1.0 | 1008 | $1,495 | $1.48 | 25d | 1 | 1.36mi |
| 12135 Environmental Dr #4 New Port Richey, FL | 3.0 | 2.0 | 1239 | $1,800 | $1.45 | 25d | 1 | 1.40mi |
Listing history 21 events
-
2026-06-18days on market $59,900 Active 23 DOM
-
2026-06-17days on market $59,900 Active 22 DOM
-
2026-06-16days on market $59,900 Active 21 DOM
-
2026-06-15days on market $59,900 Active 20 DOM
-
2026-06-13days on market $59,900 Active 18 DOM
-
2026-06-09days on market $59,900 Active 14 DOM
-
2026-06-08days on market $59,900 Active 13 DOM
-
2026-06-07days on market $59,900 Active 12 DOM
-
2026-06-04days on market $59,900 Active 9 DOM
-
2026-06-03days on market $59,900 Active 8 DOM
-
2026-06-02days on market $59,900 Active 7 DOM
-
2026-06-01days on market $59,900 Active 6 DOM
-
2026-05-31days on market $59,900 Active 5 DOM
-
2026-05-26$59,900 Active
-
2025-02-11historical
-
2025-01-16price $193,500
-
2024-11-21price $195,000
-
2024-11-06status Active
-
2024-10-31status Pending
-
2024-09-24price $199,999
-
2024-08-07$205,000 Active
ⓘ Source: listings_history table (triggers on properties + properties_extension) + one-shot
backfill from property_details.listing_events for pre-trigger history.
Tax reassessment forecast FL · Resets to sale price
- Current annual tax
- $2,201 · $183/mo
- Projected year-2 tax
- $2,201 · $183/mo
- Expected delta
- $0/yr ($0/mo · 0.0%)
ⓘ Screening estimate from a state-policy table — verify with the county assessor before closing.
Climate risk First Street
- Flood 1/10 Low FEMA zone X (unshaded) · 0% chance over 30 yrs
- Wildfire 4/10 Moderate
- Heat 10/10 Extreme 7 d/yr ≥108°F today · 25 d/yr by 30 yrs out
- Wind 10/10 Extreme 99% chance of damaging wind over 30 yrs
- Air quality 2/10 Low 1 unhealthy d/yr today · 3 by 30 yrs out
Nearby sold comps map
Loading sold comps map…
Walkable amenities ~0.75 mi
Loading nearby amenities…
Taxation est. · year 1
- Rental income
- $26,202
- − Mortgage interest
- −$3,355
- − Property taxes
- −$2,201
- − Insurance
- −$300
- − Repairs & maintenance
- −$2,096
- − Management
- −$2,096
- − Depreciation
- −$1,743
- Taxable income
- $14,411
- Est. tax owed @ 24.0%
- −$3,459
- After-tax cash flow
- $10,971/yr
For passive investors: Depreciation is non-cash, so a rental often shows a tax loss while cash-flowing — sheltering income. Rental losses are passive: they offset passive income freely, and up to $25,000/yr can offset ordinary (W-2) income if you actively participate and your MAGI is under $100k (phasing out to $0 by $150k); unused losses carry forward. On sale, claimed depreciation is recaptured at up to 25%, and gains may owe capital-gains tax (a 1031 exchange can defer both). Figures are a year-1 estimate at your 24.0% rate — not tax advice; consult a CPA.
Schools (NCES district)
- District
- Pasco
- NCES district ID
- 1201530
- Math proficiency
- 50% ▼ -10.00%
- Reading proficiency
- 52% ▼ -5.00%
- Median HH income
- $45,039
- Composite
- 43.14/100
- National rank
- #3074
- State rank
- #32 of 73 in FL
Livability — Moon Lake
- Score
- 56/100
- State rank
- #871
- US rank
- #22850
Category grades
Schools grade is shown separately in the Schools card above.
Census & demographics
- County
- Pasco County · 524,098 people
- Metro
- Tampa-St. Petersburg-Clearwater, FL
- Population (ZIP)
- 24,355
- Household income
- $73,947
- Rent vs Own
- Severe rent burden
- 179.0
Population outlook (Pasco County) Hauer SSP2
- Today (2025)
- 570,045 people
- By 2030
- 605,844 · +6.3%
- By 2040
- 674,806 · +18.4%
- By 2050
- 736,022 · +29.1%
- By 2075
- 862,900 · +51.4%
- By 2100
- 906,364 · +59.0%
Race, ethnicity, and origin ACS 2023
- Neighborhood character
- Predominantly White (81%)
- Race & ethnicity
- White 81% Hispanic / Latino 10% Two or more races 7% Black 3% Asian 2%
- Hispanic origin (detail)
- Puerto Rican 6%
- Common ancestry
- Romanian 4% Slovak 2% Italian 2%
- Foreign-born
- 7% · Canada, China, Jamaica
- Languages at home
- 88% English-only · Spanish 5% Russian/Polish/Slavic 2% Other Indo-European 1%
Political lean MEDSL · Pasco
- 2024 margin
- Strong R (+25.2) · D 36.9% · R 62.1% · Other 1.0%
- 2008→2024 swing
- -21.6pp toward R · 2008: -3.6pp · 2024: -25.2pp
- All cycles
- 2024: R+25.2 2020: R+20.1 2016: R+21.6 2012: R+6.7 2008: R+3.6
Not yet ingested
- Civics
- —
Market trends
- HPI YoY
- ▼ -42.63%
- Current HPI
- 294.4358
- Rent YoY
- ▼ -1.85%
- Metro
- Tampa-St. Petersburg-Clearwater, FL
- State GDP YoY
- ▲ 3.28%
- F500 in state
- 36
Industry mix (Fortune 500 HQ in FL)
| Industry | F500 HQs | Revenue |
|---|---|---|
| Industrial Technology | 2 | $29B |
|
||
| Insurance | 2 | $17B |
|
||
| Retail | 1 | $60B |
|
||
| Technology Distribution | 1 | $58B |
|
||
| Homebuilding | 1 | $35B |
|
||
| Technology Manufacturing | 1 | $35B |
|
||
Price history
-70.8% since first listed8 events — show timeline
- 2026-05-26 Listed $59,900 FSBO.com
- 2025-02-11 Listing Removed — Stellar MLS as Distributed by MLS Grid
- 2025-01-16 Price Changed $193,500 Stellar MLS as Distributed by MLS Grid
- 2024-11-21 Price Changed $195,000 Stellar MLS as Distributed by MLS Grid
- 2024-11-06 Relisted — Stellar MLS as Distributed by MLS Grid
- 2024-10-31 Pending — Stellar MLS as Distributed by MLS Grid
- 2024-09-24 Price Changed $199,999 Stellar MLS as Distributed by MLS Grid
- 2024-08-07 Listed $205,000 Stellar MLS as Distributed by MLS Grid
Property tax history
+17.6%/yrLatest (2025): $2,201 · +0.6% YoY. Source: county tax records.
Cash-flow waterfall
monthlySold comps — $/sqft
last 12 mo · ≤1 miLoading sold comps…