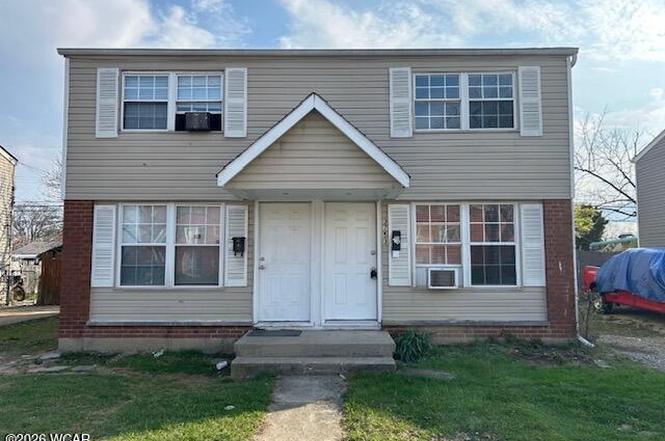
 Duplex
3751-3753 Briggs Rd · Columbus, OH
Flood risk 1/10 · Minimal
- FEMA flood zone
- X (unshaded)
- Chance of flooding over 30 yrs
- 0.0%
- Est. flood insurance / yr
- $473 – $860
Fire risk 1/10 · Minimal
- Est. fire insurance / yr
- $713 – $1,323
Heat risk 4/10 · Minor
- Hot days now (above 102°F)
- 7 days/yr
- Hot days in 30 yrs
- 18 days/yr
Wind risk 2/10 · Minimal
- Chance of severe wind over 30 yrs
- 1.0%
Air-quality risk 2/10 · Minimal
- Unhealthy air days now
- 1 days/yr
- Unhealthy air days in 30 yrs
- 2 days/yr
Risk factors via First Street. Map © Google.
Why this score? — see what drove the B- grade
The composite is a weighted blend of 9 inputs, each scored 0–100. Each bar is that input's sub-score; the figure is the points it added to the 100-point composite (weight × sub-score).
- Cash flow +27.7/30.0
- ARV discount +10.6/15.0
- DSCR +9.7/10.0
- 1% rule +7.3/10.0
- Livability +4.0/5.0
- Condition / age +2.5/5.0
- Rent growth +2.3/5.0
- Schools +1.7/10.0
- Appreciation +0.0/10.0
$189,900
🖨 Deal sheet (PDF) 📄 Offer letter ✓ Due diligence
Multi-family units
County records classify this as Multi-Family (2-4 Unit). Listing-text estimate: 2 units. confirmed
Listing remarks
This side-by-side two-story duplex with 2 bedroom, 1 bath units, stainless appliances and off-street parking has one tenant on a long term lease and one side occupant ready. Currently registered as a rental, if re-registered as an owner-occupied property, it would qualify for a tax credit. Walk-able to Franklin Heights High School and near all other amenities of Columbus's Southwest side. Investors can cash flow from day one with this property.
Key facts
- Stainless appliances
- Off-street parking
- 6,000 sq ft lot
Tags
Property features AI
Finance
- Financial info: Annual taxes listed
Exterior
- Parking: Off-street parking
- Utilities: Public water; Public sewer; Electricity connected; Natural gas available; Cable available; Water connected
- Home design: Multi-family residential property; Two levels
- Construction: Vinyl siding; Block foundation
- Exterior features: Lot roughly 50 x 120; Residential zoning
Interior
- Bathrooms: 2 full bathrooms
- Heating & cooling: Central air conditioning; Natural gas heating
- Interior features: Full basement with concrete construction
Neighborhood map
What this means for you Summary
Snapshot
- This is a 2 × 2-bed/1.0-bath units multifamily listed at $190k.
Deal economics
- At list price, monthly cash flow is $572 ($7k/yr) — positive. Per door: $286/mo.
- The deal already cash-flows at list — no discount required.
- Meets the 1% rule at list price ($2k rent vs $190k).
- Cap rate 9.9% vs local median 3.8% in Columbus — top-decile yield for the area; either an underpriced asset or a hidden risk that comps aren't pricing in. Stress-test before assuming the spread holds.
Location & tenants
- Location reads 81/100 on livability (#97 in OH, #1,491 nationally) — a professional / high-income tenant draw. Strengths: commute A+, cost of living A+, housing A+; Watch: employment C-, crime F.
- Columbus City School District (urban): math 15% / reading 26% proficiency, ranked #626 of 656 in OH (top 95%) — low school quality limits family demand, transient renter base, plan for 1-2y turnover; 72% free/reduced lunch — lower-income household profile, screen leases tightly.
- Market conditions: Rents soft (-0.6%/yr); 192 active listings in the ZIP; 13 comparable units currently listed for rent nearby; rentals leasing fast (median 13d on market — plan ~1-2 weeks tenant-placement turnaround); 8,139 units permitted in Franklin County in 2024 (5,940 in 5+ unit buildings).
- At $2,343/mo this rent would consume 46% of the median local household income ($62k/yr) (locally 3284% of renters already pay >50% of income on rent) — very limited rent-growth headroom before tenants either downsize or default.
Forward outlook
- Local home prices are declining (-3.0%/yr); year-one equity from $1k of loan paydown is wiped out by about $6k of value loss. Plan a longer hold.
- Franklin County population projected at +34% by 2050 — long-run rental-demand tailwind backs the buy-and-hold thesis.
Negotiation context
- Only 8 days on market — expect competitive offers; lowballing is unlikely to land.
- Current owner paid $150k; 27% above their basis — modest negotiation headroom, anchor on the comps not their cost.
Questions for the listing agent
- Can we see the unit-by-unit rent roll, current vacancy, and any below-market leases? What's the average tenancy length?
- What capital expenditures (roof, boiler, parking lot, exteriors) have been made in the last 5 years, and what's planned in the next 2?
- Built in 1963 — when were the roof, HVAC, electrical panel, plumbing, and water heater last replaced?
- Is there a deadline driving the sale (1031 exchange, divorce, estate, relocation)? That informs how much negotiation room exists.
- Crime grade is F in this area — have there been break-ins, vandalism, or insurance claims at this property in the last 3 years? What carrier currently insures it and at what premium?
- What's the average days-on-market for RENTAL listings here right now (not sales)? A rising rental-DOM trend means longer vacancies and softer asking-rent achievability than the comps imply.
- What's the recent tenant-quality profile in this submarket — average credit score on applications, eviction rate, late-payment / NSF rate, and stable-employment percentage? A property-management company in the area should have these aggregated.
- How much new apartment / multifamily construction is in the pipeline within 1–3 miles? Heavy new supply (>2% of stock underway) typically softens rents 12–24 months out; light construction supports rent growth.
Investment metrics
- 1% rule
- 1.23% ✓
- Cap rate
- 9.90%
- Cash-on-cash
- 12.90%
- DSCR
- 1.57
- GRM
- 6.8
CMA / ARV
- ARV (on-the-fly)
- $203,840
- Comps found
- 11
Show comp detail 11 sales within ~0.75 mi
| Address | Dist | Beds/Ba | Sqft | Sold | Price | $/sf | Match |
|---|---|---|---|---|---|---|---|
| 3721 Briggs Rd | 0.05mi | 4/— | 1,568 (0%) | 4mo | $176,500 | $113 | 95 |
| 3727-3729 Briggs Rd | 0.04mi | 4/— | 1,568 (0%) | 5mo | $155,000 | $99 | 94 |
| 3703-3705 Briggs Rd | 0.07mi | 4/— | 1,568 (0%) | 15mo | $140,000 | $89 | 84 |
| 885-887 Derrer Rd | 0.34mi | 5/— (+1) | 1,667 (+6%) | 11mo | $230,000 | $138 | 60 |
| 1123-1125 Mccarley Dr W | 0.32mi | 4/— | 1,688 (+8%) | 16mo | $248,000 | $147 | 59 |
| 639 Derrer Rd | 0.53mi | 4/— | 1,684 (+7%) | 4mo | $145,000 | $86 | 59 |
| 3614 Eakin Rd | 0.34mi | 5/— (+1) | 1,673 (+7%) | 14mo | $207,000 | $124 | 57 |
| 886 Derrer Rd | 0.37mi | 5/— (+1) | 1,667 (+6%) | 17mo | $216,900 | $130 | 53 |
| 4034 Halsey Pl | 0.62mi | 4/— | 1,696 (+8%) | 5mo | $250,000 | $147 | 53 |
| 3468 Race St | 0.56mi | 4/— | 1,706 (+9%) | 13mo | $265,000 | $155 | 48 |
| 3476-3478 Race St | 0.56mi | 4/— | 1,706 (+9%) | 15mo | $245,000 | $144 | 47 |
Match score weights: distance 35% · size 25% · config 20% · recency 20%. Top-matched comps best support the ARV.
Projected returns pro-forma
-3.0% appreciation · 0.0% rent growth · sell at horizon
- IRR
- -0.6%
- Equity multiple
- 0.98×
- Total profit
- $-1,218
- Equity at exit
- $28,315
- IRR
- 5.7%
- Equity multiple
- 1.36×
- Total profit
- $19,342
- Equity at exit
- $16,419
Cash invested: $53,172 (down + closing). Projections, not guarantees.
Landlord ↔ Tenant lean methodology
- Overall (STATE)
- 73 Landlord-Friendly
- State Ohio
- 73 Landlord-Friendly · R+6
- County
- — inherits STATE
- City
- — inherits STATE
ZIP-level market 43228
- Rents YoY
- -0.6%
- Active inventory
- 192
- Price-to-rent
- 13.5×
Monthly cashflow live
- Estimated rent
- $2,343 high interval (Pro) →
- Mortgage (P&I)
- −$996
- Tax from tax record
- −$204 /mo · $2,453/yr
- Insurance
- −$79
- HOA
- −$0
- Vacancy / Maint / Mgmt
- −$492
- Net cashflow
- $572
Break-even live
Sensitivity live
| Price | -10% $679 | -5% $625 | +0% $572 | +5% $518 | +10% $464 |
|---|---|---|---|---|---|
| Rent | -10% $386 | -5% $479 | +0% $572 | +5% $664 | +10% $757 |
| Rate | -1.0pp $667 | -0.5pp $620 | base $572 | +0.5pp $522 | +1.0pp $472 |
2-unit breakdown (identical units grouped — click to expand)
| Units | Beds | Baths | Est. rent |
|---|---|---|---|
| 2× units | 2 | 1 | $2,342 |
| #1 | 2 | 1 | $1,171 |
| #2 | 2 | 1 | $1,171 |
| Total (2 units) | $2,343 | ||
UW: 25.0% down · 7.5% · 30yr · 1.5% tax · 5.0% vac · 8.0% maint · 8.0% mgmt
Financing live
Cash to close
- Down payment
- $47,475
- Closing costs
- $5,697
- Reserves months
- —
- Total cash needed
- —
Loan-product check · same deal, 3 products live
Conventional
25% down · 7.5% · 30yr
- Down + closing
- —
- Monthly P&I
- —
- Monthly cashflow
- —
- DSCR
- —
- Eligible?
- —
Personal DTI + credit; lowest rate.
DSCR
20% down · 8.5% · 30yr
- Down + closing
- —
- Monthly P&I
- —
- Monthly cashflow
- —
- DSCR
- —
- Eligible?
- —
No personal income docs; deal must DSCR.
Hard money
10% down · 12.0% · 12mo
- Down + closing
- —
- Monthly P&I
- —
- Monthly cashflow
- —
- DSCR
- —
- Eligible?
- —
Short-term bridge; refi at stabilization.
Rent comps 13 comps
| Address | Beds | Baths | Sqft | Rent | $/sqft | DOM | Units | Dist |
|---|---|---|---|---|---|---|---|---|
| 1369 Greenock Rd Columbus, OH | 4.0 | 2.5 | 1680 | $2,031 | $1.21 | 24d | 1 | 0.67mi |
| 1241 Riegelwood Ln Columbus, OH | 4.0 | 3.0 | 1868 | $2,480 | $1.33 | 2d | 1 | 0.77mi |
| 3735 Gairlock Dr Columbus, OH | 3.0 | 2.0 | 1329 | $1,905 | $1.43 | 24d | 1 | 0.78mi |
| 1634 Golden Cloud Ln Columbus, OH | 3.0 | 2.0 | 2015 | $2,101 | $1.04 | 44d | 1 | 1.01mi |
| 1433 Tall Meadows Dr Columbus, OH | 3.0 | 1.5 | 1428 | $1,995 | $1.40 | 13d | 1 | 1.05mi |
| 4510 Switchback Trl Columbus, OH | 3.0 | 2.0 | 1244 | $2,170 | $1.74 | 5d | 1 | 1.12mi |
| 4573 Westport Rd Unit 4507-303 Columbus, OH | 4.0 | 2.0 | 1558 | $1,897 | $1.22 | 44d | 1 | 1.22mi |
| 4573 Westport Rd Unit 670-106 Columbus, OH | 3.0 | 1.5 | 1095 | $1,417 | $1.29 | 44d | 1 | 1.22mi |
| 4573 Westport Rd Unit 4507-107 Columbus, OH | 3.0 | 1.5 | 1095 | $1,417 | $1.29 | 13d | 1 | 1.22mi |
| 4573 Westport Rd Unit 4567-101 Columbus, OH | 3.0 | 1.5 | 1095 | $1,701 | $1.55 | 44d | 1 | 1.22mi |
| 4312 Westport Rd Columbus, OH | 2.0–3.0 | 1.5–2.5 | 1476 | $1,499 | $1.02 | 2d | 21 | 1.23mi |
| 1551 Covina Dr Columbus, OH | 3.0 | 2.0 | 1218 | $2,205 | $1.81 | 2d | 1 | 1.27mi |
| 1602 Covina Dr Columbus, OH | 4.0 | 2.5 | 1808 | $2,450 | $1.36 | 11d | 1 | 1.32mi |
Listing history 7 events
-
2026-06-18days on market $189,900 Active 8 DOM
-
2026-06-17days on market $189,900 Active 7 DOM
-
2026-06-16days on market $189,900 Active 6 DOM
-
2026-06-15days on market $189,900 Active 5 DOM
-
2026-06-13days on market $189,900 Active 3 DOM
-
2026-06-13remarks 448-char remark
-
2026-06-13$189,900 Active 2 DOM
ⓘ Source: listings_history table (triggers on properties + properties_extension) + one-shot
backfill from property_details.listing_events for pre-trigger history.
Tax reassessment forecast OH · Partial reset (capped growth)
- Current annual tax
- $2,453 · $204/mo
- Projected year-2 tax
- $2,708 · $226/mo
- Expected delta
- +$255/yr (+$21/mo · 10.4%)
ⓘ Screening estimate from a state-policy table — verify with the county assessor before closing.
Climate risk First Street
- Flood 1/10 Low FEMA zone X (unshaded) · 0% chance over 30 yrs
- Wildfire 1/10 Low
- Heat 4/10 Moderate 7 d/yr ≥102°F today · 18 d/yr by 30 yrs out
- Wind 2/10 Low 100% chance of damaging wind over 30 yrs
- Air quality 2/10 Low 1 unhealthy d/yr today · 2 by 30 yrs out
Nearby sold comps map
Loading sold comps map…
Walkable amenities ~0.75 mi
Loading nearby amenities…
Taxation est. · year 1
- Rental income
- $28,116
- − Mortgage interest
- −$10,637
- − Property taxes
- −$2,453
- − Insurance
- −$950
- − Repairs & maintenance
- −$2,249
- − Management
- −$2,249
- − Depreciation
- −$5,524
- Taxable income
- $4,054
- Est. tax owed @ 24.0%
- −$973
- After-tax cash flow
- $5,886/yr
For passive investors: Depreciation is non-cash, so a rental often shows a tax loss while cash-flowing — sheltering income. Rental losses are passive: they offset passive income freely, and up to $25,000/yr can offset ordinary (W-2) income if you actively participate and your MAGI is under $100k (phasing out to $0 by $150k); unused losses carry forward. On sale, claimed depreciation is recaptured at up to 25%, and gains may owe capital-gains tax (a 1031 exchange can defer both). Figures are a year-1 estimate at your 24.0% rate — not tax advice; consult a CPA.
Schools (NCES district)
- District
- Columbus City School District
- NCES district ID
- 3904380
- Math proficiency
- 15% ▼ -17.00%
- Reading proficiency
- 26% ▼ -12.00%
- Median HH income
- $38,483
- Composite
- 17.19/100
- National rank
- #9105
- State rank
- #626 of 656 in OH
Livability — Columbus
- Score
- 81/100
- State rank
- #97
- US rank
- #1491
Category grades
Schools grade is shown separately in the Schools card above.
Census & demographics
- Census place
- Columbus, OH
- County
- Franklin County · 1,351,780 people
- City population
- 612,189
- Metro
- Columbus, OH
- Population (ZIP)
- 59,077
- Household income
- $61,713
- Rent vs Own
- Severe rent burden
- 3284.0
Population outlook (Franklin County) Hauer SSP2
- Today (2025)
- 1,456,139 people
- By 2030
- 1,556,890 · +6.9%
- By 2040
- 1,757,349 · +20.7%
- By 2050
- 1,950,539 · +34.0%
- By 2075
- 2,376,171 · +63.2%
- By 2100
- 2,636,796 · +81.1%
Race, ethnicity, and origin ACS 2023
- Neighborhood character
- Diverse neighborhood (Simpson 0.64)
- Race & ethnicity
- White 54% Black 23% Hispanic / Latino 14% Two or more races 11% Asian 3%
- Hispanic origin (detail)
- Mexican 8% Dominican 1%
- Common ancestry
- Slovak 2% Italian 1% Romanian 1%
- Foreign-born
- 19% · Canada, Jamaica
- Languages at home
- 74% English-only · Spanish 12% Other Indo-European 1% Other Asian/Pacific 1%
Political lean MEDSL · Franklin
- 2024 margin
- Strong D (+28.4) · D 63.7% · R 35.3% · Other 1.0%
- 2008→2024 swing
- +7.7pp toward D · 2008: 20.7pp · 2024: 28.4pp
- All cycles
- 2024: D+28.4 2020: D+31.4 2016: D+25.9 2012: D+21.7 2008: D+20.7
Not yet ingested
- Civics
- —
Market trends
- HPI YoY
- ▼ -245.97%
- Current HPI
- 234.1992
- Rent YoY
- ▼ -0.63%
- Metro
- Columbus, OH
- State GDP YoY
- ▲ 1.98%
- F500 in state
- 48
Industry mix (Fortune 500 HQ in OH)
| Industry | F500 HQs | Revenue |
|---|---|---|
| Insurance | 3 | $145B |
|
||
| Industrial Machinery | 3 | $49B |
|
||
| Financial Services | 3 | $24B |
|
||
| Consumer Goods | 2 | $93B |
|
||
| Aerospace / Defense | 2 | $47B |
|
||
| Utilities | 2 | $33B |
|
||
Price history
+381.2% since first listed6 events — show timeline
- 2026-06-10 Listed $189,900 WCARE
- 2024-04-09 Sold (Public Records) $150,000 Public Records
- 2019-12-04 Sold (Public Records) $90,900 Public Records
- 1999-03-23 Sold (Public Records) $49,000 Public Records
- 1986-06-03 Sold (Public Records) $46,511 Public Records
- 1984-03-01 Sold (Public Records) $39,463 Public Records
Property tax history
+5.8%/yrLatest (2024): $2,453 · +1.3% YoY. Source: county tax records.
Cash-flow waterfall
monthlySold comps — $/sqft
last 12 mo · ≤1 miLoading sold comps…