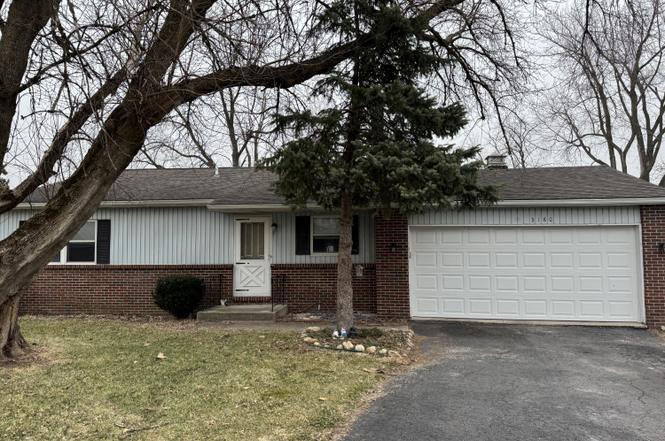
3180 Eastwind Ct · Lakes of the Four Seasons, IN
Flood risk 1/10 · Minimal
- FEMA flood zone
- X (unshaded)
- Chance of flooding over 30 yrs
- 0.0%
- Est. flood insurance / yr
- $507 – $1,088
Fire risk 3/10 · Minor
- Est. fire insurance / yr
- $717 – $1,331
Heat risk 2/10 · Minimal
- Hot days now (above 100°F)
- 7 days/yr
- Hot days in 30 yrs
- 16 days/yr
Wind risk 2/10 · Minimal
- Chance of severe wind over 30 yrs
- —
Air-quality risk 2/10 · Minimal
- Unhealthy air days now
- 1 days/yr
- Unhealthy air days in 30 yrs
- 1 days/yr
Risk factors via First Street. Map © Google.
Why this score? — see what drove the D- grade
The composite is a weighted blend of 9 inputs, each scored 0–100. Each bar is that input's sub-score; the figure is the points it added to the 100-point composite (weight × sub-score).
- Cash flow +10.9/30.0
- ARV discount +6.2/15.0
- Schools +5.0/10.0
- 1% rule +4.3/10.0
- Livability +3.5/5.0
- DSCR +3.2/10.0
- Rent growth +3.1/5.0
- Condition / age +2.5/5.0
- Appreciation +0.0/10.0
$229,900
🖨 Deal sheet (PDF) 📄 Offer letter ✓ Due diligence
Listing remarks
Discover the potential in this 3 bed, 2 bath ranch home, perfectly situated on a quiet, private cul de sac backing up to Windy Hill Park. Enjoy peaceful surroundings from the screened in porch and the spacious layout inside. Key Features: Cathedral ceilings with a wood beam , Large primary bedroom with an attached 3/4 bath All bedrooms include double closets Good sized Main bath Built in 1985 on a crawl space Attached, insulated, and drywalled 2 car garage Newer garage door, opener, and furnace With a some TLC, this home can truly shine. Enjoy Resort like living in The Lakes of the Four Seasons! Four lakes, including one all sports lake Beaches and pavilions, Boating, jet skis, paddle boa
Key facts
- Screened in porch
- Attached garage
- Cul de sac
Tags
Neighborhood map
What this means for you Summary
Snapshot
- This is a 3-bed/1.0-bath single-family listed at $230k.
Deal economics
- At list price, monthly cash flow is $-102 ($-1k/yr) — negative.
- To cash-flow at today's rent, offer at most $212k (7.8% below list).
- To meet the 1% rule (rent ≥ 1% of price), the offer needs to be $215k (6.5% below list).
- Recommended offer: $212k (7.8% below list) — sets the bar for cash-flow.
- Cap rate 5.8% vs local median 3.4% in Lakes of the Four Seasons — top-decile yield for the area; either an underpriced asset or a hidden risk that comps aren't pricing in. Stress-test before assuming the spread holds.
Location & tenants
- Location reads 69/100 on livability (#190 in IN) — a middle-class / working-renter tenant base. Strengths: crime A+, employment A+, housing A+; Watch: amenities F, commute F, health & safety D-.
- Crown Point Community School Corporation (suburban): math 51% / reading 61% proficiency, ranked #23 of 301 in IN (top 8%) — acceptable for families but not a draw, mixed tenant base, ~2y average lease; only 18% free/reduced lunch — higher-income household profile.
- Zoned schools: Jerry Ross Elementary School (math 68% / reading 65%, grade B+, #65 of 994 statewide, top 7%, 524 students, 20% FRL); Colonel John Wheeler Middle School (math 39% / reading 53%, grade D+, #76 of 330 statewide, top 23%, 1,046 students, 24% FRL); Crown Point High School (math 51% / reading 80%, grade B, #29 of 369 statewide, top 8%, 2,948 students, 22% FRL) — zoned schools at 22% FRL track the district average.
- Market conditions: Rents rising (+2.5%/yr); 753 active listings in the ZIP; 2 comparable units currently listed for rent nearby; solid renter incomes; 1,642 units permitted in Lake County in 2024 (14 in 5+ unit buildings).
Forward outlook
- Local home prices are declining (-3.0%/yr); year-one equity from $2k of loan paydown is wiped out by about $7k of value loss. Plan a longer hold.
- Lake County population projected to shrink 7% by 2050 — rents likely to lag national; underwrite the cash flow, not the appreciation.
Negotiation context
- It's been on market 25 days — a 2% lower offer ($226k) is reasonable based on typical stale-listing flexibility.
Questions for the listing agent
- What do current leases actually rent for vs. the listed asking? Can we see a recent rent roll and the last 12 months of T-12 income?
- What does the HOA fee cover, when was the last increase, and are there any pending special assessments or reserve-fund shortfalls?
- Is there a deadline driving the sale (1031 exchange, divorce, estate, relocation)? That informs how much negotiation room exists.
- Schools are D-rated, which usually means shorter tenancies and higher turnover. Who's the typical renter profile here, and what's been the actual vacancy rate?
- The area grade is low — what's the realistic commute time and amenity access for the typical tenant pool here? Any planned neighborhood developments (good or bad) we should know about?
- What's the average days-on-market for RENTAL listings here right now (not sales)? A rising rental-DOM trend means longer vacancies and softer asking-rent achievability than the comps imply.
- What's the recent tenant-quality profile in this submarket — average credit score on applications, eviction rate, late-payment / NSF rate, and stable-employment percentage? A property-management company in the area should have these aggregated.
- How much new for-sale + rental construction is in the pipeline within 1–3 miles? Heavy new supply typically softens prices + rents 12–24 months out; constrained supply supports both.
Investment metrics
- 1% rule
- 0.93% ✗
- Cap rate
- 5.76%
- Cash-on-cash
- -1.90%
- DSCR
- 0.92
- GRM
- 8.9
CMA / ARV
- ARV (on-the-fly)
- $223,488
- Comps found
- 3
Show comp detail 3 sales within ~0.75 mi
| Address | Dist | Beds/Ba | Sqft | Sold | Price | $/sf | Match |
|---|---|---|---|---|---|---|---|
| 3180 Eastwind Ct | 0.00mi | 3/2.0 | 1,152 (0%) | 1mo | $196,430 | $171 | 96 |
| 3794 Kingsway Dr | 0.50mi | 3/1.5 | 1,248 (+8%) | 5mo | $242,000 | $194 | 57 |
| 3783 Kingsway Dr | 0.57mi | 3/2.0 | 1,286 (+12%) | 6mo | $255,000 | $198 | 45 |
Match score weights: distance 35% · size 25% · config 20% · recency 20%. Top-matched comps best support the ARV.
Projected returns pro-forma
-3.0% appreciation · 2.53% rent growth · sell at horizon
- IRR
- -20.0%
- Equity multiple
- 0.31×
- Total profit
- $-44,601
- Equity at exit
- $34,279
- IRR
- -13.9%
- Equity multiple
- 0.21×
- Total profit
- $-50,659
- Equity at exit
- $19,878
Cash invested: $64,372 (down + closing). Projections, not guarantees.
Landlord ↔ Tenant lean methodology
- Overall (STATE)
- 90 Strongly Landlord-Friendly
- State Indiana
- 90 Strongly Landlord-Friendly · R+11
- County
- — inherits STATE
- City
- — inherits STATE
ZIP-level market 46307
- Rents YoY
- 2.5%
- Active inventory
- 753
- Price-to-rent
- 8.9×
Monthly cashflow live
- Estimated rent
- $2,149 medium interval (Pro) →
- Mortgage (P&I)
- −$1,206
- Tax from tax record
- −$344 /mo · $4,128/yr
- Insurance
- −$96
- HOA
- −$154
- Vacancy / Maint / Mgmt
- −$451
- Net cashflow
- $-102
Break-even live
Sensitivity live
| Price | -10% $28 | -5% $-37 | +0% $-102 | +5% $-167 | +10% $-232 |
|---|---|---|---|---|---|
| Rent | -10% $-272 | -5% $-187 | +0% $-102 | +5% $-17 | +10% $68 |
| Rate | -1.0pp $14 | -0.5pp $-44 | base $-102 | +0.5pp $-162 | +1.0pp $-222 |
UW: 25.0% down · 7.5% · 30yr · 1.5% tax · 5.0% vac · 8.0% maint · 8.0% mgmt
Financing live
Cash to close
- Down payment
- $57,475
- Closing costs
- $6,897
- Reserves months
- —
- Total cash needed
- —
Loan-product check · same deal, 3 products live
Conventional
25% down · 7.5% · 30yr
- Down + closing
- —
- Monthly P&I
- —
- Monthly cashflow
- —
- DSCR
- —
- Eligible?
- —
Personal DTI + credit; lowest rate.
DSCR
20% down · 8.5% · 30yr
- Down + closing
- —
- Monthly P&I
- —
- Monthly cashflow
- —
- DSCR
- —
- Eligible?
- —
No personal income docs; deal must DSCR.
Hard money
10% down · 12.0% · 12mo
- Down + closing
- —
- Monthly P&I
- —
- Monthly cashflow
- —
- DSCR
- —
- Eligible?
- —
Short-term bridge; refi at stabilization.
Rent comps 2 comps
| Address | Beds | Baths | Sqft | Rent | $/sqft | DOM | Units | Dist |
|---|---|---|---|---|---|---|---|---|
| 3788 Kingsway Dr Crown Point, IN | 3.0 | 2.0 | 1300 | $2,350 | $1.81 | 2d | 1 | 0.56mi |
| 160 Meadows Cir Unit 160 Crown Point, IN | 2.0 | 2.0 | 900 | $1,395 | $1.55 | 44d | 1 | 1.03mi |
HOA detail
- Monthly dues
- $154 · $1,848/yr
Listing history 3 events
-
2026-03-29status Pending
-
2026-03-12price $229,900
-
2026-03-04$255,000 Active
ⓘ Source: listings_history table (triggers on properties + properties_extension) + one-shot
backfill from property_details.listing_events for pre-trigger history.
Tax reassessment forecast IN · Partial reset (capped growth)
- Current annual tax
- $4,128 · $344/mo
- Projected year-2 tax
- $4,128 · $344/mo
- Expected delta
- $0/yr ($0/mo · 0.0%)
ⓘ Screening estimate from a state-policy table — verify with the county assessor before closing.
Climate risk First Street
- Flood 1/10 Low FEMA zone X (unshaded) · 0% chance over 30 yrs
- Wildfire 3/10 Moderate
- Heat 2/10 Low 7 d/yr ≥100°F today · 16 d/yr by 30 yrs out
- Wind 2/10 Low
- Air quality 2/10 Low 1 unhealthy d/yr today · 1 by 30 yrs out
Nearby sold comps map
Loading sold comps map…
Walkable amenities ~0.75 mi
Loading nearby amenities…
Taxation est. · year 1
- Rental income
- $25,783
- − Mortgage interest
- −$12,878
- − Property taxes
- −$4,128
- − Insurance
- −$1,150
- − Repairs & maintenance
- −$2,063
- − Management
- −$2,063
- − HOA
- −$1,848
- − Depreciation
- −$6,688
- Taxable loss
- −$5,034
- Est. tax savings @ 24.0%
- +$1,208
- After-tax cash flow
- $-16/yr
For passive investors: Depreciation is non-cash, so a rental often shows a tax loss while cash-flowing — sheltering income. Rental losses are passive: they offset passive income freely, and up to $25,000/yr can offset ordinary (W-2) income if you actively participate and your MAGI is under $100k (phasing out to $0 by $150k); unused losses carry forward. On sale, claimed depreciation is recaptured at up to 25%, and gains may owe capital-gains tax (a 1031 exchange can defer both). Figures are a year-1 estimate at your 24.0% rate — not tax advice; consult a CPA.
Schools (NCES district)
- District
- Crown Point Community School Corporation
- NCES district ID
- 1802490
- Math proficiency
- 51% ▼ -9.00%
- Reading proficiency
- 61% ▼ -8.00%
- Median HH income
- $69,148
- Composite
- 49.55/100
- National rank
- #1990
- State rank
- #23 of 301 in IN
Livability — Lakes of the Four Seasons
- Score
- 69/100
- State rank
- #190
- US rank
- #8734
Category grades
Schools grade is shown separately in the Schools card above.
Census & demographics
- Census place
- Lakes of the Four Seasons, IN
- County
- Lake County · 422,878 people
- Metro
- Chicago-Naperville-Elgin, IL-IN-WI
- Population (ZIP)
- 71,673
- Household income
- $107,800
- Rent vs Own
- Severe rent burden
- 705.0
Population outlook (Lake County) Hauer SSP2
- Today (2025)
- 484,026 people
- By 2030
- 478,091 · -1.2%
- By 2040
- 462,974 · -4.3%
- By 2050
- 449,894 · -7.1%
- By 2075
- 436,169 · -9.9%
- By 2100
- 426,607 · -11.9%
Race, ethnicity, and origin ACS 2023
- Neighborhood character
- Predominantly White (76%)
- Race & ethnicity
- White 76% Hispanic / Latino 12% Two or more races 10% Black 7% Asian 2%
- Hispanic origin (detail)
- Mexican 9% Puerto Rican 1%
- Common ancestry
- Romanian 12% Iranian 3% Lithuanian 2%
- Foreign-born
- 7% · Canada, Vietnam
- Languages at home
- 88% English-only · Spanish 5% Russian/Polish/Slavic 3% Other Indo-European 1%
Political lean MEDSL · Lake
- 2024 margin
- Lean D (+5.6) · D 52.1% · R 46.5% · Other 1.5%
- 2008→2024 swing
- -28.6pp toward R · 2008: 34.3pp · 2024: 5.6pp
- All cycles
- 2024: D+5.6 2020: D+15.1 2016: D+20.6 2012: D+31.0 2008: D+34.3
Not yet ingested
- Civics
- —
Market trends
- HPI YoY
- ▼ -164.91%
- Current HPI
- 226.0335
- Rent YoY
- ▲ 2.53%
- Metro
- Chicago-Naperville-Elgin, IL-IN-WI
- State GDP YoY
- ▲ 2.90%
- F500 in state
- 18
Industry mix (Fortune 500 HQ in IN)
| Industry | F500 HQs | Revenue |
|---|---|---|
| Industrial Machinery | 2 | $37B |
|
||
| Healthcare | 1 | $177B |
|
||
| Pharmaceuticals | 1 | $45B |
|
||
| Metals / Steel | 1 | $18B |
|
||
| Agriculture | 1 | $17B |
|
||
| Packaging | 1 | $12B |
|
||
Price history
-9.8% since first listed3 events — show timeline
- 2026-03-29 Pending — NIRA MLS as Distributed by MLS Grid
- 2026-03-12 Price Changed $229,900 NIRA MLS as Distributed by MLS Grid
- 2026-03-04 Listed $255,000 NIRA MLS as Distributed by MLS Grid
Property tax history
+3.9%/yrLatest (2024): $4,128 · +5.5% YoY. Source: county tax records.
Cash-flow waterfall
monthlySold comps — $/sqft
last 12 mo · ≤1 miLoading sold comps…