11509 Spicewood Ln · Houston, TX
Flood risk 5/10 · Moderate
- FEMA flood zone
- AE
- Chance of flooding over 30 yrs
- 0.24%
- Est. flood insurance / yr
- $1,737 – $8,500
Fire risk 4/10 · Minor
- Est. fire insurance / yr
- $1,222 – $2,270
Heat risk 9/10 · Severe
- Hot days now (above 110°F)
- 7 days/yr
- Hot days in 30 yrs
- 25 days/yr
Wind risk 9/10 · Severe
- Chance of severe wind over 30 yrs
- 99.0%
Air-quality risk 2/10 · Minimal
- Unhealthy air days now
- 2 days/yr
- Unhealthy air days in 30 yrs
- 2 days/yr
Risk factors via First Street. Map © Google.
Why this score? — see what drove the B+ grade
The composite is a weighted blend of 9 inputs, each scored 0–100. Each bar is that input's sub-score; the figure is the points it added to the 100-point composite (weight × sub-score).
- Cash flow +30.0/30.0
- ARV discount +14.2/15.0
- 1% rule +10.0/10.0
- DSCR +10.0/10.0
- Appreciation +4.2/10.0
- Livability +3.7/5.0
- Rent growth +2.7/5.0
- Condition / age +2.5/5.0
- Schools +2.0/10.0
$99,900
🖨 Deal sheet 📄 Offer letter ✓ Due diligence
Listing remarks MLS
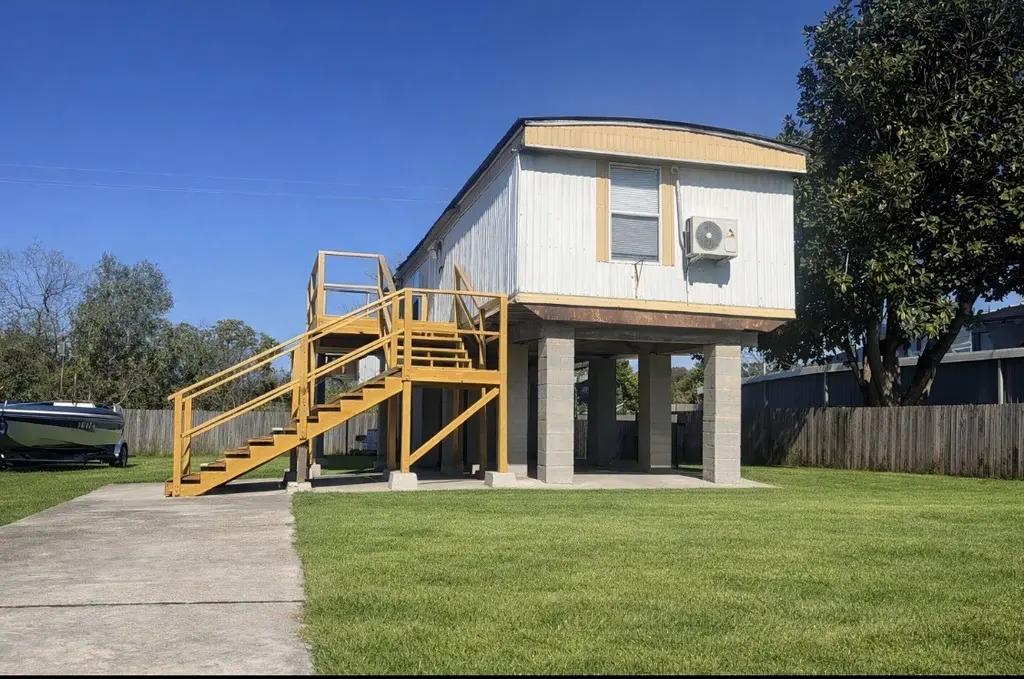
Affordable and newly remodeled home! Three bedrooms and one & half bathrooms make this a perfect space for a family. Updates throughout interior and exterior. New kitchen cabinets, New flooring, Fresh paint. New mini split AC/Heat units. Bathroom been redone. It is a MUST SEE!! Ready for new owner Come and see for yourself. Schedule your private tour the property!!
Key facts
- Newly remodeled home
- Fresh paint
- New flooring
Tags
Neighborhood map
What this means for you Summary
Snapshot
- This is a 3-bed/2.0-bath manufactured listed at $100k.
Deal economics
- At list price, monthly cash flow is $202 ($2k/yr) — positive.
- The deal already cash-flows at list — no discount required.
- Meets the 1% rule at list price ($2k rent vs $100k).
- Recommended offer: $88k (12.0% below list) — sets the bar for market timing.
- Cap rate 13.8% vs local median 3.2% in Houston — top-decile yield for the area; either an underpriced asset or a hidden risk that comps aren't pricing in. Stress-test before assuming the spread holds.
Location & tenants
- Location reads 74/100 on livability (#184 in TX, #4,771 nationally) — a middle-class / working-renter tenant base. Strengths: amenities A+, cost of living A+, housing A+; Watch: schools D, crime F.
- Sheldon ISD (suburban): math 19% / reading 25% proficiency, ranked #746 of 826 in TX (top 90%) — low school quality limits family demand, transient renter base, plan for 1-2y turnover; 72% free/reduced lunch — lower-income household profile, screen leases tightly.
- Market conditions: Rents flat; 337 active listings in the ZIP; 10 comparable units currently listed for rent nearby; rentals at typical pace (median 21d on market — plan ~3-4 weeks tenant-placement turnaround); solid renter incomes; 29,883 units permitted in Harris County in 2024 (8,621 in 5+ unit buildings).
Forward outlook
- Local home prices are declining (-1.6%/yr); year-one equity from $691 of loan paydown is wiped out by about $2k of value loss. Plan a longer hold.
- Harris County population projected at +47% by 2050 — long-run rental-demand tailwind backs the buy-and-hold thesis.
Negotiation context
- It's been on market 142 days — a 12% lower offer ($88k) is reasonable based on typical stale-listing flexibility.
Risks & watch-outs
- Watch-outs: flood insurance adds $427/mo.
- Climate carrying-cost: in FEMA flood zone AE (mandatory federal flood insurance); severe wind risk, 99% chance of damaging wind over 30y; extreme-heat days projected 7→25/yr by 2055 (HVAC capex compounding) — expect insurance premiums to compound above CPI over the hold.
Questions for the listing agent
- It's been on market 142 days. Have you received any prior offers? Is the seller open to a 12% concession, seller financing, or rate buy-down credit?
- What's the actual annual flood-insurance premium (NFIP or private), and is the property in a SFHA with mandatory coverage?
- Why hasn't it sold? Are there any deal-killer items the seller is aware of (foundation, flood, title, zoning, code violations)?
- Is there a deadline driving the sale (1031 exchange, divorce, estate, relocation)? That informs how much negotiation room exists.
- Schools are D-rated, which usually means shorter tenancies and higher turnover. Who's the typical renter profile here, and what's been the actual vacancy rate?
- Crime grade is F in this area — have there been break-ins, vandalism, or insurance claims at this property in the last 3 years? What carrier currently insures it and at what premium?
- What's the average days-on-market for RENTAL listings here right now (not sales)? A rising rental-DOM trend means longer vacancies and softer asking-rent achievability than the comps imply.
- What's the recent tenant-quality profile in this submarket — average credit score on applications, eviction rate, late-payment / NSF rate, and stable-employment percentage? A property-management company in the area should have these aggregated.
- How much new for-sale + rental construction is in the pipeline within 1–3 miles? Heavy new supply typically softens prices + rents 12–24 months out; constrained supply supports both.
Investment metrics
- 1% rule
- 1.54% ✓
- Cap rate
- 13.84%
- Cash-on-cash
- 26.95%
- DSCR
- 2.20
- GRM
- 5.4
CMA / ARV
- ARV (median comp)
- $117,391
- List price
- $99,900
- Delta
- -14.90%
- Verdict
- UNDERPRICED
- Comps
- 1 within 2.0 mi
Projected returns pro-forma
-1.59% appreciation · 0.92% rent growth · sell at horizon
- IRR
- -0.2%
- Equity multiple
- 0.99×
- Total profit
- $-228
- Equity at exit
- $21,335
- IRR
- 4.6%
- Equity multiple
- 1.37×
- Total profit
- $10,338
- Equity at exit
- $20,113
Cash invested: $27,972 (down + closing). Projections, not guarantees.
Landlord ↔ Tenant lean methodology
- Overall (STATE)
- 87 Strongly Landlord-Friendly
- State Texas
- 87 Strongly Landlord-Friendly · R+5
- County
- — inherits STATE
- City
- — inherits STATE
ZIP-level market 77044
- Home prices YoY
- -0.7%
- Rents YoY
- 0.9%
- Active inventory
- 337
- Price-to-rent
- 5.4×
Monthly cashflow live
- Estimated rent
- $1,538 high interval (Pro) →
- Mortgage (P&I)
- −$524
- Tax from tax record
- −$22 /mo · $258/yr
- Insurance
- −$42
- Flood insurance flood zone
- −$427 /mo · $5,118/yr
- HOA
- −$0
- Vacancy / Maint / Mgmt
- −$323
- Net cashflow
- $202
Break-even live
UW: 25.0% down · 7.5% · 30yr · 1.5% tax · 5.0% vac · 8.0% maint · 8.0% mgmt
Financing live
Cash to close
- Down payment
- $24,975
- Closing costs
- $2,997
- Reserves months
- —
- Total cash needed
- —
Loan-product check · same deal, 3 products live
Conventional
25% down · 7.5% · 30yr
- Down + closing
- —
- Monthly P&I
- —
- Monthly cashflow
- —
- DSCR
- —
- Eligible?
- —
Personal DTI + credit; lowest rate.
DSCR
20% down · 8.5% · 30yr
- Down + closing
- —
- Monthly P&I
- —
- Monthly cashflow
- —
- DSCR
- —
- Eligible?
- —
No personal income docs; deal must DSCR.
Hard money
10% down · 12.0% · 12mo
- Down + closing
- —
- Monthly P&I
- —
- Monthly cashflow
- —
- DSCR
- —
- Eligible?
- —
Short-term bridge; refi at stabilization.
Rent comps 10 comps
| Address | Beds | Baths | Sqft | Rent | $/sqft | DOM | Units | Dist |
|---|---|---|---|---|---|---|---|---|
| 8523 Brock Park Blvd Unit 1 Houston, TX | 3.0 | 1.5 | 1130 | $1,375 | $1.22 | 5d | 1 | 0.84mi |
| 9943 Valley Wind Dr Houston, TX | 3.0 | 2.0 | 1319 | $1,595 | $1.21 | 2d | 1 | 0.86mi |
| 12212 Tidwell Rd Houston, TX | 1.0–3.0 | 1.0–2.0 | 949 | $1,315 | $1.39 | 5d | 15 | 1.17mi |
| 12324 Tidwell Rd Houston, TX | 3.0 | 2.0 | 1170 | $1,254 | $1.07 | 24d | 1 | 1.21mi |
| 9930 Valley Lake Dr Houston, TX | 4.0 | 2.0 | 1385 | $1,795 | $1.30 | 43d | 1 | 1.25mi |
| 9399 Tidwell Rd Houston, TX | 3.0 | 2.0 | 1031 | $1,107 | $1.07 | 24d | 1 | 1.43mi |
| 9399 Tidwell Rd Houston, TX | 2.0 | 2.0 | 862 | $982 | $1.14 | 20d | 1 | 1.43mi |
| 9399 Tidwell Rd Houston, TX | 2.0 | 2.0 | 862 | $982 | $1.14 | 43d | 1 | 1.43mi |
| 9133 Woodlyn Rd Houston, TX | 3.0 | 1.0 | 1073 | $1,495 | $1.39 | 3d | 1 | 1.46mi |
| 9393 Tidwell Rd Houston, TX | 3.0–4.0 | 2.0 | 1135 | $1,244 | $1.10 | 1d | 10 | 1.47mi |
Listing history 16 events
-
2026-06-17days on market $99,900 Pending 142 DOM
-
2026-06-16days on market $99,900 Pending 141 DOM
-
2026-06-15statusdays on market $99,900 Pending 140 DOM
-
2026-06-13days on market $99,900 Active 138 DOM
-
2026-06-09days on market $99,900 Active 134 DOM
-
2026-06-08days on market $99,900 Active 133 DOM
-
2026-06-07days on market $99,900 Active 132 DOM
-
2026-06-04days on market $99,900 Active 129 DOM
-
2026-06-03days on market $99,900 Active 128 DOM
-
2026-06-02days on market $99,900 Active 127 DOM
-
2026-06-01days on market $99,900 Active 126 DOM
-
2026-05-31days on market $99,900 Active 125 DOM
-
2026-01-26$99,900 Active 373-char remark
Show marketing remark (373 chars)
Affordable and newly remodeled home! Three bedrooms and one & half bathrooms make this a perfect space for a family. Updates throughout interior and exterior. New kitchen cabinets, New flooring, Fresh paint. New mini split AC/Heat units. Bathroom been redone. It is a MUST SEE!! Ready for new owner Come and see for yourself. Schedule your private tour the property!!
-
2022-09-12soldstatus
-
2004-05-14soldstatus
-
1988-06-29soldstatus
ⓘ Source: listings_history table (triggers on properties + properties_extension) + one-shot
backfill from property_details.listing_events for pre-trigger history.
Tax reassessment forecast TX · Resets to sale price
- Current annual tax
- $258 · $22/mo
- Projected year-2 tax
- $1,828 · $152/mo
- Expected delta
- +$1,570/yr (+$131/mo · 607.5%)
ⓘ Screening estimate from a state-policy table — verify with the county assessor before closing.
Climate risk First Street
- Flood 5/10 Major FEMA zone AE · 24% chance over 30 yrs
- Wildfire 4/10 Moderate
- Heat 9/10 Extreme 7 d/yr ≥110°F today · 25 d/yr by 30 yrs out
- Wind 9/10 Extreme 99% chance of damaging wind over 30 yrs
- Air quality 2/10 Low 2 unhealthy d/yr today · 2 by 30 yrs out
Nearby sold comps map
Loading sold comps map…
Walkable amenities ~0.75 mi
Loading nearby amenities…
Taxation est. · year 1
- Rental income
- $18,458
- − Mortgage interest
- −$5,596
- − Property taxes
- −$258
- − Insurance
- −$5,618
- − Repairs & maintenance
- −$1,477
- − Management
- −$1,477
- − Depreciation
- −$2,906
- Taxable income
- $1,126
- Est. tax owed @ 24.0%
- −$270
- After-tax cash flow
- $2,149/yr
For passive investors: Depreciation is non-cash, so a rental often shows a tax loss while cash-flowing — sheltering income. Rental losses are passive: they offset passive income freely, and up to $25,000/yr can offset ordinary (W-2) income if you actively participate and your MAGI is under $100k (phasing out to $0 by $150k); unused losses carry forward. On sale, claimed depreciation is recaptured at up to 25%, and gains may owe capital-gains tax (a 1031 exchange can defer both). Figures are a year-1 estimate at your 24.0% rate — not tax advice; consult a CPA.
Schools (NCES district)
- District
- Sheldon ISD
- NCES district ID
- 4839990
- Math proficiency
- 19% ▼ -18.00%
- Reading proficiency
- 25% ▼ -10.00%
- Median HH income
- $49,443
- Composite
- 19.5/100
- National rank
- #8772
- State rank
- #746 of 826 in TX
Livability — Houston
- Score
- 74/100
- State rank
- #184
- US rank
- #4771
Category grades
Schools grade is shown separately in the Schools card above.
Census & demographics
- County
- Harris County · 4,702,590 people
- City population
- 3,226,434
- Metro
- Houston-The Woodlands-Sugar Land, TX
- Population (ZIP)
- 58,347
- Household income
- $95,000
- Rent vs Own
- Severe rent burden
- 1332.0
Population outlook (Harris County) Hauer SSP2
- Today (2025)
- 5,571,493 people
- By 2030
- 6,089,821 · +9.3%
- By 2040
- 7,142,806 · +28.2%
- By 2050
- 8,185,864 · +46.9%
- By 2075
- 10,574,329 · +89.8%
- By 2100
- 12,109,958 · +117.4%
Race, ethnicity, and origin ACS 2023
- Neighborhood character
- Diverse neighborhood (Simpson 0.66)
- Race & ethnicity
- Hispanic / Latino 44% Black 32% White 19% Two or more races 18% Native American 2% Asian 1%
- Hispanic origin (detail)
- Mexican 36%
- Common ancestry
- Lithuanian 1% Romanian 1% Iranian 1%
- Foreign-born
- 18% · Canada
- Languages at home
- 61% English-only · Spanish 35% French/Haitian/Cajun 1% Other Indo-European 1%
Political lean MEDSL · Harris
- 2024 margin
- Lean D (+5.5) · D 52.0% · R 46.4% · Other 1.6%
- 2008→2024 swing
- +3.9pp toward D · 2008: 1.6pp · 2024: 5.5pp
- All cycles
- 2024: D+5.5 2020: D+13.3 2016: D+12.4 2012: D+0.1 2008: D+1.6
Not yet ingested
- Civics
- —
Market trends
- HPI YoY
- ▼ -1.59%
- Current HPI
- 215.5736
- Rent YoY
- ▲ 0.92%
- Metro
- Houston-The Woodlands-Sugar Land, TX
- State GDP YoY
- ▲ 3.95%
- F500 in state
- 110
Industry mix (Fortune 500 HQ in TX)
| Industry | F500 HQs | Revenue |
|---|---|---|
| Energy | 16 | $1,198B |
|
||
| Technology | 5 | $198B |
|
||
| Engineering / Construction | 4 | $72B |
|
||
| Energy Services | 3 | $60B |
|
||
| Utilities | 3 | $41B |
|
||
| Healthcare | 2 | $330B |
|
||
Price history
4 events — show timeline
- 2026-01-26 Listed $99,900 HARMLS
- 2022-09-12 Sold (Public Records) — Public Records
- 2004-05-14 Sold (Public Records) — Public Records
- 1988-06-29 Sold (Public Records) — Public Records
Property tax history
+4.5%/yrLatest (2025): $258 · +21.6% YoY. Source: county tax records.
Cash-flow waterfall
monthlySold comps — $/sqft
last 12 mo · ≤1 miLoading sold comps…