 Multi-family
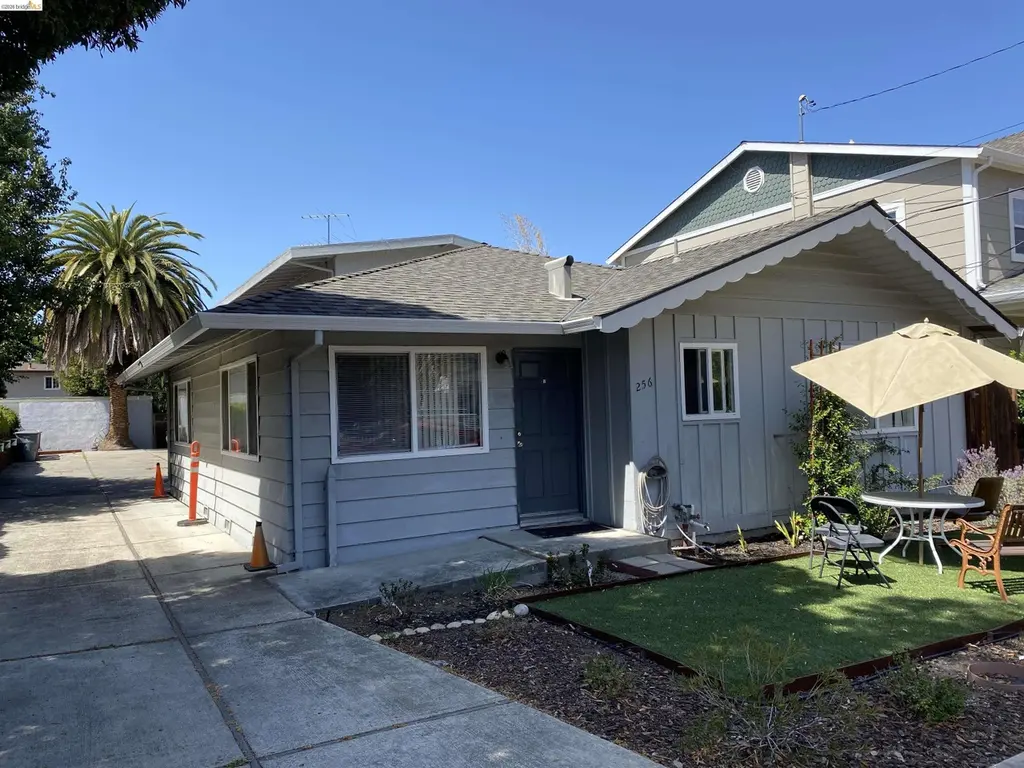
256 Pettis Ave · Mountain View, CA
Flood risk 1/10 · Minimal
- FEMA flood zone
- X
- Chance of flooding over 30 yrs
- 0.0%
- Est. flood insurance / yr
- $507 – $1,088
Fire risk 1/10 · Minimal
- Est. fire insurance / yr
- $659 – $1,223
Heat risk 4/10 · Minor
- Hot days now (above 92°F)
- 7 days/yr
- Hot days in 30 yrs
- 14 days/yr
Wind risk 1/10 · Minimal
- Chance of severe wind over 30 yrs
- —
Air-quality risk 7/10 · Major
- Unhealthy air days now
- 13 days/yr
- Unhealthy air days in 30 yrs
- 13 days/yr
Risk factors via First Street. Map © Google.
Why this score? — see what drove the D- grade
The composite is a weighted blend of 9 inputs, each scored 0–100. Each bar is that input's sub-score; the figure is the points it added to the 100-point composite (weight × sub-score).
- Cash flow +8.0/30.0
- Schools +8.0/10.0
- Appreciation +4.5/10.0
- Livability +4.2/5.0
- Rent growth +3.4/5.0
- Condition / age +2.5/5.0
- ARV discount +2.4/15.0
- DSCR +2.0/10.0
- 1% rule +1.7/10.0
$2,695,000
🖨 Deal sheet (PDF) 📄 Offer letter ✓ Due diligence
Multi-family units
County records classify this as Multi-Family (5+ Unit). Listing-text estimate: 1 unit. estimate disagrees with records
5+ unit building — per-unit beds/baths from public records are typically unavailable; the breakdown below (if shown) is an estimate from the listing text.
Listing remarks
Exceptional investment opportunity featuring a five-unit multifamily property comprised of one spacious front unit with three bedrooms and two bathrooms, two one-bedroom/one-bath units, and two studio units. The property offers stable in-place income with immediate cash flow, along with a compelling value-add opportunity through the potential to increase rents to market levels. This combination makes it well-suited for both seasoned and new multifamily investors seeking upside. Its prime location further enhances its appeal for those looking to establish or expand their portfolio in a strong and highly desirable market.
Key facts
- 6,400 sq ft lot
- Built 1961
- Listed 80 days
Property features AI
Exterior
- Parking: Covered parking; Parking lot with 5 total spaces
- Utilities: Heating available
- Home design: Commercial multi-unit building (5+ units); Built in 1961
- Construction: Shingle roof
- Exterior features: Level lot
Interior
- Flooring: Hardwood
- Heating & cooling: Heating present
- Interior features: Hardwood flooring
Neighborhood map
What this means for you Summary
Snapshot
- This is a multifamily listed at $2.69M.
Deal economics
- At list price, monthly cash flow is $-3k ($-33k/yr) — negative.
- To cash-flow at today's rent, offer at most $2.20M (18.2% below list).
- To meet the 1% rule (rent ≥ 1% of price), the offer needs to be $1.81M (33.0% below list).
- Recommended offer: $1.81M (33.0% below list) — sets the bar for 1% rule.
- Cap rate 5.1% vs local median 1.4% in Mountain View — top-decile yield for the area; either an underpriced asset or a hidden risk that comps aren't pricing in. Stress-test before assuming the spread holds.
Location & tenants
- Location reads 84/100 on livability (#14 in CA, #671 nationally) — a professional / high-income tenant draw. Strengths: amenities A+, commute A+, employment A+; Watch: crime D+, cost of living F.
- Mountain View-Los Altos Union High (urban): math 77% / reading 86% proficiency, ranked #11 of 517 in CA (top 2%) — strong family-tenant draw, lease renewals of 3-5y typical.
- Zoned schools: Stevenson Elementary (456 students, 8% FRL); Isaac Newton Graham Middle (881 students, 31% FRL); Los Altos High (math 74% / reading 83%, grade A-, #54 of 1,170 statewide, top 5%, 2,141 students, 13% FRL).
- Market conditions: Rents rising (+3.4%/yr); 23 active listings in the ZIP; high-income renter base; 3,838 units permitted in Santa Clara County in 2024 (1,886 in 5+ unit buildings).
- At $18,059/mo this rent would consume 121% of the median local household income ($179k/yr) (locally 981% of renters already pay >50% of income on rent) — very limited rent-growth headroom before tenants either downsize or default.
Forward outlook
- Local home prices are declining (-1.1%/yr); year-one equity from $19k of loan paydown is wiped out by about $28k of value loss. Plan a longer hold.
- Santa Clara County population projected at +24% by 2050 — long-run rental-demand tailwind backs the buy-and-hold thesis.
Negotiation context
- It's been on market 80 days — a 6% lower offer ($2.53M) is reasonable based on typical stale-listing flexibility.
- Current owner paid $2.30M; 17% above their basis — modest negotiation headroom, anchor on the comps not their cost.
Questions for the listing agent
- What do current leases actually rent for vs. the listed asking? Can we see a recent rent roll and the last 12 months of T-12 income?
- It's been on market 80 days. Have you received any prior offers? Is the seller open to a 33% concession, seller financing, or rate buy-down credit?
- Built in 1961 — when were the roof, HVAC, electrical panel, plumbing, and water heater last replaced?
- Why hasn't it sold? Are there any deal-killer items the seller is aware of (foundation, flood, title, zoning, code violations)?
- Is there a deadline driving the sale (1031 exchange, divorce, estate, relocation)? That informs how much negotiation room exists.
- Schools are A-rated — typically a magnet for longer-tenancy family renters. What's the average tenant stay here, and is there a school-zone premium baked into asking?
- Crime grade is D in this area — have there been break-ins, vandalism, or insurance claims at this property in the last 3 years? What carrier currently insures it and at what premium?
- The area grade is low — what's the realistic commute time and amenity access for the typical tenant pool here? Any planned neighborhood developments (good or bad) we should know about?
- What's the average days-on-market for RENTAL listings here right now (not sales)? A rising rental-DOM trend means longer vacancies and softer asking-rent achievability than the comps imply.
- What's the recent tenant-quality profile in this submarket — average credit score on applications, eviction rate, late-payment / NSF rate, and stable-employment percentage? A property-management company in the area should have these aggregated.
- How much new apartment / multifamily construction is in the pipeline within 1–3 miles? Heavy new supply (>2% of stock underway) typically softens rents 12–24 months out; light construction supports rent growth.
Investment metrics
- 1% rule
- 0.67% ✗
- Cap rate
- 5.05%
- Cash-on-cash
- -4.42%
- DSCR
- 0.80
- GRM
- 12.4
CMA / ARV
- ARV (on-the-fly)
- $2,422,865
- Comps found
- 6
Show comp detail 6 sales within ~0.75 mi
| Address | Dist | Beds/Ba | Sqft | Sold | Price | $/sf | Match |
|---|---|---|---|---|---|---|---|
| 201/209 Mariposa Ave | 0.06mi | 5/3.0 | 2,640 (-6%) | 7mo | $2,150,000 | $814 | 82 |
| 700 Mariposa Ave | 0.43mi | 6/4.0 | 2,616 (-7%) | 8mo | $2,400,000 | $917 | 62 |
| 392 View St | 0.63mi | 6/5.0 | 2,832 (+1%) | 12mo | $2,450,000 | $865 | 58 |
| 610 Chiquita Ave | 0.39mi | 7/5.0 | 2,968 (+6%) | 19mo | $2,100,000 | $708 | 56 |
| 1744 Marich Way | 0.63mi | 4/4.0 | 3,131 (+12%) | 3mo | $2,870,000 | $917 | 48 |
| 860 Park Dr | 0.75mi | 3/2.0 | 2,706 (-3%) | 16mo | $2,150,000 | $795 | 46 |
Match score weights: distance 35% · size 25% · config 20% · recency 20%. Top-matched comps best support the ARV.
Projected returns pro-forma
-1.06% appreciation · 3.44% rent growth · sell at horizon
- IRR
- -11.7%
- Equity multiple
- 0.50×
- Total profit
- $-379,596
- Equity at exit
- $643,262
- IRR
- -4.6%
- Equity multiple
- 0.58×
- Total profit
- $-315,778
- Equity at exit
- $669,288
Cash invested: $754,600 (down + closing). Projections, not guarantees.
Landlord ↔ Tenant lean methodology
- Overall (CITY)
- 0 Strongly Tenant-Friendly
- State California
- 18 Strongly Tenant-Friendly · D+13
- County
- — inherits STATE
- City Mountain View
- 0 Strongly Tenant-Friendly · D+34
ZIP-level market 94041
- Home prices YoY
- -0.3%
- Rents YoY
- 3.4%
- Active inventory
- 23
- Price-to-rent
- 45.7×
Monthly cashflow live
- Estimated rent
- $18,059 high interval (Pro) →
- Mortgage (P&I)
- −$14,133
- Tax from tax record
- −$1,792 /mo · $21,510/yr
- Insurance
- −$1,123
- HOA
- −$0
- Lot rent
- −$0
- Vacancy / Maint / Mgmt
- −$3,792
- Net cashflow
- $-2,782
Break-even live
Sensitivity live
| Price | -10% $-1,256 | -5% $-2,019 | +0% $-2,782 | +5% $-3,544 | +10% $-4,307 |
|---|---|---|---|---|---|
| Rent | -10% $-4,208 | -5% $-3,495 | +0% $-2,782 | +5% $-2,068 | +10% $-1,355 |
| Rate | -1.0pp $-1,424 | -0.5pp $-2,096 | base $-2,782 | +0.5pp $-3,480 | +1.0pp $-4,190 |
5-unit breakdown (identical units grouped — click to expand)
| Units | Beds | Baths | Est. rent |
|---|---|---|---|
| 1× unit | 3 | 2 | $4,914 |
| 4× units | 1 | 1 | $13,144 |
| #2 | 1 | 1 | $3,286 |
| #3 | 1 | 1 | $3,286 |
| #4 | 1 | 1 | $3,286 |
| #5 | 1 | 1 | $3,286 |
| Total (5 units) | $18,059 | ||
UW: 25.0% down · 7.5% · 30yr · 1.5% tax · 5.0% vac · 8.0% maint · 8.0% mgmt
Financing live
Cash to close
- Down payment
- $673,750
- Closing costs
- $80,850
- Reserves months
- —
- Total cash needed
- —
Loan-product check · same deal, 3 products live
Conventional
25% down · 7.5% · 30yr
- Down + closing
- —
- Monthly P&I
- —
- Monthly cashflow
- —
- DSCR
- —
- Eligible?
- —
Personal DTI + credit; lowest rate.
DSCR
20% down · 8.5% · 30yr
- Down + closing
- —
- Monthly P&I
- —
- Monthly cashflow
- —
- DSCR
- —
- Eligible?
- —
No personal income docs; deal must DSCR.
Hard money
10% down · 12.0% · 12mo
- Down + closing
- —
- Monthly P&I
- —
- Monthly cashflow
- —
- DSCR
- —
- Eligible?
- —
Short-term bridge; refi at stabilization.
Listing history 20 events
-
2026-06-22days on market $2,695,000 Active 80 DOM
-
2026-06-21days on market $2,695,000 Active 79 DOM
-
2026-06-18days on market $2,695,000 Active 76 DOM
-
2026-06-17days on market $2,695,000 Active 75 DOM
-
2026-06-16days on market $2,695,000 Active 74 DOM
-
2026-06-15days on market $2,695,000 Active 73 DOM
-
2026-06-13days on market $2,695,000 Active 71 DOM
-
2026-06-13days on market $2,695,000 Active 70 DOM
-
2026-06-09days on market $2,695,000 Active 67 DOM
-
2026-06-08days on market $2,695,000 Active 66 DOM
-
2026-06-07days on market $2,695,000 Active 65 DOM
-
2026-06-05days on market $2,695,000 Active 62 DOM
-
2026-06-03days on market $2,695,000 Active 61 DOM
-
2026-06-02days on market $2,695,000 Active 60 DOM
-
2026-06-01days on market $2,695,000 Active 59 DOM
-
2026-05-31days on market $2,695,000 Active 58 DOM
-
2026-04-03$2,695,000 Active
-
2022-06-17soldstatus $2,300,000
-
1995-08-11soldstatus $442,000
-
1994-11-30soldstatus $298,000
ⓘ Source: listings_history table (triggers on properties + properties_extension) + one-shot
backfill from property_details.listing_events for pre-trigger history.
Tax reassessment forecast CA · Resets to sale price
- Current annual tax
- $21,510 · $1,792/mo
- Projected year-2 tax
- $21,510 · $1,792/mo
- Expected delta
- $0/yr ($0/mo · 0.0%)
ⓘ Screening estimate from a state-policy table — verify with the county assessor before closing.
Climate risk First Street
- Flood 1/10 Low FEMA zone X · 0% chance over 30 yrs
- Wildfire 1/10 Low
- Heat 4/10 Moderate 7 d/yr ≥92°F today · 14 d/yr by 30 yrs out
- Wind 1/10 Low
- Air quality 7/10 Severe 13 unhealthy d/yr today · 13 by 30 yrs out
Nearby sold comps map
Loading sold comps map…
Walkable amenities ~0.75 mi
Loading nearby amenities…
Taxation est. · year 1
- Rental income
- $216,708
- − Mortgage interest
- −$150,962
- − Property taxes
- −$21,510
- − Insurance
- −$13,475
- − Repairs & maintenance
- −$17,337
- − Management
- −$17,337
- − Depreciation
- −$78,400
- Taxable loss
- −$82,312
- Est. tax savings @ 24.0%
- +$19,755
- After-tax cash flow
- $-13,625/yr
For passive investors: Depreciation is non-cash, so a rental often shows a tax loss while cash-flowing — sheltering income. Rental losses are passive: they offset passive income freely, and up to $25,000/yr can offset ordinary (W-2) income if you actively participate and your MAGI is under $100k (phasing out to $0 by $150k); unused losses carry forward. On sale, claimed depreciation is recaptured at up to 25%, and gains may owe capital-gains tax (a 1031 exchange can defer both). Figures are a year-1 estimate at your 24.0% rate — not tax advice; consult a CPA.
Schools (NCES district)
- District
- Mountain View-Los Altos Union High
- NCES district ID
- 0626310
- Math proficiency
- 77% ▲ 9.00%
- Reading proficiency
- 86% ▲ 4.00%
- Median HH income
- $161,233
- Composite
- 79.5/100
- National rank
- #59
- State rank
- #11 of 517 in CA
Livability — Mountain View
- Score
- 84/100
- State rank
- #14
- US rank
- #671
Category grades
Schools grade is shown separately in the Schools card above.
Census & demographics
- Census place
- Mountain View, CA
- County
- Santa Clara County · 1,806,974 people
- City population
- 84,858
- Metro
- San Jose-Sunnyvale-Santa Clara, CA
- Population (ZIP)
- 16,050
- Household income
- $178,558
- Rent vs Own
- Severe rent burden
- 981.0
Population outlook (Santa Clara County) Hauer SSP2
- Today (2025)
- 2,179,074 people
- By 2030
- 2,301,297 · +5.6%
- By 2040
- 2,528,195 · +16.0%
- By 2050
- 2,712,135 · +24.5%
- By 2075
- 2,998,701 · +37.6%
- By 2100
- 2,931,429 · +34.5%
Race, ethnicity, and origin ACS 2023
- Neighborhood character
- Highly diverse neighborhood (Simpson 0.71)
- Race & ethnicity
- White 37% Hispanic / Latino 28% Asian 27% Two or more races 13% Black 2% Native American 1%
- Hispanic origin (detail)
- Mexican 17%
- Common ancestry
- Italian 3% Romanian 2% Lithuanian 2%
- Foreign-born
- 39% · Canada, China, Jamaica
- Languages at home
- 50% English-only · Spanish 20% Chinese 11% Other Indo-European 7%
Political lean MEDSL · Santa Clara
- 2024 margin
- Solid D (+40.0) · D 68.1% · R 28.1% · Other 3.8%
- 2008→2024 swing
- -0.9pp no change · 2008: 40.9pp · 2024: 40.0pp
- All cycles
- 2024: D+40.0 2020: D+47.4 2016: D+52.5 2012: D+42.1 2008: D+40.9
Not yet ingested
- Civics
- —
Market trends
- HPI YoY
- ▼ -1.06%
- Current HPI
- 399.4625
- Rent YoY
- ▲ 3.44%
- Metro
- San Jose-Sunnyvale-Santa Clara, CA
- State GDP YoY
- ▲ 3.21%
- F500 in state
- 116
Industry mix (Fortune 500 HQ in CA)
| Industry | F500 HQs | Revenue |
|---|---|---|
| Technology | 27 | $1,492B |
|
||
| Financial Services | 3 | $174B |
|
||
| Retail | 3 | $44B |
|
||
| Insurance | 3 | $26B |
|
||
| Media / Entertainment | 2 | $115B |
|
||
| Pharmaceuticals / Biotech | 2 | $62B |
|
||
Price history
+804.4% since first listed4 events — show timeline
- 2026-04-03 Listed $2,695,000 bridgeMLS, Bay East AOR, or Contra Costa AOR
- 2022-06-17 Sold (Public Records) $2,300,000 Public Records
- 1995-08-11 Sold (Public Records) $442,000 Public Records
- 1994-11-30 Sold (Public Records) $298,000 Public Records
Property tax history
+7.3%/yrLatest (2025): $21,510 · -23.5% YoY. Source: county tax records.
Cash-flow waterfall
monthlySold comps — $/sqft
last 12 mo · ≤1 miLoading sold comps…