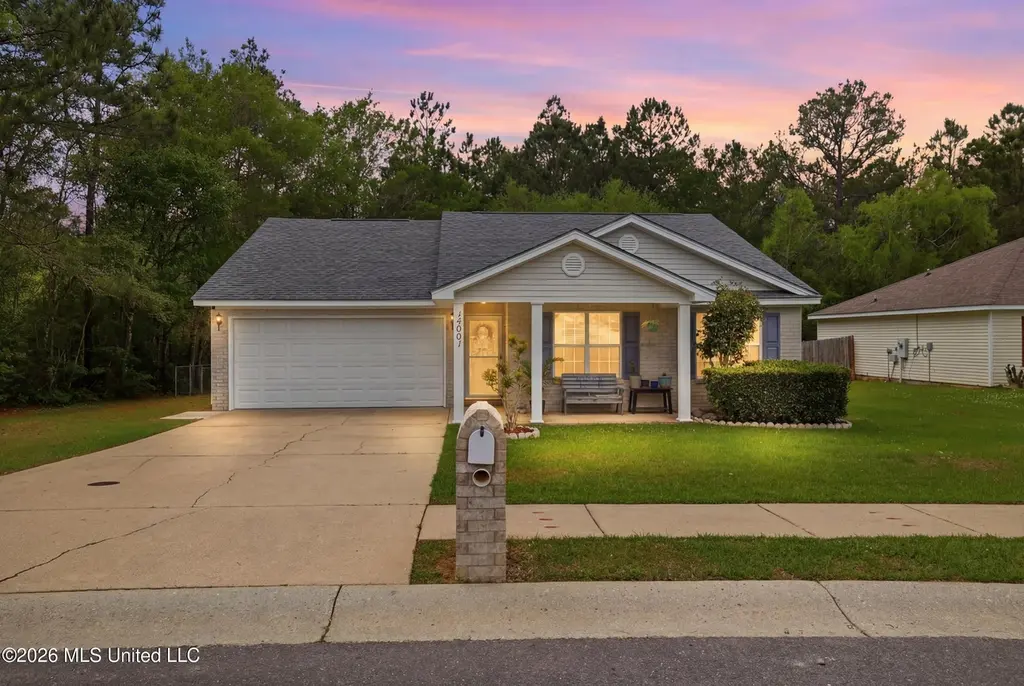
14001 Dundee Cv · Gulfport, MS
Flood risk 1/10 · Minimal
- FEMA flood zone
- X (unshaded)
- Chance of flooding over 30 yrs
- 0.0%
- Est. flood insurance / yr
- $507 – $1,088
Fire risk 5/10 · Moderate
- Est. fire insurance / yr
- $1,241 – $2,305
Heat risk 9/10 · Severe
- Hot days now (above 108°F)
- 7 days/yr
- Hot days in 30 yrs
- 21 days/yr
Wind risk 9/10 · Severe
- Chance of severe wind over 30 yrs
- 99.0%
Air-quality risk 1/10 · Minimal
- Unhealthy air days now
- 0 days/yr
- Unhealthy air days in 30 yrs
- 0 days/yr
Risk factors via First Street. Map © Google.
Why this score? — see what drove the C+ grade
The composite is a weighted blend of 9 inputs, each scored 0–100. Each bar is that input's sub-score; the figure is the points it added to the 100-point composite (weight × sub-score).
- Cash flow +24.3/30.0
- ARV discount +9.1/15.0
- DSCR +7.8/10.0
- 1% rule +5.2/10.0
- Rent growth +4.2/5.0
- Schools +4.2/10.0
- Livability +3.7/5.0
- Condition / age +2.5/5.0
- Appreciation +0.0/10.0
$219,990
🖨 Deal sheet 📄 Offer letter ✓ Due diligence
Listing remarks MLS
Purchase this property with as low as 3% down. Property approved for Homepath Mortgage Financing & Homepath Renovation Mortgage.Property acquired through a Foreclosure Sale and the property is being sold in AS IS condition. Seller does not make any representations or warranties as to its condition.
Key facts
- Spacious yard
- Fresh paint
- Woods bordering
Tags
Property features AI
Exterior
- Parking: Attached garage with 2 spaces
- Security: Owned security system
- Utilities: Public sewer; Community water; Cable available; Electricity connected; Sewer connected; Water connected
- Home design: Single-family house; One level
- Construction: Vinyl and brick exterior; Shingle roof; Slab foundation; Built according to assessor records
- Exterior features: Rain gutters; Located on a cul-de-sac
Interior
- Kitchen: Free-standing electric range; Refrigerator
- Flooring: Luxury vinyl flooring
- Bathrooms: 2 full bathrooms
- Heating & cooling: Central electric heating; Central electric air conditioning
- Interior features: Fireplace in the living room; Window blinds
Neighborhood map
What this means for you Summary
Snapshot
- This is a 4-bed/1.0-bath single-family listed at $220k.
Deal economics
- At list price, monthly cash flow is $443 ($5k/yr) — positive.
- The deal already cash-flows at list — no discount required.
- Meets the 1% rule at list price ($2k rent vs $220k).
- Recommended offer: $213k (3.0% below list) — sets the bar for market timing.
- Cap rate 8.7% vs local median 4.9% in Gulfport — top-decile yield for the area; either an underpriced asset or a hidden risk that comps aren't pricing in. Stress-test before assuming the spread holds.
Location & tenants
- Location reads 73/100 on livability (#15 in MS) — a middle-class / working-renter tenant base. Strengths: cost of living A+, housing A+, health & safety A+; Watch: amenities F, commute F, employment F.
- Harrison County School District (rural): math 52% / reading 46% proficiency, ranked #14 of 130 in MS (top 11%) — families likely to look elsewhere, expect single-tenant / working-renter base with shorter leases; 62% free/reduced lunch — lower-income household profile, screen leases tightly.
- Zoned schools: Lyman Elementary School (math 62% / reading 50%, grade C+, #39 of 375 statewide, top 10%, 490 students, 99% FRL) — zoned schools average 99% FRL vs 62% district-wide (37 pts higher); higher-poverty schools than district average — tighter screening recommended.
- Market conditions: Rents rising fast (+7.0%/yr); 763 active listings in the ZIP; 2 comparable units currently listed for rent nearby; 2,194 units permitted in Harrison County in 2024 (0 in 5+ unit buildings).
- This rent runs 43% of the median local income ($63k/yr) — at the standard rent-burdened threshold; future hikes will face affordability resistance.
Forward outlook
- Local home prices are declining (-3.0%/yr); year-one equity from $2k of loan paydown is wiped out by about $7k of value loss. Plan a longer hold.
- Harrison County population projected at +27% by 2050 — long-run rental-demand tailwind backs the buy-and-hold thesis.
- At projected returns (-3.0% appreciation + 7.0% rent growth), your $62k cash investment doubles in ~9 years — after that, you're playing with house money.
Negotiation context
- It's been on market 50 days — a 3% lower offer ($213k) is reasonable based on typical stale-listing flexibility.
- 3 sale attempts since 16y ago; this cycle's ask has dropped $30k (12%) from the opening price — seller is motivated, your offer sets the floor, not the list.
Risks & watch-outs
- Climate carrying-cost: severe wind risk, 99% chance of damaging wind over 30y; moderate wildfire risk; extreme-heat days projected 7→21/yr by 2055 (HVAC capex compounding) — expect insurance premiums to compound above CPI over the hold.
Questions for the listing agent
- It's been on market 50 days. Have you received any prior offers? Is the seller open to a 3% concession, seller financing, or rate buy-down credit?
- Is there a deadline driving the sale (1031 exchange, divorce, estate, relocation)? That informs how much negotiation room exists.
- Schools are D-rated, which usually means shorter tenancies and higher turnover. Who's the typical renter profile here, and what's been the actual vacancy rate?
- What's the average days-on-market for RENTAL listings here right now (not sales)? A rising rental-DOM trend means longer vacancies and softer asking-rent achievability than the comps imply.
- What's the recent tenant-quality profile in this submarket — average credit score on applications, eviction rate, late-payment / NSF rate, and stable-employment percentage? A property-management company in the area should have these aggregated.
- How much new for-sale + rental construction is in the pipeline within 1–3 miles? Heavy new supply typically softens prices + rents 12–24 months out; constrained supply supports both.
Investment metrics
- 1% rule
- 1.02% ✓
- Cap rate
- 8.71%
- Cash-on-cash
- 8.63%
- DSCR
- 1.38
- GRM
- 8.2
CMA / ARV
- ARV (on-the-fly)
- $228,230
- Comps found
- 12
Show comp detail 12 sales within ~0.75 mi
| Address | Dist | Beds/Ba | Sqft | Sold | Price | $/sf | Match |
|---|---|---|---|---|---|---|---|
| 14036 Dundee Cv | 0.10mi | 3/2.0 (-1) | 1,438 (-9%) | 3mo | $194,000 | $135 | 70 |
| 14041 Anandale Cir | 0.43mi | 3/2.0 (-1) | 1,589 (+1%) | 10mo | $227,900 | $143 | 61 |
| 14123 Anandale Cir | 0.43mi | 3/2.0 (-1) | 1,558 (-1%) | 12mo | $245,000 | $157 | 59 |
| 16259 Greenglade Dr | 0.37mi | 3/2.0 (-1) | 1,466 (-7%) | 7mo | $219,000 | $149 | 57 |
| 14028 Dundee Cv | 0.08mi | 3/2.0 (-1) | 1,365 (-13%) | 13mo | $184,900 | $135 | 55 |
| 14033 Dundee Cv | 0.10mi | 3/2.0 (-1) | 1,347 (-14%) | 11mo | $195,000 | $145 | 53 |
| 14137 Waterford Cir | 0.38mi | 3/2.0 (-1) | 1,448 (-8%) | 12mo | $219,500 | $152 | 50 |
| 1 Wheaton Cv | 0.33mi | 3/2.0 (-1) | 1,425 (-10%) | 13mo | $130,000 | $91 | 49 |
| 4 Heatherwood Dr | 0.31mi | 3/2.0 (-1) | 1,434 (-9%) | 18mo | $225,000 | $157 | 47 |
| 14047 Anandale Cir | 0.43mi | 3/2.0 (-1) | 1,736 (+10%) | 10mo | $253,900 | $146 | 45 |
| 14073 Anandale Cir | 0.45mi | 3/2.0 (-1) | 1,707 (+8%) | 13mo | $248,000 | $145 | 45 |
| 14032 Anandale Cir | 0.46mi | 3/2.0 (-1) | 1,750 (+11%) | 12mo | $247,000 | $141 | 41 |
Match score weights: distance 35% · size 25% · config 20% · recency 20%. Top-matched comps best support the ARV.
Projected returns pro-forma
-3.0% appreciation · 6.99% rent growth · sell at horizon
- IRR
- 0.8%
- Equity multiple
- 1.03×
- Total profit
- $1,858
- Equity at exit
- $32,801
- IRR
- 13.8%
- Equity multiple
- 2.29×
- Total profit
- $79,397
- Equity at exit
- $19,021
Cash invested: $61,597 (down + closing). Projections, not guarantees.
Landlord ↔ Tenant lean methodology
- Overall (STATE)
- 90 Strongly Landlord-Friendly
- State Mississippi
- 90 Strongly Landlord-Friendly · R+11
- County
- — inherits STATE
- City
- — inherits STATE
ZIP-level market 39503
- Home prices YoY
- -21.5%
- Rents YoY
- 7.0%
- Active inventory
- 763
- Price-to-rent
- 8.2×
Monthly cashflow live
- Estimated rent
- $2,246 medium interval (Pro) →
- Mortgage (P&I)
- −$1,154
- Tax from tax record
- −$86 /mo · $1,034/yr
- Insurance
- −$92
- HOA
- −$0
- Vacancy / Maint / Mgmt
- −$472
- Net cashflow
- $443
Break-even live
UW: 25.0% down · 7.5% · 30yr · 1.5% tax · 5.0% vac · 8.0% maint · 8.0% mgmt
Financing live
Cash to close
- Down payment
- $54,998
- Closing costs
- $6,600
- Reserves months
- —
- Total cash needed
- —
Loan-product check · same deal, 3 products live
Conventional
25% down · 7.5% · 30yr
- Down + closing
- —
- Monthly P&I
- —
- Monthly cashflow
- —
- DSCR
- —
- Eligible?
- —
Personal DTI + credit; lowest rate.
DSCR
20% down · 8.5% · 30yr
- Down + closing
- —
- Monthly P&I
- —
- Monthly cashflow
- —
- DSCR
- —
- Eligible?
- —
No personal income docs; deal must DSCR.
Hard money
10% down · 12.0% · 12mo
- Down + closing
- —
- Monthly P&I
- —
- Monthly cashflow
- —
- DSCR
- —
- Eligible?
- —
Short-term bridge; refi at stabilization.
Rent comps 2 comps
| Address | Beds | Baths | Sqft | Rent | $/sqft | DOM | Units | Dist |
|---|---|---|---|---|---|---|---|---|
| 13415 John Clark Rd Gulfport, MS | 3.0 | 2.0 | 2067 | $2,090 | $1.01 | 43d | 1 | 0.79mi |
| 15395 Percy St Gulfport, MS | 3.0 | 2.0 | 1710 | $1,975 | $1.15 | 43d | 1 | 1.37mi |
Listing history 17 events
-
2026-06-18days on market $219,990 Active 50 DOM
-
2026-06-17days on market $219,990 Active 49 DOM
-
2026-06-16days on market $219,990 Active 48 DOM
-
2026-06-15pricestatusdays on market $219,990 Active 47 DOM
-
2026-06-08status $229,990 Pending 46 DOM
-
2026-06-07days on market $229,990 Active 46 DOM
-
2026-06-02days on market $229,990 Active 41 DOM
-
2026-06-01days on market $229,990 Active 40 DOM
-
2026-05-31days on market $229,990 Active 39 DOM
-
2026-05-30days on market $229,990 Active 38 DOM
-
2026-05-18status Active
-
2026-04-28status Pending
-
2026-04-16price $229,990
-
2026-04-02$249,990 Active
-
2010-02-23soldstatus 303-char remark
Show marketing remark (303 chars)
Purchase this property with as low as 3% down. Property approved for Homepath Mortgage Financing & Homepath Renovation Mortgage.Property acquired through a Foreclosure Sale and the property is being sold in AS IS condition. Seller does not make any representations or warranties as to its condition.
-
2010-02-22soldstatus
-
2010-01-08$104,900 303-char remark
Show marketing remark (303 chars)
Purchase this property with as low as 3% down. Property approved for Homepath Mortgage Financing & Homepath Renovation Mortgage.Property acquired through a Foreclosure Sale and the property is being sold in AS IS condition. Seller does not make any representations or warranties as to its condition.
ⓘ Source: listings_history table (triggers on properties + properties_extension) + one-shot
backfill from property_details.listing_events for pre-trigger history.
Tax reassessment forecast MS · Resets to sale price
- Current annual tax
- $1,034 · $86/mo
- Projected year-2 tax
- $1,738 · $145/mo
- Expected delta
- +$703/yr (+$59/mo · 68.0%)
ⓘ Screening estimate from a state-policy table — verify with the county assessor before closing.
Climate risk First Street
- Flood 1/10 Low FEMA zone X (unshaded) · 0% chance over 30 yrs
- Wildfire 5/10 Major
- Heat 9/10 Extreme 7 d/yr ≥108°F today · 21 d/yr by 30 yrs out
- Wind 9/10 Extreme 99% chance of damaging wind over 30 yrs
- Air quality 1/10 Low 0 unhealthy d/yr today · 0 by 30 yrs out
Nearby sold comps map
Loading sold comps map…
Walkable amenities ~0.75 mi
Loading nearby amenities…
Taxation est. · year 1
- Rental income
- $26,953
- − Mortgage interest
- −$12,323
- − Property taxes
- −$1,034
- − Insurance
- −$1,100
- − Repairs & maintenance
- −$2,156
- − Management
- −$2,156
- − Depreciation
- −$6,400
- Taxable income
- $1,784
- Est. tax owed @ 24.0%
- −$428
- After-tax cash flow
- $4,887/yr
For passive investors: Depreciation is non-cash, so a rental often shows a tax loss while cash-flowing — sheltering income. Rental losses are passive: they offset passive income freely, and up to $25,000/yr can offset ordinary (W-2) income if you actively participate and your MAGI is under $100k (phasing out to $0 by $150k); unused losses carry forward. On sale, claimed depreciation is recaptured at up to 25%, and gains may owe capital-gains tax (a 1031 exchange can defer both). Figures are a year-1 estimate at your 24.0% rate — not tax advice; consult a CPA.
Schools (NCES district)
- District
- Harrison County School District
- NCES district ID
- 2801770
- Math proficiency
- 52% ▼ -4.00%
- Reading proficiency
- 46% ▼ -4.00%
- Median HH income
- $46,504
- Composite
- 41.66/100
- National rank
- #3419
- State rank
- #14 of 130 in MS
Livability — Gulfport
- Score
- 73/100
- State rank
- #15
- US rank
- #5010
Category grades
Schools grade is shown separately in the Schools card above.
Census & demographics
- Census place
- Gulfport, MS
- County
- Harrison County · 178,171 people
- City population
- 96,188
- Metro
- Gulfport-Biloxi, MS
- Population (ZIP)
- 55,059
- Household income
- $62,641
- Rent vs Own
- Severe rent burden
- 1686.0
Population outlook (Harrison County) Hauer SSP2
- Today (2025)
- 228,444 people
- By 2030
- 241,942 · +5.9%
- By 2040
- 267,531 · +17.1%
- By 2050
- 291,062 · +27.4%
- By 2075
- 346,711 · +51.8%
- By 2100
- 378,165 · +65.5%
Race, ethnicity, and origin ACS 2023
- Neighborhood character
- Diverse neighborhood (Simpson 0.58)
- Race & ethnicity
- White 58% Black 27% Two or more races 9% Hispanic / Latino 6% Asian 2%
- Hispanic origin (detail)
- Mexican 2% Puerto Rican 1%
- Common ancestry
- Lithuanian 5% Slovak 1% Portuguese 1%
- Foreign-born
- 3% · Canada
- Languages at home
- 95% English-only · Spanish 3%
Political lean MEDSL · Harrison
- 2024 margin
- Strong R (+28.9) · D 35.0% · R 63.9% · Other 1.1%
- 2008→2024 swing
- -2.9pp toward R · 2008: -26.0pp · 2024: -28.9pp
- All cycles
- 2024: R+28.9 2020: R+25.2 2016: R+30.7 2012: R+26.6 2008: R+26.0
Not yet ingested
- Civics
- —
Market trends
- HPI YoY
- ▼ -51.39%
- Current HPI
- 187.285
- Rent YoY
- ▲ 6.99%
- Metro
- Gulfport-Biloxi, MS
- State GDP YoY
- —
- F500 in state
- 0
Price history
+119.2% since first listed7 events — show timeline
- 2026-05-18 Relisted — MLSU
- 2026-04-28 Pending — MLSU
- 2026-04-16 Price Changed $229,990 MLSU
- 2026-04-02 Listed $249,990 MLSU
- 2010-02-23 Sold (MLS) — MLSU
- 2010-02-22 Sold (Public Records) — Public Records
- 2010-01-08 Listed $104,900 MLSU
Property tax history
-0.3%/yrLatest (2025): $1,034 · +5.6% YoY. Source: county tax records.
Cash-flow waterfall
monthlySold comps — $/sqft
last 12 mo · ≤1 miLoading sold comps…