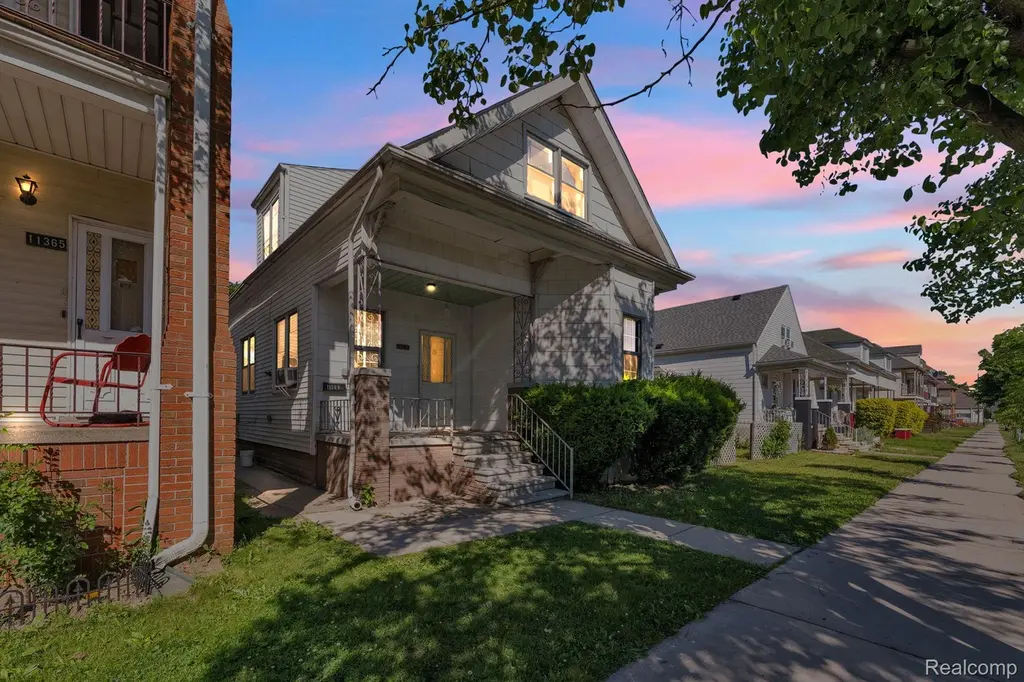
11369 Lumpkin St · Hamtramck, MI
Flood risk 1/10 · Minimal
- FEMA flood zone
- X (unshaded)
- Chance of flooding over 30 yrs
- 0.0%
- Est. flood insurance / yr
- $507 – $1,088
Fire risk 1/10 · Minimal
- Est. fire insurance / yr
- $784 – $1,456
Heat risk 3/10 · Minor
- Hot days now (above 96°F)
- 7 days/yr
- Hot days in 30 yrs
- 15 days/yr
Wind risk 2/10 · Minimal
- Chance of severe wind over 30 yrs
- —
Air-quality risk 4/10 · Minor
- Unhealthy air days now
- 4 days/yr
- Unhealthy air days in 30 yrs
- 6 days/yr
Risk factors via First Street. Map © Google.
Why this score? — see what drove the C+ grade
The composite is a weighted blend of 9 inputs, each scored 0–100. Each bar is that input's sub-score; the figure is the points it added to the 100-point composite (weight × sub-score).
- Cash flow +23.1/30.0
- ARV discount +15.0/15.0
- DSCR +7.4/10.0
- 1% rule +5.1/10.0
- Livability +4.0/5.0
- Rent growth +2.5/5.0
- Condition / age +2.5/5.0
- Schools +1.0/10.0
- Appreciation +0.0/10.0
$165,000
🖨 Deal sheet 📄 Offer letter ✓ Due diligence
Listing remarks MLS
Excellent investment opportunity in the heart of Hamtramck! This well-maintained multi-family property features two spacious units, offering a total of 5 bedrooms and 2 full bathrooms. The first unit includes 2 bedrooms and 1 full bath, while the second unit offers 3 bedrooms and 1 full bath, providing flexible living arrangements for owner-occupants, multi-generational families, or investors seeking rental income. Conveniently located near shopping, dining, schools, parks, and major freeways, this property offers easy access to Downtown Detroit and surrounding communities. Whether you're looking to expand your investment portfolio or occupy one unit while generating income from the other, this versatile property presents a fantastic opportunity. Schedule your private showing today!
Key facts
- Spacious units
- 3,485 sq ft lot
- Built 1915
Tags
Property features AI
Finance
- Other: Pets not allowed
- Financial info: Annual tax: $1,029
Exterior
- Utilities: Public water; Public sewer
- Home design: Multi-family residential property; Two levels
- Construction: Vinyl siding
- Exterior features: Paved road access; Lot roughly 30 x 111 (0.08 acres); Zoned for multi-family
Interior
- Bathrooms: 2 full bathrooms
- Heating & cooling: Forced air heating (natural gas); No central cooling
- Interior features: Crawl space basement
Neighborhood map
What this means for you Summary
Snapshot
- This is a 5-bed/2.0-bath single-family listed at $165k.
Deal economics
- At list price, monthly cash flow is $296 ($4k/yr) — positive.
- The deal already cash-flows at list — no discount required.
- Meets the 1% rule at list price ($2k rent vs $165k).
- Cap rate 8.4% vs local median 4.4% in Hamtramck — top-decile yield for the area; either an underpriced asset or a hidden risk that comps aren't pricing in. Stress-test before assuming the spread holds.
Location & tenants
- Location reads 79/100 on livability (#88 in MI, #2,005 nationally) — a middle-class / working-renter tenant base. Strengths: amenities A+, commute A+, cost of living A+; Watch: crime D, schools D-, employment F.
- Hamtramck School District (suburban): math 9% / reading 17% proficiency, ranked #519 of 540 in MI (top 96%) — low school quality limits family demand, transient renter base, plan for 1-2y turnover; 86% free/reduced lunch — lower-income household profile, screen leases tightly.
- Market conditions: 166 active listings in the ZIP; 7 comparable units currently listed for rent nearby; rentals at typical pace (median 18d on market — plan ~3-4 weeks tenant-placement turnaround); lower-income renter base — watch delinquency; 2,639 units permitted in Wayne County in 2024 (1,216 in 5+ unit buildings).
- At $1,666/mo this rent would consume 52% of the median local household income ($38k/yr) (locally 1175% of renters already pay >50% of income on rent) — very limited rent-growth headroom before tenants either downsize or default.
Forward outlook
- Local home prices are declining (-3.0%/yr); year-one equity from $1k of loan paydown is wiped out by about $5k of value loss. Plan a longer hold.
- Wayne County population projected at -17% by 2050 — secular population decline; favor cash flow + early exit over multi-decade hold.
Negotiation context
- Only 7 days on market — expect competitive offers; lowballing is unlikely to land.
- 4 sale attempts since 13y ago with the ask held roughly flat each time — persistent listings suggest the price (not the market) is what's stuck; bring a comps-based counter.
- Current owner paid $14k; list at $165k implies a 1038% gain — meaningful room to come down on a strong offer.
Risks & watch-outs
- Watch-outs: built in 1915 — expect roof / HVAC / electrical / plumbing capex.
Questions for the listing agent
- Built in 1915 — when were the roof, HVAC, electrical panel, plumbing, and water heater last replaced?
- Is there a deadline driving the sale (1031 exchange, divorce, estate, relocation)? That informs how much negotiation room exists.
- Schools are D-rated, which usually means shorter tenancies and higher turnover. Who's the typical renter profile here, and what's been the actual vacancy rate?
- Crime grade is D in this area — have there been break-ins, vandalism, or insurance claims at this property in the last 3 years? What carrier currently insures it and at what premium?
- What's the average days-on-market for RENTAL listings here right now (not sales)? A rising rental-DOM trend means longer vacancies and softer asking-rent achievability than the comps imply.
- What's the recent tenant-quality profile in this submarket — average credit score on applications, eviction rate, late-payment / NSF rate, and stable-employment percentage? A property-management company in the area should have these aggregated.
- How much new for-sale + rental construction is in the pipeline within 1–3 miles? Heavy new supply typically softens prices + rents 12–24 months out; constrained supply supports both.
Investment metrics
- 1% rule
- 1.01% ✓
- Cap rate
- 8.45%
- Cash-on-cash
- 7.69%
- DSCR
- 1.34
- GRM
- 8.3
CMA / ARV
- ARV (on-the-fly)
- $234,400
- Comps found
- 12
Show comp detail 12 sales within ~0.75 mi
| Address | Dist | Beds/Ba | Sqft | Sold | Price | $/sf | Match |
|---|---|---|---|---|---|---|---|
| 11399 Lumpkin St | 0.03mi | 5/3.0 | 1,350 (-8%) | 1mo | $208,000 | $154 | 80 |
| 2089 Trowbridge St | 0.12mi | 4/2.0 (-1) | 1,440 (-2%) | 9mo | $230,000 | $160 | 79 |
| 11521 Lumpkin St | 0.10mi | 4/2.0 (-1) | 1,569 (+7%) | 0mo | $260,000 | $166 | 78 |
| 11524 Nagel St | 0.14mi | 5/2.0 | 1,600 (+9%) | 5mo | $245,000 | $153 | 74 |
| 2007 Evaline St | 0.27mi | 4/2.0 (-1) | 1,500 (+2%) | 9mo | $200,000 | $133 | 71 |
| 11631 Fleming St | 0.15mi | 4/2.0 (-1) | 1,320 (-10%) | 8mo | $220,000 | $167 | 65 |
| 2700 Trowbridge St | 0.31mi | 4/3.0 (-1) | 1,382 (-6%) | 9mo | $305,000 | $221 | 60 |
| 12045 Mcdougall St | 0.54mi | 4/1.5 (-1) | 1,495 (+2%) | 10mo | $255,000 | $171 | 56 |
| 11357 Moran St | 0.70mi | 4/2.0 (-1) | 1,440 (-2%) | 11mo | $238,000 | $165 | 50 |
| 2343 Edwin St | 0.35mi | 4/2.0 (-1) | 1,650 (+13%) | 9mo | $220,000 | $133 | 50 |
| 11334 Klinger St | 0.67mi | 4/2.0 (-1) | 1,612 (+10%) | 0mo | $235,000 | $146 | 47 |
| 600 Harmon St | 0.73mi | 4/1.0 (-1) | 1,375 (-6%) | 6mo | $57,000 | $41 | 41 |
Match score weights: distance 35% · size 25% · config 20% · recency 20%. Top-matched comps best support the ARV.
Projected returns pro-forma
-3.0% appreciation · 3.0% rent growth · sell at horizon
- IRR
- -4.6%
- Equity multiple
- 0.83×
- Total profit
- $-7,919
- Equity at exit
- $24,602
- IRR
- 5.1%
- Equity multiple
- 1.37×
- Total profit
- $17,200
- Equity at exit
- $14,266
Cash invested: $46,200 (down + closing). Projections, not guarantees.
Landlord ↔ Tenant lean methodology
- Overall (STATE)
- 62 Landlord-Friendly
- State Michigan
- 62 Landlord-Friendly · EVEN
- County
- — inherits STATE
- City
- — inherits STATE
ZIP-level market 48212
- Home prices YoY
- -34.2%
- Active inventory
- 166
- Price-to-rent
- 8.3×
Monthly cashflow live
- Estimated rent
- $1,666 high interval (Pro) →
- Mortgage (P&I)
- −$865
- Tax from tax record
- −$86 /mo · $1,029/yr
- Insurance
- −$69
- HOA
- −$0
- Vacancy / Maint / Mgmt
- −$350
- Net cashflow
- $296
Break-even live
UW: 25.0% down · 7.5% · 30yr · 1.5% tax · 5.0% vac · 8.0% maint · 8.0% mgmt
Financing live
Cash to close
- Down payment
- $41,250
- Closing costs
- $4,950
- Reserves months
- —
- Total cash needed
- —
Loan-product check · same deal, 3 products live
Conventional
25% down · 7.5% · 30yr
- Down + closing
- —
- Monthly P&I
- —
- Monthly cashflow
- —
- DSCR
- —
- Eligible?
- —
Personal DTI + credit; lowest rate.
DSCR
20% down · 8.5% · 30yr
- Down + closing
- —
- Monthly P&I
- —
- Monthly cashflow
- —
- DSCR
- —
- Eligible?
- —
No personal income docs; deal must DSCR.
Hard money
10% down · 12.0% · 12mo
- Down + closing
- —
- Monthly P&I
- —
- Monthly cashflow
- —
- DSCR
- —
- Eligible?
- —
Short-term bridge; refi at stabilization.
Rent comps 7 comps
| Address | Beds | Baths | Sqft | Rent | $/sqft | DOM | Units | Dist |
|---|---|---|---|---|---|---|---|---|
| 520 Englewood St Detroit, MI | 4.0 | 1.5 | 1086 | $1,725 | $1.59 | 24d | 1 | 0.78mi |
| 165 Rhode Island St Highland Park, MI | 4.0 | 1.5 | 1639 | $1,200 | $0.73 | 17d | 1 | 0.97mi |
| 101 Colorado St Unit NA Highland Park, MI | 4.0 | 1.5 | 1695 | $1,500 | $0.88 | 24d | 1 | 1.11mi |
| 168 Beresford St Highland Park, MI | 4.0 | 1.0 | 1541 | $1,475 | $0.96 | 17d | 1 | 1.22mi |
| 41 Richton St Highland Park, MI | 5.0 | 2.0 | 1871 | $1,800 | $0.96 | 2d | 1 | 1.30mi |
| 41 Richton St Highland Park, MI | 5.0 | 2.0 | 1871 | $1,800 | $0.96 | 14d | 1 | 1.30mi |
| 64 Glendale St Highland Park, MI | 4.0 | 1.0 | 1464 | $1,500 | $1.02 | 10d | 1 | 1.45mi |
Listing history 4 events
-
2026-06-15days on market $165,000 Active 7 DOM
-
2026-06-13days on market $165,000 Active 5 DOM
-
2026-06-08remarks 699-char remark
Show marketing remark (793 chars)
Excellent investment opportunity in the heart of Hamtramck! This well-maintained multi-family property features two spacious units, offering a total of 5 bedrooms and 2 full bathrooms. The first unit includes 2 bedrooms and 1 full bath, while the second unit offers 3 bedrooms and 1 full bath, providing flexible living arrangements for owner-occupants, multi-generational families, or investors seeking rental income. Conveniently located near shopping, dining, schools, parks, and major freeways, this property offers easy access to Downtown Detroit and surrounding communities. Whether you're looking to expand your investment portfolio or occupy one unit while generating income from the other, this versatile property presents a fantastic opportunity. Schedule your private showing today!
-
2026-06-08$165,000 Active 1 DOM
Show marketing remark (793 chars)
Excellent investment opportunity in the heart of Hamtramck! This well-maintained multi-family property features two spacious units, offering a total of 5 bedrooms and 2 full bathrooms. The first unit includes 2 bedrooms and 1 full bath, while the second unit offers 3 bedrooms and 1 full bath, providing flexible living arrangements for owner-occupants, multi-generational families, or investors seeking rental income. Conveniently located near shopping, dining, schools, parks, and major freeways, this property offers easy access to Downtown Detroit and surrounding communities. Whether you're looking to expand your investment portfolio or occupy one unit while generating income from the other, this versatile property presents a fantastic opportunity. Schedule your private showing today!
ⓘ Source: listings_history table (triggers on properties + properties_extension) + one-shot
backfill from property_details.listing_events for pre-trigger history.
Tax reassessment forecast MI · Partial reset (capped growth)
- Current annual tax
- $1,029 · $86/mo
- Projected year-2 tax
- $1,785 · $149/mo
- Expected delta
- +$756/yr (+$63/mo · 73.4%)
ⓘ Screening estimate from a state-policy table — verify with the county assessor before closing.
Climate risk First Street
- Flood 1/10 Low FEMA zone X (unshaded) · 0% chance over 30 yrs
- Wildfire 1/10 Low
- Heat 3/10 Moderate 7 d/yr ≥96°F today · 15 d/yr by 30 yrs out
- Wind 2/10 Low
- Air quality 4/10 Moderate 4 unhealthy d/yr today · 6 by 30 yrs out
Nearby sold comps map
Loading sold comps map…
Walkable amenities ~0.75 mi
Loading nearby amenities…
Taxation est. · year 1
- Rental income
- $19,990
- − Mortgage interest
- −$9,243
- − Property taxes
- −$1,029
- − Insurance
- −$825
- − Repairs & maintenance
- −$1,599
- − Management
- −$1,599
- − Depreciation
- −$4,800
- Taxable income
- $895
- Est. tax owed @ 24.0%
- −$215
- After-tax cash flow
- $3,340/yr
For passive investors: Depreciation is non-cash, so a rental often shows a tax loss while cash-flowing — sheltering income. Rental losses are passive: they offset passive income freely, and up to $25,000/yr can offset ordinary (W-2) income if you actively participate and your MAGI is under $100k (phasing out to $0 by $150k); unused losses carry forward. On sale, claimed depreciation is recaptured at up to 25%, and gains may owe capital-gains tax (a 1031 exchange can defer both). Figures are a year-1 estimate at your 24.0% rate — not tax advice; consult a CPA.
Schools (NCES district)
- District
- Hamtramck School District
- NCES district ID
- 2617520
- Math proficiency
- 9% ▼ -10.00%
- Reading proficiency
- 17% ▼ -4.00%
- Median HH income
- $24,551
- Composite
- 9.65/100
- National rank
- #9839
- State rank
- #519 of 540 in MI
Livability — Hamtramck
- Score
- 79/100
- State rank
- #88
- US rank
- #2005
Category grades
Schools grade is shown separately in the Schools card above.
Census & demographics
- Census place
- Hamtramck, MI
- County
- Wayne County · 1,562,939 people
- City population
- 43,384
- Metro
- Detroit-Warren-Dearborn, MI
- Population (ZIP)
- 43,384
- Household income
- $38,186
- Rent vs Own
- Severe rent burden
- 1175.0
Population outlook (Wayne County) Hauer SSP2
- Today (2025)
- 1,675,273 people
- By 2030
- 1,620,300 · -3.3%
- By 2040
- 1,502,341 · -10.3%
- By 2050
- 1,384,039 · -17.4%
- By 2075
- 1,124,592 · -32.9%
- By 2100
- 881,193 · -47.4%
Race, ethnicity, and origin ACS 2023
- Neighborhood character
- Diverse neighborhood (Simpson 0.70)
- Race & ethnicity
- White 43% Asian 29% Black 19% Two or more races 6%
- Common ancestry
- Romanian 4% Subsaharan African 1% American 1%
- Foreign-born
- 41%
- Languages at home
- 36% English-only · Other Indo-European 28% Arabic 28% Russian/Polish/Slavic 6%
Political lean MEDSL · Wayne
- 2024 margin
- Strong D (+29.0) · D 62.7% · R 33.7% · Other 3.6%
- 2008→2024 swing
- -20.5pp toward R · 2008: 49.5pp · 2024: 29.0pp
- All cycles
- 2024: D+29.0 2020: D+38.1 2016: D+37.3 2012: D+46.9 2008: D+49.5
Not yet ingested
- Civics
- —
Market trends
- HPI YoY
- ▼ -152.41%
- Current HPI
- 292.9126
- Rent YoY
- —
- Metro
- Detroit-Warren-Dearborn, MI
- State GDP YoY
- ▲ 1.37%
- F500 in state
- 28
Industry mix (Fortune 500 HQ in MI)
| Industry | F500 HQs | Revenue |
|---|---|---|
| Automotive Parts | 3 | $48B |
|
||
| Automotive | 2 | $372B |
|
||
| Chemicals | 1 | $45B |
|
||
| Automotive Retail | 1 | $29B |
|
||
| Healthcare / Medical Devices | 1 | $23B |
|
||
| Automotive Technology | 1 | $20B |
|
||
Price history
+1037.9% since first listed6 events — show timeline
- 2026-06-08 Listed $165,000 MiRealSource-MiMLS
- 2026-06-08 Listed $165,000 REALCOMP
- 2013-10-08 Sold (MLS) $14,500 MiRealSource-MiMLS
- 2013-10-08 Sold (MLS) $14,500 REALCOMP
- 2013-09-03 Listed $14,500 MiRealSource-MiMLS
- 2013-09-03 Listed $14,500 REALCOMP
Property tax history
+1.1%/yrLatest (2025): $1,029 · +1.1% YoY. Source: county tax records.
Cash-flow waterfall
monthlySold comps — $/sqft
last 12 mo · ≤1 miLoading sold comps…