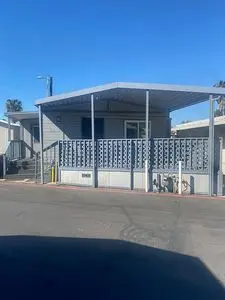
255 E Bradley Ave · Bostonia, CA
Flood risk 6/10 · Moderate
- FEMA flood zone
- X (unshaded)
- Chance of flooding over 30 yrs
- 0.73%
- Est. flood insurance / yr
- $507 – $1,088
Fire risk 1/10 · Minimal
- Est. fire insurance / yr
- $659 – $1,223
Heat risk 5/10 · Moderate
- Hot days now (above 98°F)
- 6 days/yr
- Hot days in 30 yrs
- 18 days/yr
Wind risk 1/10 · Minimal
- Chance of severe wind over 30 yrs
- —
Air-quality risk 3/10 · Minor
- Unhealthy air days now
- 4 days/yr
- Unhealthy air days in 30 yrs
- 4 days/yr
Risk factors via First Street. Map © Google.
Why this score? — see what drove the B- grade
The composite is a weighted blend of 9 inputs, each scored 0–100. Each bar is that input's sub-score; the figure is the points it added to the 100-point composite (weight × sub-score).
- Cash flow +30.0/30.0
- 1% rule +10.0/10.0
- DSCR +10.0/10.0
- ARV discount +7.5/15.0
- Schools +4.0/10.0
- Livability +3.2/5.0
- Condition / age +2.5/5.0
- Rent growth +2.3/5.0
- Appreciation +0.0/10.0
$139,900
🖨 Deal sheet 📄 Offer letter ✓ Due diligence
Listing remarks MLS
This adorable home won't last long. Come and see this charming 2 Bedroom 2 Bathroom home. It features updated flooring, central air conditioning, a gas range, front loading washer, dry and refrigerator stay. It is conveniently located in the back of the park close to leasing office, pool and directly across from community park and guest parking. Located close to shopping centers with easy access to Hwy 67, 8 and 52. Bring offers and start 2017 in your new home.
Key facts
- Air conditioning
- Well-maintained pool
- Upgraded kitchen
Tags
Neighborhood map
What this means for you Summary
Snapshot
- This is a 2-bed/2.0-bath land listed at $140k.
Deal economics
- At list price, monthly cash flow is $1k ($13k/yr) — positive.
- The deal already cash-flows at list — no discount required.
- Meets the 1% rule at list price ($3k rent vs $140k).
- Recommended offer: $138k (1.5% below list) — sets the bar for market timing.
- Cap rate 15.9% vs local median 6.0% in Bostonia — top-decile yield for the area; either an underpriced asset or a hidden risk that comps aren't pricing in. Stress-test before assuming the spread holds.
Location & tenants
- Location reads 65/100 on livability (#383 in CA) — a middle-class / working-renter tenant base. Strengths: commute A+, housing B+; Watch: schools D, crime F, amenities F.
- Grossmont Union High (suburban): math 31% / reading 60% proficiency, ranked #173 of 517 in CA (top 34%) — families likely to look elsewhere, expect single-tenant / working-renter base with shorter leases; only 17% free/reduced lunch — higher-income household profile.
- Market conditions: Rents soft (-0.8%/yr); 238 active listings in the ZIP; 2 comparable units currently listed for rent nearby; 11,759 units permitted in San Diego County in 2024 (7,244 in 5+ unit buildings).
- This rent runs 43% of the median local income ($74k/yr) — at the standard rent-burdened threshold; future hikes will face affordability resistance.
Forward outlook
- Local home prices are declining (-3.0%/yr); year-one equity from $967 of loan paydown is wiped out by about $4k of value loss. Plan a longer hold.
- San Diego County population projected at +20% by 2050 — long-run rental-demand tailwind backs the buy-and-hold thesis.
- At projected returns (-3.0% appreciation + 0.0% rent growth), your $39k cash investment doubles in ~4 years — after that, you're playing with house money.
Negotiation context
- It's been on market 23 days — a 2% lower offer ($138k) is reasonable based on typical stale-listing flexibility.
- 48 sale attempts since 30y ago with the ask held roughly flat each time — persistent listings suggest the price (not the market) is what's stuck; bring a comps-based counter.
- Current owner paid $24k; list at $140k implies a 483% gain — meaningful room to come down on a strong offer.
Risks & watch-outs
- Climate carrying-cost: major flood risk; extreme-heat days projected 6→18/yr by 2055 (HVAC capex compounding) — expect insurance premiums to compound above CPI over the hold.
Questions for the listing agent
- Built in 1978 — when were the roof, HVAC, electrical panel, plumbing, and water heater last replaced?
- Is there a deadline driving the sale (1031 exchange, divorce, estate, relocation)? That informs how much negotiation room exists.
- Schools are D-rated, which usually means shorter tenancies and higher turnover. Who's the typical renter profile here, and what's been the actual vacancy rate?
- Crime grade is F in this area — have there been break-ins, vandalism, or insurance claims at this property in the last 3 years? What carrier currently insures it and at what premium?
- What's the average days-on-market for RENTAL listings here right now (not sales)? A rising rental-DOM trend means longer vacancies and softer asking-rent achievability than the comps imply.
- What's the recent tenant-quality profile in this submarket — average credit score on applications, eviction rate, late-payment / NSF rate, and stable-employment percentage? A property-management company in the area should have these aggregated.
- How much new for-sale + rental construction is in the pipeline within 1–3 miles? Heavy new supply typically softens prices + rents 12–24 months out; constrained supply supports both.
Investment metrics
- 1% rule
- 1.89% ✓
- Cap rate
- 15.89%
- Cash-on-cash
- 34.27%
- DSCR
- 2.53
- GRM
- 4.4
CMA / ARV
No comps found within radius.
Projected returns pro-forma
-3.0% appreciation · 0.0% rent growth · sell at horizon
- IRR
- 26.2%
- Equity multiple
- 2.04×
- Total profit
- $40,891
- Equity at exit
- $20,860
- IRR
- 32.0%
- Equity multiple
- 3.49×
- Total profit
- $97,626
- Equity at exit
- $12,096
Cash invested: $39,172 (down + closing). Projections, not guarantees.
Landlord ↔ Tenant lean methodology
- Overall (STATE)
- 18 Strongly Tenant-Friendly
- State California
- 18 Strongly Tenant-Friendly · D+13
- County
- — inherits STATE
- City
- — inherits STATE
ZIP-level market 92021
- Rents YoY
- -0.8%
- Active inventory
- 238
- Price-to-rent
- 4.4×
Monthly cashflow live
- Estimated rent
- $2,640 medium interval (Pro) →
- Mortgage (P&I)
- −$734
- Tax est. 1.5%
- −$175 /mo · $2,098/yr
- Insurance
- −$58
- HOA
- −$0
- Vacancy / Maint / Mgmt
- −$554
- Net cashflow
- $1,119
Break-even live
UW: 25.0% down · 7.5% · 30yr · 1.5% tax · 5.0% vac · 8.0% maint · 8.0% mgmt
Financing live
Cash to close
- Down payment
- $34,975
- Closing costs
- $4,197
- Reserves months
- —
- Total cash needed
- —
Loan-product check · same deal, 3 products live
Conventional
25% down · 7.5% · 30yr
- Down + closing
- —
- Monthly P&I
- —
- Monthly cashflow
- —
- DSCR
- —
- Eligible?
- —
Personal DTI + credit; lowest rate.
DSCR
20% down · 8.5% · 30yr
- Down + closing
- —
- Monthly P&I
- —
- Monthly cashflow
- —
- DSCR
- —
- Eligible?
- —
No personal income docs; deal must DSCR.
Hard money
10% down · 12.0% · 12mo
- Down + closing
- —
- Monthly P&I
- —
- Monthly cashflow
- —
- DSCR
- —
- Eligible?
- —
Short-term bridge; refi at stabilization.
Rent comps 2 comps
| Address | Beds | Baths | Sqft | Rent | $/sqft | DOM | Units | Dist |
|---|---|---|---|---|---|---|---|---|
| 375 Broadway El Cajon, CA | 2.0 | 1.0 | 1400 | $2,800 | $2.00 | 1d | 1 | 0.66mi |
| 339 Chambers St El Cajon, CA | 3.0 | 2.5 | 1600 | $3,500 | $2.19 | 20d | 1 | 1.33mi |
Listing history 50 events
-
2026-06-18days on market $139,900 Active 23 DOM
-
2026-06-17days on market $139,900 Active 22 DOM
-
2026-06-16days on market $139,900 Active 21 DOM
-
2026-06-15days on market $139,900 Active 20 DOM
-
2026-06-13days on market $139,900 Active 18 DOM
-
2026-06-13days on market $139,900 Active 17 DOM
-
2026-06-09days on market $139,900 Active 14 DOM
-
2026-06-08days on market $139,900 Active 13 DOM
-
2026-06-07days on market $139,900 Active 12 DOM
-
2026-06-04days on market $139,900 Active 9 DOM
-
2026-06-03days on market $139,900 Active 8 DOM
-
2026-06-02days on market $139,900 Active 7 DOM
-
2026-06-01days on market $139,900 Active 6 DOM
-
2026-05-31days on market $139,900 Active 5 DOM
-
2026-05-26$139,900 Active
-
2017-01-13soldstatus $24,000 Sold 466-char remark
Show marketing remark (466 chars)
This adorable home won't last long. Come and see this charming 2 Bedroom 2 Bathroom home. It features updated flooring, central air conditioning, a gas range, front loading washer, dry and refrigerator stay. It is conveniently located in the back of the park close to leasing office, pool and directly across from community park and guest parking. Located close to shopping centers with easy access to Hwy 67, 8 and 52. Bring offers and start 2017 in your new home.
-
2016-12-27status Pending 466-char remark
Show marketing remark (466 chars)
This adorable home won't last long. Come and see this charming 2 Bedroom 2 Bathroom home. It features updated flooring, central air conditioning, a gas range, front loading washer, dry and refrigerator stay. It is conveniently located in the back of the park close to leasing office, pool and directly across from community park and guest parking. Located close to shopping centers with easy access to Hwy 67, 8 and 52. Bring offers and start 2017 in your new home.
-
2016-12-11$29,500 Active 466-char remark
Show marketing remark (466 chars)
This adorable home won't last long. Come and see this charming 2 Bedroom 2 Bathroom home. It features updated flooring, central air conditioning, a gas range, front loading washer, dry and refrigerator stay. It is conveniently located in the back of the park close to leasing office, pool and directly across from community park and guest parking. Located close to shopping centers with easy access to Hwy 67, 8 and 52. Bring offers and start 2017 in your new home.
-
2010-03-01soldstatus $3,067,000
-
2007-12-02historical
-
2007-10-31historical
-
2007-09-26$49,900
-
2007-09-06historical
-
2007-08-01historical
-
2007-08-01historical
-
2007-07-15historical
-
2007-07-06$54,900
-
2007-06-30historical
-
2007-05-28$119,000
-
2007-05-28$119,000
-
2007-04-30$60,000
-
2007-04-15historical
-
2007-04-01$55,000
-
2007-03-31historical
-
2007-02-27$55,000
-
2007-02-13historical
-
2007-02-13historical
-
2006-11-08historical
-
2006-11-08historical
-
2006-10-15$74,500
-
2006-08-14$80,000
-
2006-08-14$80,000
-
2006-08-08historical
-
2006-08-08$35,000
-
2006-08-08$35,000
-
2006-07-16$91,900
-
2006-06-30soldstatus $29,000
-
2006-05-15historical
-
2006-03-27$41,000
-
2006-03-22historical
ⓘ Source: listings_history table (triggers on properties + properties_extension) + one-shot
backfill from property_details.listing_events for pre-trigger history.
Climate risk First Street
- Flood 6/10 Major FEMA zone X (unshaded) · 73% chance over 30 yrs
- Wildfire 1/10 Low
- Heat 5/10 Major 6 d/yr ≥98°F today · 18 d/yr by 30 yrs out
- Wind 1/10 Low
- Air quality 3/10 Moderate 4 unhealthy d/yr today · 4 by 30 yrs out
Nearby sold comps map
Loading sold comps map…
Walkable amenities ~0.75 mi
Loading nearby amenities…
Taxation est. · year 1
- Rental income
- $31,681
- − Mortgage interest
- −$7,837
- − Property taxes
- −$2,098
- − Insurance
- −$700
- − Repairs & maintenance
- −$2,534
- − Management
- −$2,534
- − Depreciation
- −$4,070
- Taxable income
- $11,907
- Est. tax owed @ 24.0%
- −$2,858
- After-tax cash flow
- $10,568/yr
For passive investors: Depreciation is non-cash, so a rental often shows a tax loss while cash-flowing — sheltering income. Rental losses are passive: they offset passive income freely, and up to $25,000/yr can offset ordinary (W-2) income if you actively participate and your MAGI is under $100k (phasing out to $0 by $150k); unused losses carry forward. On sale, claimed depreciation is recaptured at up to 25%, and gains may owe capital-gains tax (a 1031 exchange can defer both). Figures are a year-1 estimate at your 24.0% rate — not tax advice; consult a CPA.
Schools (NCES district)
- District
- Grossmont Union High
- NCES district ID
- 0616230
- Math proficiency
- 31% ▼ -1.00%
- Reading proficiency
- 60% ▲ 5.00%
- Median HH income
- $61,801
- Composite
- 40.07/100
- National rank
- #3810
- State rank
- #173 of 517 in CA
Livability — Bostonia
- Score
- 65/100
- State rank
- #383
- US rank
- #13065
Category grades
Schools grade is shown separately in the Schools card above.
Census & demographics
- Census place
- Bostonia, CA
- County
- San Diego County · 3,178,799 people
- Metro
- San Diego-Chula Vista-Carlsbad, CA
- Population (ZIP)
- 70,501
- Household income
- $74,013
- Rent vs Own
- Severe rent burden
- 4178.0
Population outlook (San Diego County) Hauer SSP2
- Today (2025)
- 3,678,185 people
- By 2030
- 3,856,546 · +4.8%
- By 2040
- 4,171,407 · +13.4%
- By 2050
- 4,421,607 · +20.2%
- By 2075
- 4,831,599 · +31.4%
- By 2100
- 4,832,502 · +31.4%
Race, ethnicity, and origin ACS 2023
- Neighborhood character
- Diverse neighborhood (Simpson 0.62)
- Race & ethnicity
- White 54% Hispanic / Latino 28% Two or more races 14% Black 6% Asian 5% Native American 2%
- Hispanic origin (detail)
- Mexican 24%
- Common ancestry
- Arab 6% Italian 2% Lithuanian 2%
- Foreign-born
- 22% · Canada
- Languages at home
- 65% English-only · Spanish 18% Arabic 7% Other Indo-European 3%
Political lean MEDSL · San Diego
- 2024 margin
- D (+16.8) · D 56.9% · R 40.1% · Other 2.9%
- 2008→2024 swing
- +6.6pp toward D · 2008: 10.2pp · 2024: 16.8pp
- All cycles
- 2024: D+16.8 2020: D+22.8 2016: D+17.8 2012: D+5.1 2008: D+10.2
Not yet ingested
- Civics
- —
Market trends
- HPI YoY
- ▼ -654.88%
- Current HPI
- 335.0617
- Rent YoY
- ▼ -0.83%
- Metro
- San Diego-Chula Vista-Carlsbad, CA
- State GDP YoY
- ▲ 3.21%
- F500 in state
- 116
Industry mix (Fortune 500 HQ in CA)
| Industry | F500 HQs | Revenue |
|---|---|---|
| Technology | 27 | $1,492B |
|
||
| Financial Services | 3 | $174B |
|
||
| Retail | 3 | $44B |
|
||
| Insurance | 3 | $26B |
|
||
| Media / Entertainment | 2 | $115B |
|
||
| Pharmaceuticals / Biotech | 2 | $62B |
|
||
Price history
+211.6% since first listed97 events — show timeline
- 2026-05-26 Listed $139,900 FSBO.com
- 2017-01-13 Sold (MLS) $24,000 SDMLS
- 2016-12-27 Pending — SDMLS
- 2016-12-11 Listed $29,500 SDMLS
- 2010-03-01 Sold (Public Records) $3,067,000 Public Records
- 2007-12-02 Listing Removed — CRMLS
- 2007-10-31 Listing Removed — SDMLS
- 2007-09-26 Listed $49,900 CRMLS
- 2007-09-06 Listing Removed — CRMLS
- 2007-08-01 Listing Removed — CRMLS
- 2007-08-01 Listing Removed — SDMLS
- 2007-07-15 Listing Removed — CRMLS
- 2007-07-06 Listed $54,900 CRMLS
- 2007-06-30 Listing Removed — CRMLS
- 2007-05-28 Listed $119,000 CRMLS
- 2007-05-28 Listed $119,000 SDMLS
- 2007-04-30 Listed $60,000 SDMLS
- 2007-04-15 Listing Removed — SDMLS
- 2007-04-01 Listed $55,000 CRMLS
- 2007-03-31 Listing Removed — CRMLS
- 2007-02-27 Listed $55,000 CRMLS
- 2007-02-13 Listing Removed — SDMLS
- 2007-02-13 Listing Removed — CRMLS
- 2006-11-08 Listing Removed — SDMLS
- 2006-11-08 Listing Removed — CRMLS
- 2006-10-15 Listed $74,500 SDMLS
- 2006-08-14 Listed $80,000 SDMLS
- 2006-08-14 Listed $80,000 CRMLS
- 2006-08-08 Listing Removed — CRMLS
- 2006-08-08 Listed $35,000 SDMLS
- 2006-08-08 Listed $35,000 CRMLS
- 2006-07-16 Listed $91,900 CRMLS
- 2006-06-30 Sold (MLS) $29,000 CRMLS
- 2006-05-15 Listing Removed — SDMLS
- 2006-03-27 Listed $41,000 CRMLS
- 2006-03-22 Listing Removed — CRMLS
- 2006-03-22 Listing Removed — SDMLS
- 2006-02-07 Listing Removed — SDMLS
- 2006-02-05 Listed $28,000 CRMLS
- 2006-01-19 Listing Removed — CRMLS
- 2006-01-19 Listing Removed — SDMLS
- 2006-01-17 Listed $54,900 SDMLS
- 2005-12-31 Listing Removed — CRMLS
- 2005-12-31 Listing Removed — SDMLS
- 2005-10-11 Listing Removed — SDMLS
- 2005-10-11 Listing Removed — CRMLS
- 2005-10-09 Listed $90,000 SDMLS
- 2005-10-03 Listed $75,000 CRMLS
- 2005-10-03 Listed $75,000 SDMLS
- 2005-09-16 Sold (MLS) $30,000 CRMLS
- 2005-08-03 Listed $99,500 CRMLS
- 2005-08-03 Listed $99,500 SDMLS
- 2005-05-09 Listed $40,000 CRMLS
- 2005-04-13 Listed $60,000 SDMLS
- 2005-04-13 Listed $60,000 CRMLS
- 2005-03-17 Listing Removed — CRMLS
- 2005-03-14 Listing Removed — CRMLS
- 2005-03-14 Listing Removed — SDMLS
- 2005-01-31 Listing Removed — SDMLS
- 2005-01-16 Listed $69,900 CRMLS
- 2005-01-16 Listed $69,900 SDMLS
- 2005-01-11 Listing Removed — CRMLS
- 2004-09-29 Listed $70,000 CRMLS
- 2004-09-28 Listed $89,000 CRMLS
- 2004-09-21 Listing Removed — SDMLS
- 2004-09-21 Listing Removed — CRMLS
- 2004-08-17 Listed $49,000 CRMLS
- 2004-08-17 Listed $49,000 SDMLS
- 2004-07-13 Listed $85,000 SDMLS
- 2004-03-25 Listed $90,000 SDMLS
- 2004-03-25 Listed $90,000 CRMLS
- 2003-10-22 Listing Removed — CRMLS
- 2003-10-22 Listing Removed — SDMLS
- 2003-07-15 Sold (MLS) $56,000 CRMLS
- 2003-06-04 Listing Removed — SDMLS
- 2003-04-23 Listed $88,900 CRMLS
- 2003-04-23 Listed $88,900 SDMLS
- 2003-01-29 Listed $59,900 CRMLS
- 2002-11-04 Listed $55,000 SDMLS
- 2002-10-30 Sold (MLS) $60,000 CRMLS
- 2002-06-25 Listed $67,000 CRMLS
- 2000-07-20 Listing Removed — CRMLS
- 2000-07-20 Listing Removed — SDMLS
- 2000-06-08 Listed $39,000 CRMLS
- 2000-06-08 Listed $39,000 SDMLS
- 1998-11-25 Sold (MLS) $17,000 CRMLS
- 1998-09-24 Listed $17,500 CRMLS
- 1998-08-11 Sold (MLS) $18,500 CRMLS
- 1998-03-06 Listing Removed — CRMLS
- 1998-03-06 Listing Removed — SDMLS
- 1998-01-08 Listed $19,500 CRMLS
- 1997-09-06 Listed $29,900 CRMLS
- 1997-09-06 Listed $29,900 SDMLS
- 1997-05-05 Listing Removed — CRMLS
- 1997-05-05 Listing Removed — SDMLS
- 1996-11-05 Listed $44,900 CRMLS
- 1996-11-05 Listed $44,900 SDMLS
Property tax history
+58.9%/yrLatest (2025): $255,939 · +0.5% YoY. Source: county tax records.
Cash-flow waterfall
monthlySold comps — $/sqft
last 12 mo · ≤1 miLoading sold comps…