 8-Plex
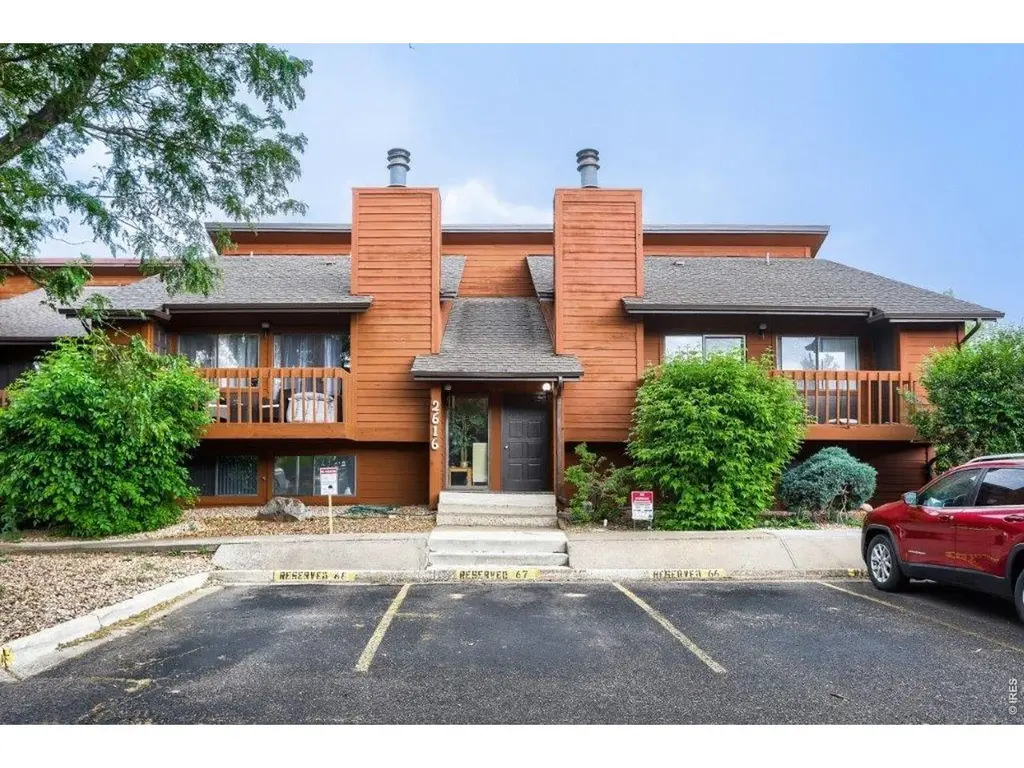
2616 Juniper Ave · Boulder, CO
Flood risk 1/10 · Minimal
- FEMA flood zone
- X (unshaded)
- Chance of flooding over 30 yrs
- 0.0%
- Est. flood insurance / yr
- $507 – $1,088
Fire risk 7/10 · Major
- Est. fire insurance / yr
- $939 – $1,743
Heat risk 3/10 · Minor
- Hot days now (above 92°F)
- 6 days/yr
- Hot days in 30 yrs
- 16 days/yr
Wind risk 1/10 · Minimal
- Chance of severe wind over 30 yrs
- —
Air-quality risk 2/10 · Minimal
- Unhealthy air days now
- 2 days/yr
- Unhealthy air days in 30 yrs
- 2 days/yr
Risk factors via First Street. Map © Google.
Why this score? — see what drove the C grade
The composite is a weighted blend of 9 inputs, each scored 0–100. Each bar is that input's sub-score; the figure is the points it added to the 100-point composite (weight × sub-score).
- Cash flow +22.5/30.0
- ARV discount +7.5/15.0
- DSCR +7.2/10.0
- 1% rule +6.7/10.0
- Schools +5.1/10.0
- Livability +3.9/5.0
- Condition / age +3.8/5.0
- Rent growth +3.0/5.0
- Appreciation +0.0/10.0
$2,295,000
🖨 Deal sheet (PDF) 📄 Offer letter ✓ Due diligence
Multi-family units
County records classify this as Multi-Family (5+ Unit). Listing-text estimate: 8 units. confirmed
5+ unit building — per-unit beds/baths from public records are typically unavailable; the breakdown below (if shown) is an estimate from the listing text.
Listing remarks MLS
8 unit building in Willow Springs. Near new Safeway, retail, many restaurants and bus lines; 2 blocks from neighborhood park. HOA maintained swimming pool and tennis courts. Fireplaces and balconies/ patios in all but 2 units. All units leased to August of 2003. Building is condominiumized so units can be fixed up and sold off seperately. Tenants pay electric bills and water/sewer. Trash/ lawn care included in HOA fees.Flood Verification Pending
Key facts
- Fireplaces
- Balconies
- Updated flooring
Tags
Property features AI
Finance
- Other: Community amenities include tennis courts and a pool; Total of 8 units
- Financial info: Gross income: $162,300; Net operating income: $121,527; Income includes lease/rents; Tenants pay electricity, water and sewer
- HOA & community: Willow Springs HOA with monthly fee ($1,576) — fee includes common amenities, trash, snow removal, grounds maintenance, management and utilities; Association has reserves and a transfer fee
Exterior
- Parking: One parking space per unit
- Utilities: City water with water meter installed; Public sewer; Electricity available with separate meters; Cable available; High-speed internet available; Underground utilities
- Home design: Residential income property (multi-family); Two levels; Not new — previously owned; Zoned XBO
- Construction: Wood frame construction with cedar wood siding (painted/stained); Composition roof
- Exterior features: Patio; Deck; Balcony; Evergreen and deciduous trees; Level lot; House faces south; Paved with curbs, gutters and sidewalks; Fire hydrant within 500 feet; City street frontage; Minimal flood risk or C rating
Interior
- Kitchen: Electric range; Dishwasher; Refrigerator; Microwave; Garbage disposal; All appliances included
- Bedrooms: Eight total units composed of multiple 1- and 2-bedroom units (see unit breakdown)
- Bathrooms: Multiple 1-bath units (see unit breakdown)
- Heating & cooling: Baseboard heating; Ceiling fans
- Interior features: Fire alarm; Two or more fireplaces
Neighborhood map
What this means for you Summary
Snapshot
- This is a 8 × 10-bed/8.0-bath units multifamily listed at $2.29M. Condition is rated good.
Deal economics
- At list price, monthly cash flow is $4k ($46k/yr) — positive. Per door: $483/mo.
- The deal already cash-flows at list — no discount required.
- Meets the 1% rule at list price ($27k rent vs $2.29M).
- Recommended offer: $2.26M (1.5% below list) — sets the bar for market timing.
- Cap rate 8.3% vs local median 1.7% in Boulder — top-decile yield for the area; either an underpriced asset or a hidden risk that comps aren't pricing in. Stress-test before assuming the spread holds.
Location & tenants
- Location reads 77/100 on livability (#24 in CO, #2,958 nationally) — a middle-class / working-renter tenant base. Strengths: amenities A+, commute A+, health & safety A+; Watch: crime D+, cost of living F.
- Boulder Valley School District No. Re2 (urban): math 49% / reading 67% proficiency, ranked #6 of 86 in CO (top 7%) — acceptable for families but not a draw, mixed tenant base, ~2y average lease; only 16% free/reduced lunch — higher-income household profile.
- Zoned schools: Columbine Elementary School (math 15% / reading 32%, grade F, #634 of 966 statewide, top 67%, 405 students, 64% FRL); Boulder High School (math 64% / reading 81%, grade B+, #18 of 381 statewide, top 4%, 2,074 students, 28% FRL) — zoned schools average 46% FRL vs 16% district-wide (30 pts higher); higher-poverty schools than district average — tighter screening recommended.
- Market conditions: Rents rising (+1.8%/yr); 258 active listings in the ZIP; high-income renter base; 1,688 units permitted in Boulder County in 2024 (1,136 in 5+ unit buildings).
- At $26,966/mo this rent would consume 256% of the median local household income ($127k/yr) (locally 891% of renters already pay >50% of income on rent) — very limited rent-growth headroom before tenants either downsize or default.
Forward outlook
- Local home prices are declining (-3.0%/yr); year-one equity from $16k of loan paydown is wiped out by about $69k of value loss. Plan a longer hold.
- Boulder County population projected at +40% by 2050 — long-run rental-demand tailwind backs the buy-and-hold thesis.
Negotiation context
- It's been on market 17 days — a 2% lower offer ($2.26M) is reasonable based on typical stale-listing flexibility.
- 2 sale attempts since 24y ago with the ask held roughly flat each time — persistent listings suggest the price (not the market) is what's stuck; bring a comps-based counter.
- Current owner paid $995k; list at $2.29M implies a 131% gain — meaningful room to come down on a strong offer.
Risks & watch-outs
- Climate carrying-cost: major wildfire risk — expect insurance premiums to compound above CPI over the hold.
Questions for the listing agent
- Can we see the unit-by-unit rent roll, current vacancy, and any below-market leases? What's the average tenancy length?
- What capital expenditures (roof, boiler, parking lot, exteriors) have been made in the last 5 years, and what's planned in the next 2?
- Built in 1978 — when were the roof, HVAC, electrical panel, plumbing, and water heater last replaced?
- What does the HOA fee cover, when was the last increase, and are there any pending special assessments or reserve-fund shortfalls?
- Is there a deadline driving the sale (1031 exchange, divorce, estate, relocation)? That informs how much negotiation room exists.
- Schools are B-rated — typically a magnet for longer-tenancy family renters. What's the average tenant stay here, and is there a school-zone premium baked into asking?
- Crime grade is D in this area — have there been break-ins, vandalism, or insurance claims at this property in the last 3 years? What carrier currently insures it and at what premium?
- What's the average days-on-market for RENTAL listings here right now (not sales)? A rising rental-DOM trend means longer vacancies and softer asking-rent achievability than the comps imply.
- What's the recent tenant-quality profile in this submarket — average credit score on applications, eviction rate, late-payment / NSF rate, and stable-employment percentage? A property-management company in the area should have these aggregated.
- How much new apartment / multifamily construction is in the pipeline within 1–3 miles? Heavy new supply (>2% of stock underway) typically softens rents 12–24 months out; light construction supports rent growth.
Investment metrics
- 1% rule
- 1.17% ✓
- Cap rate
- 8.31%
- Cash-on-cash
- 7.22%
- DSCR
- 1.32
- GRM
- 7.1
CMA / ARV
No comps found within radius.
Projected returns pro-forma
-3.0% appreciation · 1.82% rent growth · sell at horizon
- IRR
- -6.6%
- Equity multiple
- 0.76×
- Total profit
- $-155,874
- Equity at exit
- $342,192
- IRR
- 1.4%
- Equity multiple
- 1.09×
- Total profit
- $60,181
- Equity at exit
- $198,430
Cash invested: $642,600 (down + closing). Projections, not guarantees.
Landlord ↔ Tenant lean methodology
- Overall (STATE)
- 38 Tenant-Leaning
- State Colorado
- 38 Tenant-Leaning · D+4
- County
- — inherits STATE
- City
- — inherits STATE
ZIP-level market 80304
- Rents YoY
- 1.8%
- Active inventory
- 258
- Price-to-rent
- 56.7×
Monthly cashflow live
- Estimated rent
- $26,966 medium interval (Pro) →
- Mortgage (P&I)
- −$12,035
- Tax est. 1.5%
- −$2,869 /mo · $34,425/yr
- Insurance
- −$956
- HOA
- −$1,576
- Vacancy / Maint / Mgmt
- −$5,663
- Net cashflow
- $3,867
Break-even live
Sensitivity live
| Price | -10% $5,453 | -5% $4,660 | +0% $3,867 | +5% $3,074 | +10% $2,281 |
|---|---|---|---|---|---|
| Rent | -10% $1,737 | -5% $2,802 | +0% $3,867 | +5% $4,932 | +10% $5,997 |
| Rate | -1.0pp $5,023 | -0.5pp $4,451 | base $3,867 | +0.5pp $3,272 | +1.0pp $2,667 |
8-unit breakdown (identical units grouped — click to expand)
| Units | Beds | Baths | Est. rent |
|---|---|---|---|
| 8× units | 10 | 8 | $26,968 |
| #1 | 10 | 8 | $3,371 |
| #2 | 10 | 8 | $3,371 |
| #3 | 10 | 8 | $3,371 |
| #4 | 10 | 8 | $3,371 |
| #5 | 10 | 8 | $3,371 |
| #6 | 10 | 8 | $3,371 |
| #7 | 10 | 8 | $3,371 |
| #8 | 10 | 8 | $3,371 |
| Total (8 units) | $26,966 | ||
UW: 25.0% down · 7.5% · 30yr · 1.5% tax · 5.0% vac · 8.0% maint · 8.0% mgmt
Financing live
Cash to close
- Down payment
- $573,750
- Closing costs
- $68,850
- Reserves months
- —
- Total cash needed
- —
Loan-product check · same deal, 3 products live
Conventional
25% down · 7.5% · 30yr
- Down + closing
- —
- Monthly P&I
- —
- Monthly cashflow
- —
- DSCR
- —
- Eligible?
- —
Personal DTI + credit; lowest rate.
DSCR
20% down · 8.5% · 30yr
- Down + closing
- —
- Monthly P&I
- —
- Monthly cashflow
- —
- DSCR
- —
- Eligible?
- —
No personal income docs; deal must DSCR.
Hard money
10% down · 12.0% · 12mo
- Down + closing
- —
- Monthly P&I
- —
- Monthly cashflow
- —
- DSCR
- —
- Eligible?
- —
Short-term bridge; refi at stabilization.
HOA detail
- Monthly dues
- $1,576 · $18,912/yr
- Likely covers
- watersewertrashelectriclandscapingpool
Listing history 13 events
-
2026-06-21days on market $2,295,000 Active 17 DOM
-
2026-06-18days on market $2,295,000 Active 14 DOM
-
2026-06-17days on market $2,295,000 Active 13 DOM
-
2026-06-16days on market $2,295,000 Active 12 DOM
-
2026-06-15days on market $2,295,000 Active 11 DOM
-
2026-06-14days on market $2,295,000 Active 9 DOM
-
2026-06-13days on market $2,295,000 Active 8 DOM
-
2026-06-10days on market $2,295,000 Active 6 DOM
-
2026-06-09days on market $2,295,000 Active 5 DOM
-
2026-06-09days on market $2,295,000 Active 4 DOM
-
2026-06-07days on market $2,295,000 Active 3 DOM
-
2026-06-05remarks 524-char remark
-
2026-06-05$2,295,000 Active 1 DOM
ⓘ Source: listings_history table (triggers on properties + properties_extension) + one-shot
backfill from property_details.listing_events for pre-trigger history.
Climate risk First Street
- Flood 1/10 Low FEMA zone X (unshaded) · 0% chance over 30 yrs
- Wildfire 7/10 Severe
- Heat 3/10 Moderate 6 d/yr ≥92°F today · 16 d/yr by 30 yrs out
- Wind 1/10 Low
- Air quality 2/10 Low 2 unhealthy d/yr today · 2 by 30 yrs out
Nearby sold comps map
Loading sold comps map…
Walkable amenities ~0.75 mi
Loading nearby amenities…
Taxation est. · year 1
- Rental income
- $323,592
- − Mortgage interest
- −$128,556
- − Property taxes
- −$34,425
- − Insurance
- −$11,475
- − Repairs & maintenance
- −$25,887
- − Management
- −$25,887
- − HOA
- −$18,912
- − Depreciation
- −$66,764
- Taxable income
- $11,686
- Est. tax owed @ 24.0%
- −$2,805
- After-tax cash flow
- $43,598/yr
For passive investors: Depreciation is non-cash, so a rental often shows a tax loss while cash-flowing — sheltering income. Rental losses are passive: they offset passive income freely, and up to $25,000/yr can offset ordinary (W-2) income if you actively participate and your MAGI is under $100k (phasing out to $0 by $150k); unused losses carry forward. On sale, claimed depreciation is recaptured at up to 25%, and gains may owe capital-gains tax (a 1031 exchange can defer both). Figures are a year-1 estimate at your 24.0% rate — not tax advice; consult a CPA.
Condition & rehab AI · 14 photos
This multi-family property is in good condition with no visible damage or wear. It has a good exterior and interior condition, and the landscaping is well-maintained. The property has a good location and is in a good condition for both resale and rental.
Value-add opportunities
- Resale Painting the exterior siding and repainting the interior walls — Painting the exterior and interior can enhance the home's curb appeal and make it more attractive to potential buyers.
- Rental Updating the flooring in the kitchen and bathrooms — Updating the flooring can make the home more appealing to renters and can increase its rental value.
- Both Upgrading the appliances in the kitchen — Upgrading the appliances can make the home more attractive to both buyers and renters and can increase its value.
Renovation cost estimate screening
Value-add ROI direction
- Resale Painting the exterior siding and repainting the interior walls — Painting the exterior and interior can enhance the home's curb appeal and make it more attractive to potential buyers. ↑
- Rental Updating the flooring in the kitchen and bathrooms — Updating the flooring can make the home more appealing to renters and can increase its rental value. ↑
- Both Upgrading the appliances in the kitchen — Upgrading the appliances can make the home more attractive to both buyers and renters and can increase its value. ↑
ⓘ Cost ranges are severity-bucket heuristics (US national rule-of-thumb). Get contractor quotes + a written scope before underwriting a rehab budget.
Schools (NCES district)
- District
- Boulder Valley School District No. Re2
- NCES district ID
- 0802490
- Math proficiency
- 49% ▼ -3.00%
- Reading proficiency
- 67% ▲ 4.00%
- Median HH income
- $70,395
- Composite
- 51.3/100
- National rank
- #1747
- State rank
- #6 of 86 in CO
Livability — Boulder
- Score
- 77/100
- State rank
- #24
- US rank
- #2958
Category grades
Schools grade is shown separately in the Schools card above.
Census & demographics
- Census place
- Boulder, CO
- County
- Boulder County · 271,666 people
- City population
- 121,246
- Metro
- Boulder, CO
- Population (ZIP)
- 25,383
- Household income
- $126,558
- Rent vs Own
- Severe rent burden
- 891.0
Population outlook (Boulder County) Hauer SSP2
- Today (2025)
- 380,833 people
- By 2030
- 412,028 · +8.2%
- By 2040
- 472,764 · +24.1%
- By 2050
- 532,029 · +39.7%
- By 2075
- 679,723 · +78.5%
- By 2100
- 766,278 · +101.2%
Race, ethnicity, and origin ACS 2023
- Neighborhood character
- Predominantly White (76%)
- Race & ethnicity
- White 76% Hispanic / Latino 16% Two or more races 10% Asian 3%
- Hispanic origin (detail)
- Mexican 11%
- Common ancestry
- Italian 4% Romanian 4% Slovak 3%
- Foreign-born
- 12% · Canada, China, Jamaica
- Languages at home
- 84% English-only · Spanish 9% Other Indo-European 2% German/W. Germanic 1%
Political lean MEDSL · Boulder
- 2024 margin
- Solid D (+55.8) · D 76.5% · R 20.8% · Other 2.7%
- 2008→2024 swing
- +9.6pp toward D · 2008: 46.1pp · 2024: 55.8pp
- All cycles
- 2024: D+55.8 2020: D+56.6 2016: D+48.6 2012: D+41.5 2008: D+46.1
Not yet ingested
- Civics
- —
Market trends
- HPI YoY
- ▼ -1111.31%
- Current HPI
- 324.6478
- Rent YoY
- ▲ 1.82%
- Metro
- Boulder, CO
- State GDP YoY
- ▲ 1.95%
- F500 in state
- 14
Industry mix (Fortune 500 HQ in CO)
| Industry | F500 HQs | Revenue |
|---|---|---|
| Technology Distribution | 1 | $31B |
|
||
| Food / Agriculture | 1 | $18B |
|
||
| Packaging | 1 | $14B |
|
||
| Healthcare | 1 | $13B |
|
||
| Energy | 1 | $10B |
|
||
| Technology | 1 | $4B |
|
||
Price history
+104.0% since first listed3 events — show timeline
- 2026-06-04 Listed $2,295,000 IRES
- 2003-10-16 Sold (MLS) $995,000 IRES
- 2002-08-16 Listed $1,125,000 IRES
Cash-flow waterfall
monthlySold comps — $/sqft
last 12 mo · ≤1 miLoading sold comps…