402 S 72nd St · Houston, TX
Flood risk 8/10 · Major
- FEMA flood zone
- X (unshaded)
- Chance of flooding over 30 yrs
- 0.99%
- Est. flood insurance / yr
- $507 – $1,088
Fire risk 1/10 · Minimal
- Est. fire insurance / yr
- $1,222 – $2,270
Heat risk 9/10 · Severe
- Hot days now (above 109°F)
- 7 days/yr
- Hot days in 30 yrs
- 22 days/yr
Wind risk 9/10 · Severe
- Chance of severe wind over 30 yrs
- 99.0%
Air-quality risk 2/10 · Minimal
- Unhealthy air days now
- 2 days/yr
- Unhealthy air days in 30 yrs
- 2 days/yr
Risk factors via First Street. Map © Google.
Why this score? — see what drove the D+ grade
The composite is a weighted blend of 9 inputs, each scored 0–100. Each bar is that input's sub-score; the figure is the points it added to the 100-point composite (weight × sub-score).
- ARV discount +14.0/15.0
- Appreciation +10.0/10.0
- Cash flow +7.1/30.0
- Livability +3.7/5.0
- Schools +2.7/10.0
- Condition / age +2.5/5.0
- 1% rule +2.1/10.0
- Rent growth +1.8/5.0
- DSCR +1.3/10.0
$228,000
🖨 Deal sheet (PDF) 📄 Offer letter ✓ Due diligence
Listing remarks MLS
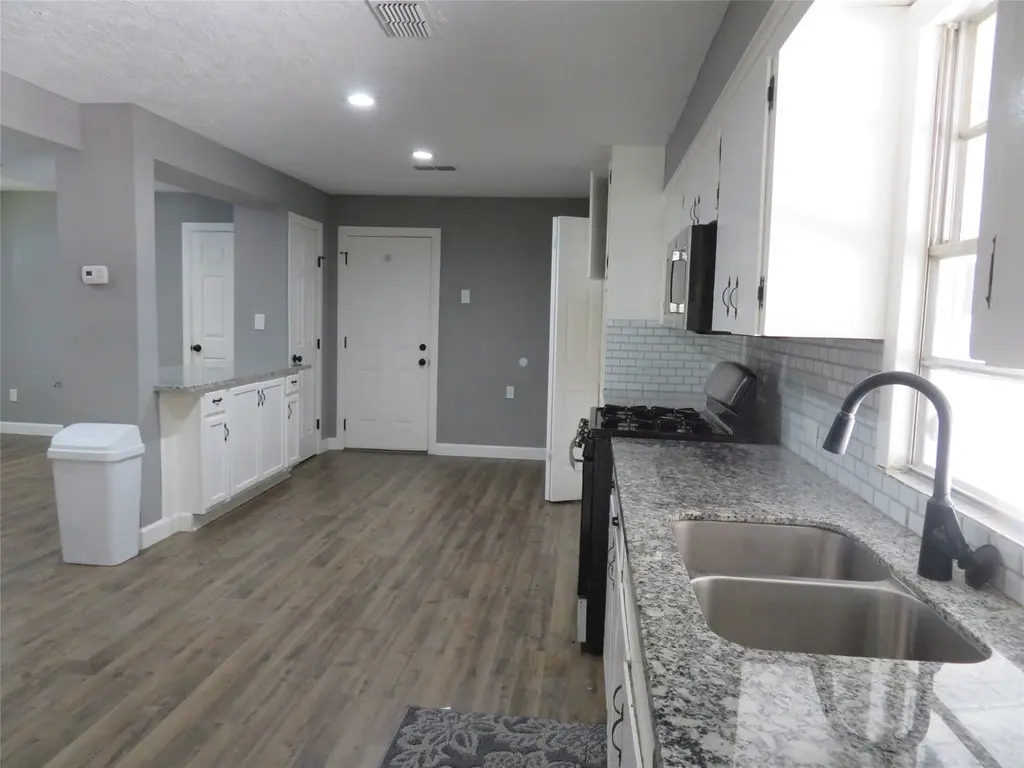
The talk of the Town is Houston’s East End. Love to do projects around the house and have extra work vehicles? NO HOA -This is the home for you!Spacious kitchen with granite countertops, laminate flooring throughout for low-maintenance ownership. Easy access to Mason Park,Texas Medical Center, Oil refineries, Port of Houston, UH and major freeways. With 2-car garage + 3 carports. Corner lot, NO HOA for maximum flexibility. Split floor plan offers 3 bedrooms and 2 bathrooms, designed to accommodate shared living arrangements or segmented leasing. Larger bedroom features a private entrance and dedicated side yard—ideal for independent occupancy, multigenerational living. Suited for multiple tenants, work vehicles, or extended households. Corner lot for enhanced privacy or outdoor configuration. NO HOA—offering maximum control, flexibility, and fewer operational constraints. This property delivers the infrastructure, location, and no HOA freedom in the inner city.
Key facts
- 4,843 sq ft lot
- 2 garage spots
- Built 1930
Neighborhood map
What this means for you Summary
Snapshot
- This is a 2-bed/1.0-bath single-family listed at $228k.
Deal economics
- At list price, monthly cash flow is $-390 ($-5k/yr) — negative.
- To cash-flow at today's rent, offer at most $159k (30.2% below list).
- To meet the 1% rule (rent ≥ 1% of price), the offer needs to be $163k (28.7% below list).
- Recommended offer: $159k (30.2% below list) — sets the bar for cash-flow.
- Cap rate 4.6% vs local median 3.2% in Houston — top-decile yield for the area; either an underpriced asset or a hidden risk that comps aren't pricing in. Stress-test before assuming the spread holds.
Location & tenants
- Location reads 74/100 on livability (#184 in TX, #4,771 nationally) — a middle-class / working-renter tenant base. Strengths: amenities A+, cost of living A+, housing A+; Watch: crime F.
- Houston ISD (urban): math 27% / reading 35% proficiency, ranked #593 of 826 in TX (top 72%) — families likely to look elsewhere, expect single-tenant / working-renter base with shorter leases; 71% free/reduced lunch — lower-income household profile, screen leases tightly.
- Zoned schools: Briscoe El (math 12% / reading 12%, grade F, #4,207 of 4,322 statewide, top 98%, 193 students, 95% FRL); Edison Middle (math 12% / reading 16%, grade F, #1,596 of 1,662 statewide, top 96%, 460 students, 96% FRL); Austin H S (math 9% / reading 18%, grade F, #1,530 of 1,632 statewide, top 94%, 1,448 students, 97% FRL) — zoned schools average 96% FRL vs 71% district-wide (25 pts higher); higher-poverty schools than district average — tighter screening recommended.
- Zoned-school proficiency averages 13% at this address vs 31% district-wide (-18 pts) — the specific schools serving this property underperform the Houston ISD average; the district grade overstates school quality for this exact location.
- Market conditions: Rents soft (-2.9%/yr); 161 active listings in the ZIP; 9 comparable units currently listed for rent nearby; rentals leasing fast (median 1d on market — plan ~1-2 weeks tenant-placement turnaround); 29,883 units permitted in Harris County in 2024 (8,621 in 5+ unit buildings).
Forward outlook
- In year one you build about $24k of equity ($2k loan paydown + $23k appreciation (10.0% local appreciation)).
- Harris County population projected at +47% by 2050 — long-run rental-demand tailwind backs the buy-and-hold thesis.
- By year 2, paydown + projected appreciation supports a ~$39k cash-out refi (75% LTV) — recoverable capital for the next deal without selling this one.
Negotiation context
- It's been on market 251 days — a 12% lower offer ($201k) is reasonable based on typical stale-listing flexibility.
- 8 sale attempts since 15y ago with the ask held roughly flat each time — persistent listings suggest the price (not the market) is what's stuck; bring a comps-based counter.
Risks & watch-outs
- Watch-outs: flood insurance adds $66/mo; built in 1930 — expect roof / HVAC / electrical / plumbing capex.
- Climate carrying-cost: severe flood risk; severe wind risk, 99% chance of damaging wind over 30y; extreme-heat days projected 7→22/yr by 2055 (HVAC capex compounding) — expect insurance premiums to compound above CPI over the hold.
Questions for the listing agent
- What do current leases actually rent for vs. the listed asking? Can we see a recent rent roll and the last 12 months of T-12 income?
- It's been on market 251 days. Have you received any prior offers? Is the seller open to a 30% concession, seller financing, or rate buy-down credit?
- Built in 1930 — when were the roof, HVAC, electrical panel, plumbing, and water heater last replaced?
- What's the actual annual flood-insurance premium (NFIP or private), and is the property in a SFHA with mandatory coverage?
- Why hasn't it sold? Are there any deal-killer items the seller is aware of (foundation, flood, title, zoning, code violations)?
- Is there a deadline driving the sale (1031 exchange, divorce, estate, relocation)? That informs how much negotiation room exists.
- Schools are D-rated, which usually means shorter tenancies and higher turnover. Who's the typical renter profile here, and what's been the actual vacancy rate?
- Crime grade is F in this area — have there been break-ins, vandalism, or insurance claims at this property in the last 3 years? What carrier currently insures it and at what premium?
- The area grade is low — what's the realistic commute time and amenity access for the typical tenant pool here? Any planned neighborhood developments (good or bad) we should know about?
- What's the average days-on-market for RENTAL listings here right now (not sales)? A rising rental-DOM trend means longer vacancies and softer asking-rent achievability than the comps imply.
- What's the recent tenant-quality profile in this submarket — average credit score on applications, eviction rate, late-payment / NSF rate, and stable-employment percentage? A property-management company in the area should have these aggregated.
- How much new for-sale + rental construction is in the pipeline within 1–3 miles? Heavy new supply typically softens prices + rents 12–24 months out; constrained supply supports both.
Investment metrics
- 1% rule
- 0.71% ✗
- Cap rate
- 4.59%
- Cash-on-cash
- -6.09%
- DSCR
- 0.73
- GRM
- 11.7
CMA / ARV
- ARV (median comp)
- $266,290
- List price
- $228,000
- Delta
- -14.38%
- Verdict
- UNDERPRICED
- Comps
- 20 within 1.0 mi
Show comp detail 12 sales within ~0.75 mi
| Address | Dist | Beds/Ba | Sqft | Sold | Price | $/sf | Match |
|---|---|---|---|---|---|---|---|
| 7422 Mckinney St | 0.27mi | 3/2.0 (+1) | 1,836 (+10%) | 3mo | $339,900 | $185 | 60 |
| 7024 Avenue E | 0.52mi | 3/2.0 (+1) | 1,678 (+0%) | 9mo | $344,000 | $205 | 59 |
| 7004 Santa Maria St | 0.51mi | 3/2.0 (+1) | 1,612 (-4%) | 4mo | $289,999 | $180 | 58 |
| 7001 Sherman St | 0.53mi | 3/2.0 (+1) | 1,646 (-2%) | 14mo | $259,900 | $158 | 52 |
| 7216 Avenue B | 0.34mi | 3/2.5 (+1) | 1,874 (+12%) | 3mo | $339,500 | $181 | 51 |
| 6735 Meadowlawn St | 0.69mi | 3/2.0 (+1) | 1,701 (+2%) | 10mo | $475,000 | $279 | 48 |
| 147 Woodvale Street St Unit A | 0.68mi | 3/2.5 (+1) | 1,725 (+3%) | 8mo | $270,000 | $157 | 46 |
| 2022 Palo Alto St | 0.70mi | 2/1.0 | 1,476 (-12%) | 10mo | $200,000 | $136 | 40 |
| 7226 Avenue F | 0.52mi | 3/2.0 (+1) | 1,465 (-12%) | 10mo | $277,000 | $189 | 37 |
| 1956 Santa Rosa St | 0.66mi | 3/2.0 (+1) | 1,478 (-12%) | 7mo | $390,000 | $264 | 35 |
| 7518 Erath St | 0.75mi | 3/1.0 (+1) | 1,456 (-13%) | 8mo | $275,000 | $189 | 32 |
| 2047 Alta Vista St | 0.73mi | 3/2.0 (+1) | 1,430 (-15%) | 10mo | $349,000 | $244 | 25 |
Match score weights: distance 35% · size 25% · config 20% · recency 20%. Top-matched comps best support the ARV.
Projected returns pro-forma
10.0% appreciation · 0.0% rent growth · sell at horizon
- IRR
- 18.3%
- Equity multiple
- 2.48×
- Total profit
- $94,643
- Equity at exit
- $205,400
- IRR
- 16.5%
- Equity multiple
- 5.54×
- Total profit
- $289,893
- Equity at exit
- $442,954
Cash invested: $63,840 (down + closing). Projections, not guarantees.
Landlord ↔ Tenant lean methodology
- Overall (STATE)
- 87 Strongly Landlord-Friendly
- State Texas
- 87 Strongly Landlord-Friendly · R+5
- County
- — inherits STATE
- City
- — inherits STATE
ZIP-level market 77011
- Home prices YoY
- 30.1%
- Rents YoY
- -2.9%
- Active inventory
- 161
- Price-to-rent
- 11.7×
Monthly cashflow live
- Estimated rent
- $1,625 high interval (Pro) →
- Mortgage (P&I)
- −$1,196
- Tax from tax record
- −$317 /mo · $3,805/yr
- Insurance
- −$95
- Flood insurance flood zone
- −$66 /mo · $798/yr
- HOA
- −$0
- Vacancy / Maint / Mgmt
- −$341
- Net cashflow
- $-390
Break-even live
Sensitivity live
| Price | -10% $-261 | -5% $-326 | +0% $-390 | +5% $-455 | +10% $-519 |
|---|---|---|---|---|---|
| Rent | -10% $-519 | -5% $-454 | +0% $-390 | +5% $-326 | +10% $-262 |
| Rate | -1.0pp $-275 | -0.5pp $-332 | base $-390 | +0.5pp $-449 | +1.0pp $-509 |
UW: 25.0% down · 7.5% · 30yr · 1.5% tax · 5.0% vac · 8.0% maint · 8.0% mgmt
Financing live
Cash to close
- Down payment
- $57,000
- Closing costs
- $6,840
- Reserves months
- —
- Total cash needed
- —
Loan-product check · same deal, 3 products live
Conventional
25% down · 7.5% · 30yr
- Down + closing
- —
- Monthly P&I
- —
- Monthly cashflow
- —
- DSCR
- —
- Eligible?
- —
Personal DTI + credit; lowest rate.
DSCR
20% down · 8.5% · 30yr
- Down + closing
- —
- Monthly P&I
- —
- Monthly cashflow
- —
- DSCR
- —
- Eligible?
- —
No personal income docs; deal must DSCR.
Hard money
10% down · 12.0% · 12mo
- Down + closing
- —
- Monthly P&I
- —
- Monthly cashflow
- —
- DSCR
- —
- Eligible?
- —
Short-term bridge; refi at stabilization.
Rent comps 9 comps
| Address | Beds | Baths | Sqft | Rent | $/sqft | DOM | Units | Dist |
|---|---|---|---|---|---|---|---|---|
| 7334 Texas St Houston, TX | 3.0 | 2.0 | 1782 | $2,200 | $1.23 | 45d | 1 | 0.35mi |
| 7250 Avenue C Houston, TX | 1.0–3.0 | 1.0–2.0 | 886 | $1,415 | $1.60 | 1d | 15 | 0.40mi |
| 7310 Sherman St Houston, TX | 1.0–3.0 | 1.0–2.0 | 879 | $1,299 | $1.48 | 1d | 11 | 0.49mi |
| 960 Villa De Matel Rd Houston, TX | 2.0 | 1.0 | 1056 | $1,129 | $1.07 | 26d | 1 | 0.77mi |
| 6403 Avenue C Unit 1019625P Houston, TX | 2.0–8.0 | 1.0–4.0 | 1232 | $2,871 | $2.33 | 0d | 2 | 1.01mi |
| 916 Redwood St Houston, TX | 3.0 | 1.0 | 1209 | $1,140 | $0.94 | 26d | 1 | 1.06mi |
| 5504 Texas St Unit 1514810P Houston, TX | 3.0 | 2.5 | 1808 | $7,146 | $3.95 | 0d | 1 | 1.46mi |
| 5502 Texas St Unit 1514806P Houston, TX | 3.0 | 2.5 | 1808 | $7,179 | $3.97 | 0d | 1 | 1.46mi |
| 5121 Polk St Unit 1 Houston, TX | 2.0 | 1.0 | 1300 | $1,600 | $1.23 | 26d | 1 | 1.48mi |
Listing history 44 events
-
2026-06-21days on market $228,000 Active 251 DOM
-
2026-06-18days on market $228,000 Active 248 DOM
-
2026-06-17days on market $228,000 Active 247 DOM
-
2026-06-16days on market $228,000 Active 246 DOM
-
2026-06-15days on market $228,000 Active 245 DOM
-
2026-06-13days on market $228,000 Active 243 DOM
-
2026-06-10days on market $228,000 Active 239 DOM
-
2026-06-08days on market $228,000 Active 238 DOM
-
2026-06-07days on market $228,000 Active 237 DOM
-
2026-06-04days on market $228,000 Active 234 DOM
-
2026-06-01days on market $228,000 Active 231 DOM
-
2026-05-31days on market $228,000 Active 230 DOM
-
2026-05-06price $228,000 995-char remark
Show marketing remark (995 chars)
The talk of the Town is Houston’s East End. Love to do projects around the house and have extra work vehicles? NO HOA -This is the home for you!Spacious kitchen with granite countertops, laminate flooring throughout for low-maintenance ownership. Easy access to Mason Park,Texas Medical Center, Oil refineries, Port of Houston, UH and major freeways. With 2-car garage + 3 carports. Corner lot, NO HOA for maximum flexibility. Split floor plan offers 3 bedrooms and 2 bathrooms, designed to accommodate shared living arrangements or segmented leasing. Larger bedroom features a private entrance and dedicated side yard—ideal for independent occupancy, multigenerational living. Suited for multiple tenants, work vehicles, or extended households. Corner lot for enhanced privacy or outdoor configuration. NO HOA—offering maximum control, flexibility, and fewer operational constraints. This property delivers the infrastructure, location, and no HOA freedom in the inner city.
-
2026-04-27price $228,893 995-char remark
Show marketing remark (995 chars)
The talk of the Town is Houston’s East End. Love to do projects around the house and have extra work vehicles? NO HOA -This is the home for you!Spacious kitchen with granite countertops, laminate flooring throughout for low-maintenance ownership. Easy access to Mason Park,Texas Medical Center, Oil refineries, Port of Houston, UH and major freeways. With 2-car garage + 3 carports. Corner lot, NO HOA for maximum flexibility. Split floor plan offers 3 bedrooms and 2 bathrooms, designed to accommodate shared living arrangements or segmented leasing. Larger bedroom features a private entrance and dedicated side yard—ideal for independent occupancy, multigenerational living. Suited for multiple tenants, work vehicles, or extended households. Corner lot for enhanced privacy or outdoor configuration. NO HOA—offering maximum control, flexibility, and fewer operational constraints. This property delivers the infrastructure, location, and no HOA freedom in the inner city.
-
2026-02-10price $228,895 995-char remark
Show marketing remark (995 chars)
The talk of the Town is Houston’s East End. Love to do projects around the house and have extra work vehicles? NO HOA -This is the home for you!Spacious kitchen with granite countertops, laminate flooring throughout for low-maintenance ownership. Easy access to Mason Park,Texas Medical Center, Oil refineries, Port of Houston, UH and major freeways. With 2-car garage + 3 carports. Corner lot, NO HOA for maximum flexibility. Split floor plan offers 3 bedrooms and 2 bathrooms, designed to accommodate shared living arrangements or segmented leasing. Larger bedroom features a private entrance and dedicated side yard—ideal for independent occupancy, multigenerational living. Suited for multiple tenants, work vehicles, or extended households. Corner lot for enhanced privacy or outdoor configuration. NO HOA—offering maximum control, flexibility, and fewer operational constraints. This property delivers the infrastructure, location, and no HOA freedom in the inner city.
-
2025-10-11$235,000 Active 995-char remark
Show marketing remark (995 chars)
The talk of the Town is Houston’s East End. Love to do projects around the house and have extra work vehicles? NO HOA -This is the home for you!Spacious kitchen with granite countertops, laminate flooring throughout for low-maintenance ownership. Easy access to Mason Park,Texas Medical Center, Oil refineries, Port of Houston, UH and major freeways. With 2-car garage + 3 carports. Corner lot, NO HOA for maximum flexibility. Split floor plan offers 3 bedrooms and 2 bathrooms, designed to accommodate shared living arrangements or segmented leasing. Larger bedroom features a private entrance and dedicated side yard—ideal for independent occupancy, multigenerational living. Suited for multiple tenants, work vehicles, or extended households. Corner lot for enhanced privacy or outdoor configuration. NO HOA—offering maximum control, flexibility, and fewer operational constraints. This property delivers the infrastructure, location, and no HOA freedom in the inner city.
-
2023-05-22historical
-
2023-05-01status Active
-
2023-04-30historical
-
2023-04-05price $264,000
-
2023-04-03price $265,000
-
2023-03-31price $266,000
-
2023-03-29price $267,000
-
2023-03-27price $268,000
-
2023-02-28price $269,000
-
2023-02-23price $290,000
-
2023-02-03status Active
-
2023-01-24historical
-
2022-12-27$270,000 Active
-
2022-08-22soldstatus
-
2022-08-22soldstatus
-
2022-08-19soldstatus Sold
-
2022-08-08status Pending
-
2022-08-02$142,000 Active
-
2013-01-04soldstatus
-
2012-12-21soldstatus Sold
-
2012-10-29historical
-
2012-09-11$89,000
-
2012-08-31historical
-
2012-06-08$99,900
-
2012-06-01historical
-
2011-11-11$99,900
-
2002-02-27soldstatus
-
1988-01-02soldstatus
ⓘ Source: listings_history table (triggers on properties + properties_extension) + one-shot
backfill from property_details.listing_events for pre-trigger history.
Tax reassessment forecast TX · Resets to sale price
- Current annual tax
- $3,805 · $317/mo
- Projected year-2 tax
- $4,172 · $348/mo
- Expected delta
- +$368/yr (+$31/mo · 9.7%)
ⓘ Screening estimate from a state-policy table — verify with the county assessor before closing.
Climate risk First Street
- Flood 8/10 Severe FEMA zone X (unshaded) · 99% chance over 30 yrs
- Wildfire 1/10 Low
- Heat 9/10 Extreme 7 d/yr ≥109°F today · 22 d/yr by 30 yrs out
- Wind 9/10 Extreme 99% chance of damaging wind over 30 yrs
- Air quality 2/10 Low 2 unhealthy d/yr today · 2 by 30 yrs out
Nearby sold comps map
Loading sold comps map…
Walkable amenities ~0.75 mi
Loading nearby amenities…
Taxation est. · year 1
- Rental income
- $19,503
- − Mortgage interest
- −$12,772
- − Property taxes
- −$3,805
- − Insurance
- −$1,937
- − Repairs & maintenance
- −$1,560
- − Management
- −$1,560
- − Depreciation
- −$6,633
- Taxable loss
- −$8,764
- Est. tax savings @ 24.0%
- +$2,103
- After-tax cash flow
- $-2,579/yr
For passive investors: Depreciation is non-cash, so a rental often shows a tax loss while cash-flowing — sheltering income. Rental losses are passive: they offset passive income freely, and up to $25,000/yr can offset ordinary (W-2) income if you actively participate and your MAGI is under $100k (phasing out to $0 by $150k); unused losses carry forward. On sale, claimed depreciation is recaptured at up to 25%, and gains may owe capital-gains tax (a 1031 exchange can defer both). Figures are a year-1 estimate at your 24.0% rate — not tax advice; consult a CPA.
Schools (NCES district)
- District
- Houston ISD
- NCES district ID
- 4823640
- Math proficiency
- 27% ▼ -18.00%
- Reading proficiency
- 35% ▼ -6.00%
- Median HH income
- $46,054
- Composite
- 26.63/100
- National rank
- #7173
- State rank
- #593 of 826 in TX
Livability — Houston
- Score
- 74/100
- State rank
- #184
- US rank
- #4771
Category grades
Schools grade is shown separately in the Schools card above.
Census & demographics
- Census place
- Houston, TX
- County
- Harris County · 4,702,590 people
- City population
- 3,226,434
- Metro
- Houston-The Woodlands-Sugar Land, TX
- Population (ZIP)
- 14,940
- Household income
- $50,133
- Rent vs Own
- Severe rent burden
- 655.0
Population outlook (Harris County) Hauer SSP2
- Today (2025)
- 5,571,493 people
- By 2030
- 6,089,821 · +9.3%
- By 2040
- 7,142,806 · +28.2%
- By 2050
- 8,185,864 · +46.9%
- By 2075
- 10,574,329 · +89.8%
- By 2100
- 12,109,958 · +117.4%
Race, ethnicity, and origin ACS 2023
- Neighborhood character
- Predominantly Hispanic (88%)
- Race & ethnicity
- Hispanic / Latino 88% Two or more races 29% White 7% Black 3%
- Hispanic origin (detail)
- Mexican 81%
- Foreign-born
- 33% · Canada
- Languages at home
- 24% English-only · Spanish 76%
Political lean MEDSL · Harris
- 2024 margin
- Lean D (+5.5) · D 52.0% · R 46.4% · Other 1.6%
- 2008→2024 swing
- +3.9pp toward D · 2008: 1.6pp · 2024: 5.5pp
- All cycles
- 2024: D+5.5 2020: D+13.3 2016: D+12.4 2012: D+0.1 2008: D+1.6
Not yet ingested
- Civics
- —
Market trends
- HPI YoY
- ▲ 68.18%
- Current HPI
- 295.1198
- Rent YoY
- ▼ -2.93%
- Metro
- Houston-The Woodlands-Sugar Land, TX
- State GDP YoY
- ▲ 3.95%
- F500 in state
- 110
Industry mix (Fortune 500 HQ in TX)
| Industry | F500 HQs | Revenue |
|---|---|---|
| Energy | 16 | $1,198B |
|
||
| Technology | 5 | $198B |
|
||
| Engineering / Construction | 4 | $72B |
|
||
| Energy Services | 3 | $60B |
|
||
| Utilities | 3 | $41B |
|
||
| Healthcare | 2 | $330B |
|
||
Price history
+128.2% since first listed32 events — show timeline
- 2026-05-06 Price Changed $228,000 HARMLS
- 2026-04-27 Price Changed $228,893 HARMLS
- 2026-02-10 Price Changed $228,895 HARMLS
- 2025-10-11 Listed $235,000 HARMLS
- 2023-05-22 Listing Removed — HARMLS
- 2023-05-01 Relisted — HARMLS
- 2023-04-30 Listing Removed — HARMLS
- 2023-04-05 Price Changed $264,000 HARMLS
- 2023-04-03 Price Changed $265,000 HARMLS
- 2023-03-31 Price Changed $266,000 HARMLS
- 2023-03-29 Price Changed $267,000 HARMLS
- 2023-03-27 Price Changed $268,000 HARMLS
- 2023-02-28 Price Changed $269,000 HARMLS
- 2023-02-23 Price Changed $290,000 HARMLS
- 2023-02-03 Relisted — HARMLS
- 2023-01-24 Listing Removed — HARMLS
- 2022-12-27 Listed $270,000 HARMLS
- 2022-08-22 Sold (Public Records) — Public Records
- 2022-08-22 Sold (Public Records) — Public Records
- 2022-08-19 Sold (MLS) — HARMLS
- 2022-08-08 Pending — HARMLS
- 2022-08-02 Listed $142,000 HARMLS
- 2013-01-04 Sold (Public Records) — Public Records
- 2012-12-21 Sold (MLS) — HARMLS
- 2012-10-29 Listing Removed — HARMLS
- 2012-09-11 Listed $89,000 HARMLS
- 2012-08-31 Listing Removed — HARMLS
- 2012-06-08 Listed $99,900 HARMLS
- 2012-06-01 Listing Removed — HARMLS
- 2011-11-11 Listed $99,900 HARMLS
- 2002-02-27 Sold (Public Records) — Public Records
- 1988-01-02 Sold (Public Records) — Public Records
Property tax history
+8.6%/yrLatest (2025): $3,805 · +1.5% YoY. Source: county tax records.
Cash-flow waterfall
monthlySold comps — $/sqft
last 12 mo · ≤1 miLoading sold comps…