136 Seville Ct · Atwater, CA
Flood risk 3/10 · Minor
- FEMA flood zone
- X (unshaded)
- Chance of flooding over 30 yrs
- 0.2%
- Est. flood insurance / yr
- $507 – $1,088
Fire risk 7/10 · Major
- Est. fire insurance / yr
- $659 – $1,223
Heat risk 7/10 · Major
- Hot days now (above 104°F)
- 7 days/yr
- Hot days in 30 yrs
- 16 days/yr
Wind risk 1/10 · Minimal
- Chance of severe wind over 30 yrs
- —
Air-quality risk 10/10 · Severe
- Unhealthy air days now
- 29 days/yr
- Unhealthy air days in 30 yrs
- 35 days/yr
Risk factors via First Street. Map © Google.
Why this score? — see what drove the B- grade
The composite is a weighted blend of 9 inputs, each scored 0–100. Each bar is that input's sub-score; the figure is the points it added to the 100-point composite (weight × sub-score).
- Cash flow +30.0/30.0
- 1% rule +10.0/10.0
- DSCR +10.0/10.0
- ARV discount +7.5/15.0
- Livability +3.4/5.0
- Schools +2.8/10.0
- Rent growth +2.5/5.0
- Condition / age +2.5/5.0
- Appreciation +0.0/10.0
$69,999
🖨 Deal sheet 📄 Offer letter ✓ Due diligence
Listing remarks
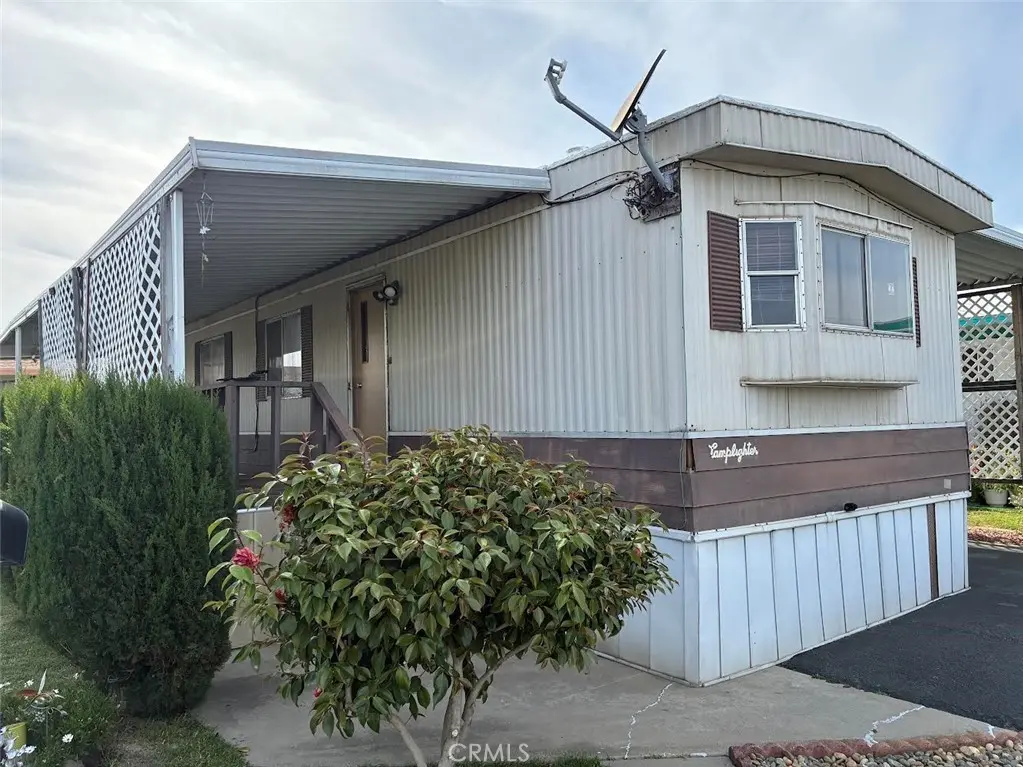
Affordable! Singlewide 2 bedroom, 1 bath. Eat-in kitchen with plenty of cabinet space, new sink, counter top and gas stove. Indoor laundry nook. Enjoy your morning coffee on the covered deck. Weekend barbecues on the patio. Handy shed. Mobile home park has swimming pool, common areas, club house, parks and more. Make it yours today!
Key facts
- Covered deck
- Handy shed
- Swimming pool
Tags
Property features AI
Finance
- Other: Park name: Rancho Grande Mobile Home Park; Manager approval required
- HOA & community: Land lease of $900 per month (park-managed); Community features include curbs, dog park, street lighting, sidewalks, and a park
Exterior
- Parking: Carport; Parking available in Rancho Grande Mobile Home Park
- Utilities: Public sewer; Public/district water; Electricity connected; Sewer connected; Cable available
- Home design: Single-story mobile home; Mobile home remains on site
- Construction: Mobile home width 24 ft and length 112 ft; Year built from public records
- Exterior features: Community pool; Lot is level/flat; Paved road access
Interior
- Kitchen: Dishwasher; Garbage disposal; Range/stove hood; Water heater unit
- Bathrooms: 1 full bathroom
- Heating & cooling: Central cooling; Central furnace heating
- Interior features: Smoke detector; Entry level is on the first floor
- Laundry & utility: Laundry inside
Neighborhood map
What this means for you Summary
Snapshot
- This is a 2-bed/1.0-bath manufactured listed at $70k.
Deal economics
- At list price, monthly cash flow is $472 ($6k/yr) — positive.
- The deal already cash-flows at list — no discount required.
- Meets the 1% rule at list price ($1k rent vs $70k).
- Recommended offer: $68k (3.0% below list) — sets the bar for market timing.
- Cap rate 14.4% vs local median 2.8% in Atwater — top-decile yield for the area; either an underpriced asset or a hidden risk that comps aren't pricing in. Stress-test before assuming the spread holds.
Location & tenants
- Location reads 68/100 on livability (#295 in CA) — a middle-class / working-renter tenant base. Strengths: housing A+, health & safety A+, amenities B; Watch: employment D+, schools D, crime F.
- Merced Union High (urban): math 20% / reading 46% proficiency, ranked #301 of 517 in CA (top 58%) — families likely to look elsewhere, expect single-tenant / working-renter base with shorter leases.
- Market conditions: 115 active listings in the ZIP; 459 units permitted in Merced County in 2024 (0 in 5+ unit buildings).
Forward outlook
- Local home prices are declining (-3.0%/yr); year-one equity from $484 of loan paydown is wiped out by about $2k of value loss. Plan a longer hold.
- Merced County population projected at +12% by 2050 — modest demand growth; plan on rents tracking national, not racing it.
- At projected returns (-3.0% appreciation + 3.0% rent growth), your $20k cash investment doubles in ~5 years — after that, you're playing with house money.
Negotiation context
- It's been on market 57 days — a 3% lower offer ($68k) is reasonable based on typical stale-listing flexibility.
- 2 sale attempts since 4y ago with the ask held roughly flat each time — persistent listings suggest the price (not the market) is what's stuck; bring a comps-based counter.
Risks & watch-outs
- Climate carrying-cost: major wildfire risk; extreme-heat days projected 7→16/yr by 2055 (HVAC capex compounding) — expect insurance premiums to compound above CPI over the hold.
Questions for the listing agent
- It's been on market 57 days. Have you received any prior offers? Is the seller open to a 3% concession, seller financing, or rate buy-down credit?
- Is there a deadline driving the sale (1031 exchange, divorce, estate, relocation)? That informs how much negotiation room exists.
- Schools are D-rated, which usually means shorter tenancies and higher turnover. Who's the typical renter profile here, and what's been the actual vacancy rate?
- Crime grade is F in this area — have there been break-ins, vandalism, or insurance claims at this property in the last 3 years? What carrier currently insures it and at what premium?
- What's the average days-on-market for RENTAL listings here right now (not sales)? A rising rental-DOM trend means longer vacancies and softer asking-rent achievability than the comps imply.
- What's the recent tenant-quality profile in this submarket — average credit score on applications, eviction rate, late-payment / NSF rate, and stable-employment percentage? A property-management company in the area should have these aggregated.
- How much new for-sale + rental construction is in the pipeline within 1–3 miles? Heavy new supply typically softens prices + rents 12–24 months out; constrained supply supports both.
Investment metrics
- 1% rule
- 1.73% ✓
- Cap rate
- 14.39%
- Cash-on-cash
- 28.90%
- DSCR
- 2.29
- GRM
- 4.8
CMA / ARV
- ARV (on-the-fly)
- $31,584
- Comps found
- 4
Show comp detail 4 sales within ~0.75 mi
| Address | Dist | Beds/Ba | Sqft | Sold | Price | $/sf | Match |
|---|---|---|---|---|---|---|---|
| 92 Rancho Grande | 0.09mi | 2/1.0 | 750 (+12%) | 4mo | $100,000 | $133 | 74 |
| 100 Rancho Grande Cir | 0.08mi | 2/1.0 | 600 (-11%) | 6mo | $24,997 | $42 | 73 |
| 171 Atwater Blvd | 0.49mi | 2/1.0 | 640 (-5%) | 10mo | $30,000 | $47 | 61 |
| 5022 E Broadway #7 | 0.74mi | 1/1.0 (-1) | 575 (-14%) | 18mo | $25,000 | $43 | 22 |
Match score weights: distance 35% · size 25% · config 20% · recency 20%. Top-matched comps best support the ARV.
Projected returns pro-forma
-3.0% appreciation · 3.0% rent growth · sell at horizon
- IRR
- 23.3%
- Equity multiple
- 1.96×
- Total profit
- $18,740
- Equity at exit
- $10,437
- IRR
- 31.2%
- Equity multiple
- 3.81×
- Total profit
- $55,105
- Equity at exit
- $6,052
Cash invested: $19,600 (down + closing). Projections, not guarantees.
Landlord ↔ Tenant lean methodology
- Overall (STATE)
- 18 Strongly Tenant-Friendly
- State California
- 18 Strongly Tenant-Friendly · D+13
- County
- — inherits STATE
- City
- — inherits STATE
ZIP-level market 95301
- Active inventory
- 115
- Price-to-rent
- 4.8×
Monthly cashflow live
- Estimated rent
- $1,210 medium interval (Pro) →
- Mortgage (P&I)
- −$367
- Tax est. 1.5%
- −$87 /mo · $1,050/yr
- Insurance
- −$29
- HOA
- −$0
- Vacancy / Maint / Mgmt
- −$254
- Net cashflow
- $472
Break-even live
UW: 25.0% down · 7.5% · 30yr · 1.5% tax · 5.0% vac · 8.0% maint · 8.0% mgmt
Financing live
Cash to close
- Down payment
- $17,500
- Closing costs
- $2,100
- Reserves months
- —
- Total cash needed
- —
Loan-product check · same deal, 3 products live
Conventional
25% down · 7.5% · 30yr
- Down + closing
- —
- Monthly P&I
- —
- Monthly cashflow
- —
- DSCR
- —
- Eligible?
- —
Personal DTI + credit; lowest rate.
DSCR
20% down · 8.5% · 30yr
- Down + closing
- —
- Monthly P&I
- —
- Monthly cashflow
- —
- DSCR
- —
- Eligible?
- —
No personal income docs; deal must DSCR.
Hard money
10% down · 12.0% · 12mo
- Down + closing
- —
- Monthly P&I
- —
- Monthly cashflow
- —
- DSCR
- —
- Eligible?
- —
Short-term bridge; refi at stabilization.
Listing history 22 events
-
2026-06-18days on market $69,999 Active 57 DOM
-
2026-06-17days on market $69,999 Active 56 DOM
-
2026-06-16days on market $69,999 Active 55 DOM
-
2026-06-15days on market $69,999 Active 54 DOM
-
2026-06-14days on market $69,999 Active 52 DOM
-
2026-06-13days on market $69,999 Active 51 DOM
-
2026-06-10days on market $69,999 Active 49 DOM
-
2026-06-09days on market $69,999 Active 48 DOM
-
2026-06-08days on market $69,999 Active 47 DOM
-
2026-06-07days on market $69,999 Active 46 DOM
-
2026-06-03days on market $69,999 Active 42 DOM
-
2026-06-02days on market $69,999 Active 41 DOM
-
2026-06-01days on market $69,999 Active 40 DOM
-
2026-05-31days on market $69,999 Active 39 DOM
-
2026-05-30days on market $69,999 Active 38 DOM
-
2026-04-22$69,999 Active
-
2023-01-05status Pending Sale
-
2023-01-04historical
-
2022-12-27price $55,000
-
2022-11-28price $58,000
-
2022-11-15price $59,000
-
2022-11-03$65,000 Active
ⓘ Source: listings_history table (triggers on properties + properties_extension) + one-shot
backfill from property_details.listing_events for pre-trigger history.
Climate risk First Street
- Flood 3/10 Moderate FEMA zone X (unshaded) · 20% chance over 30 yrs
- Wildfire 7/10 Severe
- Heat 7/10 Severe 7 d/yr ≥104°F today · 16 d/yr by 30 yrs out
- Wind 1/10 Low
- Air quality 10/10 Extreme 29 unhealthy d/yr today · 35 by 30 yrs out
Nearby sold comps map
Loading sold comps map…
Walkable amenities ~0.75 mi
Loading nearby amenities…
Taxation est. · year 1
- Rental income
- $14,518
- − Mortgage interest
- −$3,921
- − Property taxes
- −$1,050
- − Insurance
- −$350
- − Repairs & maintenance
- −$1,161
- − Management
- −$1,161
- − Depreciation
- −$2,036
- Taxable income
- $4,838
- Est. tax owed @ 24.0%
- −$1,161
- After-tax cash flow
- $4,503/yr
For passive investors: Depreciation is non-cash, so a rental often shows a tax loss while cash-flowing — sheltering income. Rental losses are passive: they offset passive income freely, and up to $25,000/yr can offset ordinary (W-2) income if you actively participate and your MAGI is under $100k (phasing out to $0 by $150k); unused losses carry forward. On sale, claimed depreciation is recaptured at up to 25%, and gains may owe capital-gains tax (a 1031 exchange can defer both). Figures are a year-1 estimate at your 24.0% rate — not tax advice; consult a CPA.
Schools (NCES district)
- District
- Merced Union High
- NCES district ID
- 0624660
- Math proficiency
- 20% ▲ 3.00%
- Reading proficiency
- 46% ▼ -1.00%
- Median HH income
- $44,977
- Composite
- 28.11/100
- National rank
- #6823
- State rank
- #301 of 517 in CA
Livability — Atwater
- Score
- 68/100
- State rank
- #295
- US rank
- #9893
Category grades
Schools grade is shown separately in the Schools card above.
Census & demographics
- Census place
- Atwater, CA
- County
- Merced County · 205,386 people
- City population
- 43,009
- Metro
- Merced, CA
- Population (ZIP)
- 43,009
- Household income
- $68,349
- Rent vs Own
- Severe rent burden
- 1477.0
Population outlook (Merced County) Hauer SSP2
- Today (2025)
- 285,501 people
- By 2030
- 293,437 · +2.8%
- By 2040
- 308,808 · +8.2%
- By 2050
- 321,011 · +12.4%
- By 2075
- 338,497 · +18.6%
- By 2100
- 330,493 · +15.8%
Race, ethnicity, and origin ACS 2023
- Neighborhood character
- Diverse neighborhood (Simpson 0.61)
- Race & ethnicity
- Hispanic / Latino 53% White 33% Two or more races 11% Asian 6% Black 4% Native American 1%
- Hispanic origin (detail)
- Mexican 50%
- Common ancestry
- Russian 7% Slovak 1% Iranian 1%
- Foreign-born
- 21% · Canada
- Languages at home
- 56% English-only · Spanish 37% Other Indo-European 3% Other Asian/Pacific 2%
Political lean MEDSL · Merced
- 2024 margin
- Toss-up / Even · D 46.5% · R 50.9% · Other 2.6%
- 2008→2024 swing
- -12.7pp toward R · 2008: 8.3pp · 2024: -4.4pp
- All cycles
- 2024: R+4.4 2020: D+10.6 2016: D+7.9 2012: D+5.4 2008: D+8.3
Not yet ingested
- Civics
- —
Market trends
- HPI YoY
- ▼ -365.43%
- Current HPI
- 281.52
- Rent YoY
- —
- Metro
- Merced, CA
- State GDP YoY
- ▲ 3.21%
- F500 in state
- 116
Industry mix (Fortune 500 HQ in CA)
| Industry | F500 HQs | Revenue |
|---|---|---|
| Technology | 27 | $1,492B |
|
||
| Financial Services | 3 | $174B |
|
||
| Retail | 3 | $44B |
|
||
| Insurance | 3 | $26B |
|
||
| Media / Entertainment | 2 | $115B |
|
||
| Pharmaceuticals / Biotech | 2 | $62B |
|
||
Price history
+7.7% since first listed7 events — show timeline
- 2026-04-22 Listed $69,999 CRMLS
- 2023-01-05 Pending — CRMLS
- 2023-01-04 Listing Removed — CRMLS
- 2022-12-27 Price Changed $55,000 CRMLS
- 2022-11-28 Price Changed $58,000 CRMLS
- 2022-11-15 Price Changed $59,000 CRMLS
- 2022-11-03 Listed $65,000 CRMLS
Property tax history
+10.4%/yrLatest (2020): $93 · +4.4% YoY. Source: county tax records.
Cash-flow waterfall
monthlySold comps — $/sqft
last 12 mo · ≤1 miLoading sold comps…