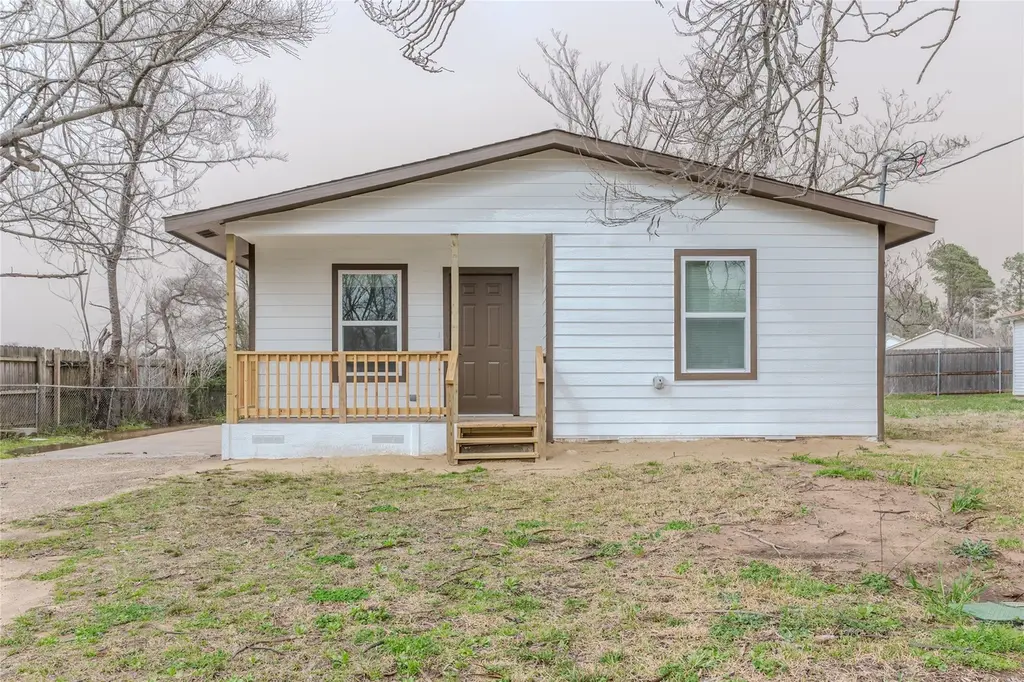
729 N Planters St · Emory, TX
Flood risk 1/10 · Minimal
- FEMA flood zone
- X (unshaded)
- Chance of flooding over 30 yrs
- 0.0%
- Est. flood insurance / yr
- $507 – $1,088
Fire risk 3/10 · Minor
- Est. fire insurance / yr
- $1,222 – $2,270
Heat risk 7/10 · Major
- Hot days now (above 109°F)
- 7 days/yr
- Hot days in 30 yrs
- 24 days/yr
Wind risk 6/10 · Moderate
- Chance of severe wind over 30 yrs
- 27.0%
Air-quality risk 2/10 · Minimal
- Unhealthy air days now
- 0 days/yr
- Unhealthy air days in 30 yrs
- 1 days/yr
Risk factors via First Street. Map © Google.
Why this score? — see what drove the D grade
The composite is a weighted blend of 9 inputs, each scored 0–100. Each bar is that input's sub-score; the figure is the points it added to the 100-point composite (weight × sub-score).
- ARV discount +15.0/15.0
- Cash flow +9.6/30.0
- Livability +3.4/5.0
- 1% rule +2.8/10.0
- DSCR +2.7/10.0
- Rent growth +2.5/5.0
- Condition / age +2.5/5.0
- Schools +2.2/10.0
- Appreciation +0.0/10.0
$224,000
🖨 Deal sheet 📄 Offer letter ✓ Due diligence
Listing remarks MLS
Newly renovated 3-bedroom, 2-bath home located in desirable Yarber Green B Subdivision. This property has been completely remodeled within the last two years. Improvements include new roof, HVAC system, plumbing, eletrical, windows, siding, kitchen, bathrooms and modern interior finishes. Enjoy the look of hardwood with durable luxury vinyl plank throughout the home, complemented by light, modern tile in the bathrooms. Both bathrooms feature new vanities, shower/tub combination, and stylish tile surround. Slab foundation. Move-in ready and thoughtfully updated-schedule your showing today!
Key facts
- Plumbing
- Electrical
- Windows
Tags
Neighborhood map
What this means for you Summary
Snapshot
- This is a 3-bed/2.0-bath single-family listed at $224k.
Deal economics
- At list price, monthly cash flow is $-154 ($-2k/yr) — negative.
- To cash-flow at today's rent, offer at most $197k (12.1% below list).
- To meet the 1% rule (rent ≥ 1% of price), the offer needs to be $175k (21.9% below list).
- Recommended offer: $175k (21.9% below list) — sets the bar for 1% rule.
- Cap rate 5.5% vs local median 2.2% in Emory — top-decile yield for the area; either an underpriced asset or a hidden risk that comps aren't pricing in. Stress-test before assuming the spread holds.
Location & tenants
- Location reads 67/100 on livability (#529 in TX) — a middle-class / working-renter tenant base. Strengths: cost of living A+, housing A+, crime B; Watch: schools F, amenities F, commute F.
- Rains ISD (rural): math 22% / reading 30% proficiency, ranked #697 of 826 in TX (top 84%) — low school quality limits family demand, transient renter base, plan for 1-2y turnover.
- Market conditions: 180 active listings in the ZIP; 1 comparable units currently listed for rent nearby; 21 units permitted in Rains County in 2024 (0 in 5+ unit buildings).
Forward outlook
- Local home prices are declining (-3.0%/yr); year-one equity from $2k of loan paydown is wiped out by about $7k of value loss. Plan a longer hold.
Negotiation context
- It's been on market 59 days — a 3% lower offer ($217k) is reasonable based on typical stale-listing flexibility.
Risks & watch-outs
- Watch-outs: built in 1955 — expect roof / HVAC / electrical / plumbing capex.
- Climate carrying-cost: major wind risk, 27% chance of damaging wind over 30y; extreme-heat days projected 7→24/yr by 2055 (HVAC capex compounding) — expect insurance premiums to compound above CPI over the hold.
Questions for the listing agent
- What do current leases actually rent for vs. the listed asking? Can we see a recent rent roll and the last 12 months of T-12 income?
- It's been on market 59 days. Have you received any prior offers? Is the seller open to a 22% concession, seller financing, or rate buy-down credit?
- Built in 1955 — when were the roof, HVAC, electrical panel, plumbing, and water heater last replaced?
- Is there a deadline driving the sale (1031 exchange, divorce, estate, relocation)? That informs how much negotiation room exists.
- Schools are F-rated, which usually means shorter tenancies and higher turnover. Who's the typical renter profile here, and what's been the actual vacancy rate?
- The area grade is low — what's the realistic commute time and amenity access for the typical tenant pool here? Any planned neighborhood developments (good or bad) we should know about?
- What's the average days-on-market for RENTAL listings here right now (not sales)? A rising rental-DOM trend means longer vacancies and softer asking-rent achievability than the comps imply.
- What's the recent tenant-quality profile in this submarket — average credit score on applications, eviction rate, late-payment / NSF rate, and stable-employment percentage? A property-management company in the area should have these aggregated.
- How much new for-sale + rental construction is in the pipeline within 1–3 miles? Heavy new supply typically softens prices + rents 12–24 months out; constrained supply supports both.
Investment metrics
- 1% rule
- 0.78% ✗
- Cap rate
- 5.47%
- Cash-on-cash
- -2.94%
- DSCR
- 0.87
- GRM
- 10.7
CMA / ARV
- ARV (median comp)
- $270,118
- List price
- $224,000
- Delta
- -17.07%
- Verdict
- UNDERPRICED
- Comps
- 20 within 1.0 mi
Show comp detail 5 sales within ~0.75 mi
| Address | Dist | Beds/Ba | Sqft | Sold | Price | $/sf | Match |
|---|---|---|---|---|---|---|---|
| 695 Ravine St | 0.06mi | 3/2.0 | 1,341 (-7%) | 2mo | $270,000 | $201 | 84 |
| 108 Pine St | 0.16mi | 3/2.0 | 1,360 (-6%) | 16mo | $299,000 | $220 | 69 |
| 129 Oak St | 0.21mi | 3/2.0 | 1,331 (-8%) | 13mo | $304,000 | $228 | 66 |
| 131 Pine St | 0.18mi | 2/1.5 (-1) | 1,304 (-10%) | 18mo | $280,000 | $215 | 53 |
| 1176 Hwy 19 | 0.53mi | 3/2.0 | 1,623 (+12%) | 23mo | $180,000 | $111 | 35 |
Match score weights: distance 35% · size 25% · config 20% · recency 20%. Top-matched comps best support the ARV.
Projected returns pro-forma
-3.0% appreciation · 3.0% rent growth · sell at horizon
- IRR
- -21.2%
- Equity multiple
- 0.27×
- Total profit
- $-46,064
- Equity at exit
- $33,399
- IRR
- -14.7%
- Equity multiple
- 0.16×
- Total profit
- $-52,635
- Equity at exit
- $19,367
Cash invested: $62,720 (down + closing). Projections, not guarantees.
Landlord ↔ Tenant lean methodology
- Overall (STATE)
- 87 Strongly Landlord-Friendly
- State Texas
- 87 Strongly Landlord-Friendly · R+5
- County
- — inherits STATE
- City
- — inherits STATE
ZIP-level market 75440
- Home prices YoY
- -12.2%
- Active inventory
- 180
- Price-to-rent
- 10.7×
Monthly cashflow live
- Estimated rent
- $1,750 medium interval (Pro) →
- Mortgage (P&I)
- −$1,175
- Tax from tax record
- −$268 /mo · $3,218/yr
- Insurance
- −$93
- HOA
- −$0
- Vacancy / Maint / Mgmt
- −$368
- Net cashflow
- $-154
Break-even live
UW: 25.0% down · 7.5% · 30yr · 1.5% tax · 5.0% vac · 8.0% maint · 8.0% mgmt
Financing live
Cash to close
- Down payment
- $56,000
- Closing costs
- $6,720
- Reserves months
- —
- Total cash needed
- —
Loan-product check · same deal, 3 products live
Conventional
25% down · 7.5% · 30yr
- Down + closing
- —
- Monthly P&I
- —
- Monthly cashflow
- —
- DSCR
- —
- Eligible?
- —
Personal DTI + credit; lowest rate.
DSCR
20% down · 8.5% · 30yr
- Down + closing
- —
- Monthly P&I
- —
- Monthly cashflow
- —
- DSCR
- —
- Eligible?
- —
No personal income docs; deal must DSCR.
Hard money
10% down · 12.0% · 12mo
- Down + closing
- —
- Monthly P&I
- —
- Monthly cashflow
- —
- DSCR
- —
- Eligible?
- —
Short-term bridge; refi at stabilization.
Rent comps 1 comps
| Address | Beds | Baths | Sqft | Rent | $/sqft | DOM | Units | Dist |
|---|---|---|---|---|---|---|---|---|
| 371 Rs County Road 2140 Unit 2140 Emory, TX | 3.0 | 2.0 | 1800 | $1,750 | $0.97 | 44d | 1 | 1.22mi |
Listing history 19 events
-
2026-06-19days on market $224,000 Active 59 DOM
-
2026-06-18days on market $224,000 Active 58 DOM
-
2026-06-17days on market $224,000 Active 57 DOM
-
2026-06-16days on market $224,000 Active 56 DOM
-
2026-06-15days on market $224,000 Active 55 DOM
-
2026-06-14pricedays on market $224,000 Active 53 DOM
-
2026-06-12days on market $229,000 Active 52 DOM
-
2026-06-09days on market $229,000 Active 49 DOM
-
2026-06-08days on market $229,000 Active 48 DOM
-
2026-06-07days on market $229,000 Active 47 DOM
-
2026-06-07days on market $229,000 Active 46 DOM
-
2026-06-03days on market $229,000 Active 43 DOM
-
2026-06-02days on market $229,000 Active 42 DOM
-
2026-06-01days on market $229,000 Active 41 DOM
-
2026-05-31days on market $229,000 Active 40 DOM
-
2026-05-30days on market $229,000 Active 39 DOM
-
2026-05-15price $229,000 595-char remark
Show marketing remark (595 chars)
Newly renovated 3-bedroom, 2-bath home located in desirable Yarber Green B Subdivision. This property has been completely remodeled within the last two years. Improvements include new roof, HVAC system, plumbing, eletrical, windows, siding, kitchen, bathrooms and modern interior finishes. Enjoy the look of hardwood with durable luxury vinyl plank throughout the home, complemented by light, modern tile in the bathrooms. Both bathrooms feature new vanities, shower/tub combination, and stylish tile surround. Slab foundation. Move-in ready and thoughtfully updated-schedule your showing today!
-
2026-04-21$247,000 Active 595-char remark
Show marketing remark (595 chars)
Newly renovated 3-bedroom, 2-bath home located in desirable Yarber Green B Subdivision. This property has been completely remodeled within the last two years. Improvements include new roof, HVAC system, plumbing, eletrical, windows, siding, kitchen, bathrooms and modern interior finishes. Enjoy the look of hardwood with durable luxury vinyl plank throughout the home, complemented by light, modern tile in the bathrooms. Both bathrooms feature new vanities, shower/tub combination, and stylish tile surround. Slab foundation. Move-in ready and thoughtfully updated-schedule your showing today!
-
2004-01-12soldstatus
ⓘ Source: listings_history table (triggers on properties + properties_extension) + one-shot
backfill from property_details.listing_events for pre-trigger history.
Tax reassessment forecast TX · Resets to sale price
- Current annual tax
- $3,218 · $268/mo
- Projected year-2 tax
- $4,099 · $342/mo
- Expected delta
- +$882/yr (+$73/mo · 27.4%)
ⓘ Screening estimate from a state-policy table — verify with the county assessor before closing.
Climate risk First Street
- Flood 1/10 Low FEMA zone X (unshaded) · 0% chance over 30 yrs
- Wildfire 3/10 Moderate
- Heat 7/10 Severe 7 d/yr ≥109°F today · 24 d/yr by 30 yrs out
- Wind 6/10 Major 27% chance of damaging wind over 30 yrs
- Air quality 2/10 Low 0 unhealthy d/yr today · 1 by 30 yrs out
Nearby sold comps map
Loading sold comps map…
Walkable amenities ~0.75 mi
Loading nearby amenities…
Taxation est. · year 1
- Rental income
- $21,000
- − Mortgage interest
- −$12,547
- − Property taxes
- −$3,218
- − Insurance
- −$1,120
- − Repairs & maintenance
- −$1,680
- − Management
- −$1,680
- − Depreciation
- −$6,516
- Taxable loss
- −$5,761
- Est. tax savings @ 24.0%
- +$1,383
- After-tax cash flow
- $-461/yr
For passive investors: Depreciation is non-cash, so a rental often shows a tax loss while cash-flowing — sheltering income. Rental losses are passive: they offset passive income freely, and up to $25,000/yr can offset ordinary (W-2) income if you actively participate and your MAGI is under $100k (phasing out to $0 by $150k); unused losses carry forward. On sale, claimed depreciation is recaptured at up to 25%, and gains may owe capital-gains tax (a 1031 exchange can defer both). Figures are a year-1 estimate at your 24.0% rate — not tax advice; consult a CPA.
Schools (NCES district)
- District
- Rains ISD
- NCES district ID
- 4836360
- Math proficiency
- 22% ▼ -20.00%
- Reading proficiency
- 30% ▼ -10.00%
- Median HH income
- $45,836
- Composite
- 22.46/100
- National rank
- #8106
- State rank
- #697 of 826 in TX
Livability — Emory
- Score
- 67/100
- State rank
- #529
- US rank
- #10352
Category grades
Schools grade is shown separately in the Schools card above.
Census & demographics
- Census place
- Emory, TX
- Population (ZIP)
- 7,480
Population outlook (Rains County) Hauer SSP2
- Today (2025)
- 11,516 people
- By 2030
- 11,610 · +0.8%
- By 2040
- 11,622 · +0.9%
- By 2050
- 11,329 · -1.6%
- By 2075
- 10,390 · -9.8%
- By 2100
- 8,809 · -23.5%
Race, ethnicity, and origin ACS 2023
- Neighborhood character
- Predominantly White (85%)
- Race & ethnicity
- White 85% Hispanic / Latino 8% Two or more races 6% Black 3% Asian 1%
- Hispanic origin (detail)
- Mexican 7%
- Common ancestry
- Lithuanian 3% Slovak 2% Iranian 1%
- Foreign-born
- 4% · Canada, China
- Languages at home
- 95% English-only · Spanish 4% Chinese 1%
Political lean MEDSL · Rains
- 2024 margin
- Solid R (+72.9) · D 13.3% · R 86.2%
- 2008→2024 swing
- -23.4pp toward R · 2008: -49.5pp · 2024: -72.9pp
- All cycles
- 2024: R+72.9 2020: R+71.2 2016: R+71.3 2012: R+61.8 2008: R+49.5
Not yet ingested
- Civics
- —
Market trends
- HPI YoY
- ▼ -29.08%
- Current HPI
- 208.6245
- Rent YoY
- —
- Metro
- —
- State GDP YoY
- ▲ 3.95%
- F500 in state
- 110
Industry mix (Fortune 500 HQ in TX)
| Industry | F500 HQs | Revenue |
|---|---|---|
| Energy | 16 | $1,198B |
|
||
| Technology | 5 | $198B |
|
||
| Engineering / Construction | 4 | $72B |
|
||
| Energy Services | 3 | $60B |
|
||
| Utilities | 3 | $41B |
|
||
| Healthcare | 2 | $330B |
|
||
Price history
-7.3% since first listed3 events — show timeline
- 2026-05-15 Price Changed $229,000 HARMLS
- 2026-04-21 Listed $247,000 HARMLS
- 2004-01-12 Sold (Public Records) — Public Records
Property tax history
+14.0%/yrLatest (2025): $3,218 · +157.0% YoY. Source: county tax records.
Cash-flow waterfall
monthlySold comps — $/sqft
last 12 mo · ≤1 miLoading sold comps…