 6-Plex
9723 San Juan · South Gate, CA
Flood risk 1/10 · Minimal
- FEMA flood zone
- X (unshaded)
- Chance of flooding over 30 yrs
- 0.0%
- Est. flood insurance / yr
- $507 – $1,088
Fire risk 1/10 · Minimal
- Est. fire insurance / yr
- $659 – $1,223
Heat risk 5/10 · Moderate
- Hot days now (above 91°F)
- 7 days/yr
- Hot days in 30 yrs
- 22 days/yr
Wind risk 1/10 · Minimal
- Chance of severe wind over 30 yrs
- —
Air-quality risk 6/10 · Moderate
- Unhealthy air days now
- 10 days/yr
- Unhealthy air days in 30 yrs
- 10 days/yr
Risk factors via First Street. Map © Google.
Why this score? — see what drove the C grade
The composite is a weighted blend of 9 inputs, each scored 0–100. Each bar is that input's sub-score; the figure is the points it added to the 100-point composite (weight × sub-score).
- Cash flow +28.7/30.0
- DSCR +10.0/10.0
- 1% rule +6.9/10.0
- Rent growth +3.7/5.0
- Schools +3.6/10.0
- Livability +3.2/5.0
- Condition / age +2.5/5.0
- ARV discount +0.0/15.0
- Appreciation +0.0/10.0
$1,499,999
🖨 Deal sheet 📄 Offer letter ✓ Due diligence
Multi-family units
County records classify this as Multi-Family (5+ Unit). Listing-text estimate: 6 units. confirmed
5+ unit building — per-unit beds/baths from public records are typically unavailable; the breakdown below (if shown) is an estimate from the listing text.
Listing remarks MLS
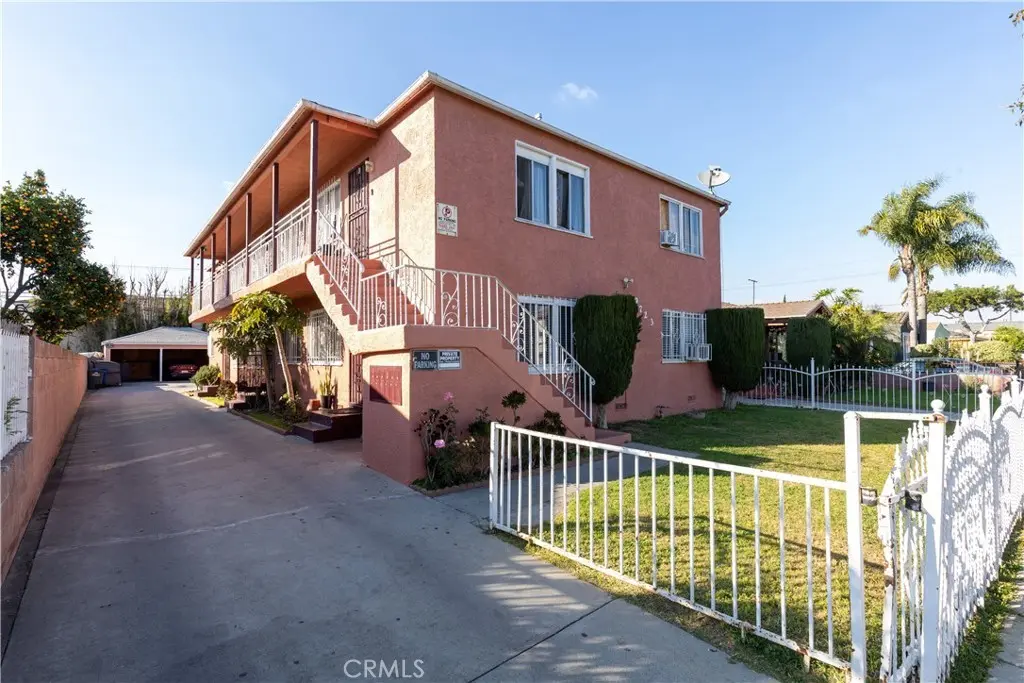
We are pleased to present a rare opportunity to acquire a well-maintained 6-unit multifamily property located in the City of South Gate. The property consists of a two-story building with three units on each level, offering a total of approximately 3,960 sq. ft. of living space on a 7,240 sq. ft. lot. The unit mix includes four (4) one-bedroom, one-bath units and two (2) two-bedroom, one-bath units. Each unit is separately metered and includes one assigned carport parking space. Additionally, the property features an on-site laundry room, providing an extra source of passive income. This building has been thoughtfully upgraded to meet insurance inspection requirements, making it a strong, low-maintenance investment. Major capital improvements include a roof approximately 5 years old, new plumbing throughout the building completed approximately 2 years ago, and interior upgrades in select units, including newly tiled walls and flooring. All six units are equipped with individual fuse boxes, and the main electrical panel was upgraded, along with five new subpanels installed within the last year. The property offers a strong value-add opportunity through rent optimization and continued operational efficiencies. Current rents reflect an approximate 4.06% cap rate, providing immediate, stable cash flow. With strategic rent adjustments to align with market rents, the property demonstrates the potential to achieve an estimated 8% cap rate, significantly enhancing long-term returns. Given the building’s recent capital improvements the asset is well positioned for rent growth with minimal additional capital expenditure. The favorable unit mix of one- and two-bedroom units supports strong tenant demand in the South Gate rental market. Conveniently located near Firestone Blvd and Tweedy Blvd, the property offers excellent access to local amenities. The Azalea Regional Shopping Center is just a 7-minute drive, Northgate González Market is approximately 2 minutes away, and South Gate Park is within a 10-minute drive. The 710 and 105 freeways are nearby, providing easy commuter access throughout Los Angeles County. Drive-by only. Please do not disturb tenants. PC: Quinn Media
Key facts
- Interior upgrades
- On site laundry room
- New plumbing
Tags
Neighborhood map
What this means for you Summary
Snapshot
- This is a 6 × 8-bed/6.0-bath units multifamily listed at $1.50M.
Deal economics
- At list price, monthly cash flow is $5k ($60k/yr) — positive. Per door: $835/mo.
- The deal already cash-flows at list — no discount required.
- Meets the 1% rule at list price ($18k rent vs $1.50M).
- Recommended offer: $1.32M (12.0% below list) — sets the bar for market timing.
- Cap rate 10.3% vs local median 2.8% in South Gate — top-decile yield for the area; either an underpriced asset or a hidden risk that comps aren't pricing in. Stress-test before assuming the spread holds.
Location & tenants
- Location reads 63/100 on livability (#459 in CA) — a middle-class / working-renter tenant base. Strengths: commute A+; Watch: health & safety C-, schools D-, crime F.
- Los Angeles Unified (urban): math 29% / reading 54% proficiency, ranked #223 of 517 in CA (top 43%) — families likely to look elsewhere, expect single-tenant / working-renter base with shorter leases; 67% free/reduced lunch — lower-income household profile, screen leases tightly.
- Market conditions: Rents rising fast (+5.0%/yr); 51 active listings in the ZIP; 19,697 units permitted in Los Angeles County in 2024 (9,426 in 5+ unit buildings).
- At $17,782/mo this rent would consume 286% of the median local household income ($75k/yr) (locally 4041% of renters already pay >50% of income on rent) — very limited rent-growth headroom before tenants either downsize or default.
Forward outlook
- Local home prices are declining (-3.0%/yr); year-one equity from $10k of loan paydown is wiped out by about $45k of value loss. Plan a longer hold.
- Los Angeles County population projected at +9% by 2050 — modest demand growth; plan on rents tracking national, not racing it.
- At projected returns (-3.0% appreciation + 5.0% rent growth), your $420k cash investment doubles in ~8 years — after that, you're playing with house money.
Negotiation context
- It's been on market 139 days — a 12% lower offer ($1.32M) is reasonable based on typical stale-listing flexibility.
- Current owner paid $325k; list at $1.50M implies a 362% gain — meaningful room to come down on a strong offer.
Risks & watch-outs
- Watch-outs: built in 1953 — expect roof / HVAC / electrical / plumbing capex.
- Climate carrying-cost: extreme-heat days projected 7→22/yr by 2055 (HVAC capex compounding) — expect insurance premiums to compound above CPI over the hold.
Questions for the listing agent
- It's been on market 139 days. Have you received any prior offers? Is the seller open to a 12% concession, seller financing, or rate buy-down credit?
- Can we see the unit-by-unit rent roll, current vacancy, and any below-market leases? What's the average tenancy length?
- What capital expenditures (roof, boiler, parking lot, exteriors) have been made in the last 5 years, and what's planned in the next 2?
- Built in 1953 — when were the roof, HVAC, electrical panel, plumbing, and water heater last replaced?
- Why hasn't it sold? Are there any deal-killer items the seller is aware of (foundation, flood, title, zoning, code violations)?
- Is there a deadline driving the sale (1031 exchange, divorce, estate, relocation)? That informs how much negotiation room exists.
- Schools are D-rated, which usually means shorter tenancies and higher turnover. Who's the typical renter profile here, and what's been the actual vacancy rate?
- Crime grade is F in this area — have there been break-ins, vandalism, or insurance claims at this property in the last 3 years? What carrier currently insures it and at what premium?
- What's the average days-on-market for RENTAL listings here right now (not sales)? A rising rental-DOM trend means longer vacancies and softer asking-rent achievability than the comps imply.
- What's the recent tenant-quality profile in this submarket — average credit score on applications, eviction rate, late-payment / NSF rate, and stable-employment percentage? A property-management company in the area should have these aggregated.
- How much new apartment / multifamily construction is in the pipeline within 1–3 miles? Heavy new supply (>2% of stock underway) typically softens rents 12–24 months out; light construction supports rent growth.
Investment metrics
- 1% rule
- 1.19% ✓
- Cap rate
- 10.30%
- Cash-on-cash
- 14.31%
- DSCR
- 1.64
- GRM
- 7.0
CMA / ARV
- ARV (median comp)
- $1,108,149
- List price
- $1,499,999
- Delta
- 35.36%
- Verdict
- OVERPRICED
- Comps
- 20 within 1.0 mi
Show comp detail 6 sales within ~0.75 mi
| Address | Dist | Beds/Ba | Sqft | Sold | Price | $/sf | Match |
|---|---|---|---|---|---|---|---|
| 10007 Otis St | 0.36mi | 8/4.5 | 3,950 (-0%) | 9mo | $1,000,000 | $253 | 69 |
| 9421 Dearborn | 0.55mi | 8/5.0 | 3,968 (+0%) | 2mo | $1,400,000 | $353 | 68 |
| 10245 Virginia Ave | 0.47mi | 9/6.0 (+1) | 3,721 (-6%) | 8mo | $1,450,000 | $390 | 57 |
| 9411 Madison Ave | 0.71mi | 9/4.0 (+1) | 3,641 (-8%) | 1mo | $1,050,000 | $288 | 40 |
| 10112 Virginia Ave | 0.38mi | 9/6.0 (+1) | 3,382 (-15%) | 18mo | $1,135,000 | $336 | 38 |
| 10206 State St | 0.66mi | 9/5.0 (+1) | 3,706 (-6%) | 23mo | $1,295,000 | $349 | 31 |
Match score weights: distance 35% · size 25% · config 20% · recency 20%. Top-matched comps best support the ARV.
Projected returns pro-forma
-3.0% appreciation · 4.95% rent growth · sell at horizon
- IRR
- 6.6%
- Equity multiple
- 1.26×
- Total profit
- $110,947
- Equity at exit
- $223,655
- IRR
- 17.5%
- Equity multiple
- 2.56×
- Total profit
- $657,024
- Equity at exit
- $129,692
Cash invested: $420,000 (down + closing). Projections, not guarantees.
Landlord ↔ Tenant lean methodology
- Overall (STATE)
- 18 Strongly Tenant-Friendly
- State California
- 18 Strongly Tenant-Friendly · D+13
- County
- — inherits STATE
- City
- — inherits STATE
ZIP-level market 90280
- Rents YoY
- 5.0%
- Active inventory
- 51
- Price-to-rent
- 42.2×
Monthly cashflow live
- Estimated rent
- $17,782 medium interval (Pro) →
- Mortgage (P&I)
- −$7,866
- Tax from tax record
- −$548 /mo · $6,578/yr
- Insurance
- −$625
- HOA
- −$0
- Vacancy / Maint / Mgmt
- −$3,734
- Net cashflow
- $5,008
Break-even live
6-unit breakdown (identical units grouped — click to expand)
| Units | Beds | Baths | Est. rent |
|---|---|---|---|
| 6× units | 8 | 6 | $17,784 |
| #1 | 8 | 6 | $2,964 |
| #2 | 8 | 6 | $2,964 |
| #3 | 8 | 6 | $2,964 |
| #4 | 8 | 6 | $2,964 |
| #5 | 8 | 6 | $2,964 |
| #6 | 8 | 6 | $2,964 |
| Total (6 units) | $17,782 | ||
UW: 25.0% down · 7.5% · 30yr · 1.5% tax · 5.0% vac · 8.0% maint · 8.0% mgmt
Financing live
Cash to close
- Down payment
- $375,000
- Closing costs
- $45,000
- Reserves months
- —
- Total cash needed
- —
Loan-product check · same deal, 3 products live
Conventional
25% down · 7.5% · 30yr
- Down + closing
- —
- Monthly P&I
- —
- Monthly cashflow
- —
- DSCR
- —
- Eligible?
- —
Personal DTI + credit; lowest rate.
DSCR
20% down · 8.5% · 30yr
- Down + closing
- —
- Monthly P&I
- —
- Monthly cashflow
- —
- DSCR
- —
- Eligible?
- —
No personal income docs; deal must DSCR.
Hard money
10% down · 12.0% · 12mo
- Down + closing
- —
- Monthly P&I
- —
- Monthly cashflow
- —
- DSCR
- —
- Eligible?
- —
Short-term bridge; refi at stabilization.
Listing history 16 events
-
2026-06-18days on market $1,499,999 Active 139 DOM
-
2026-06-17days on market $1,499,999 Active 138 DOM
-
2026-06-16days on market $1,499,999 Active 137 DOM
-
2026-06-15days on market $1,499,999 Active 136 DOM
-
2026-06-13days on market $1,499,999 Active 134 DOM
-
2026-06-09days on market $1,499,999 Active 130 DOM
-
2026-06-08days on market $1,499,999 Active 129 DOM
-
2026-06-07days on market $1,499,999 Active 128 DOM
-
2026-06-04days on market $1,499,999 Active 125 DOM
-
2026-06-03days on market $1,499,999 Active 124 DOM
-
2026-06-02days on market $1,499,999 Active 123 DOM
-
2026-06-01days on market $1,499,999 Active 122 DOM
-
2026-05-31days on market $1,499,999 Active 121 DOM
-
2026-01-30$1,499,999 Active 2213-char remark
Show marketing remark (2213 chars)
We are pleased to present a rare opportunity to acquire a well-maintained 6-unit multifamily property located in the City of South Gate. The property consists of a two-story building with three units on each level, offering a total of approximately 3,960 sq. ft. of living space on a 7,240 sq. ft. lot. The unit mix includes four (4) one-bedroom, one-bath units and two (2) two-bedroom, one-bath units. Each unit is separately metered and includes one assigned carport parking space. Additionally, the property features an on-site laundry room, providing an extra source of passive income. This building has been thoughtfully upgraded to meet insurance inspection requirements, making it a strong, low-maintenance investment. Major capital improvements include a roof approximately 5 years old, new plumbing throughout the building completed approximately 2 years ago, and interior upgrades in select units, including newly tiled walls and flooring. All six units are equipped with individual fuse boxes, and the main electrical panel was upgraded, along with five new subpanels installed within the last year. The property offers a strong value-add opportunity through rent optimization and continued operational efficiencies. Current rents reflect an approximate 4.06% cap rate, providing immediate, stable cash flow. With strategic rent adjustments to align with market rents, the property demonstrates the potential to achieve an estimated 8% cap rate, significantly enhancing long-term returns. Given the building’s recent capital improvements the asset is well positioned for rent growth with minimal additional capital expenditure. The favorable unit mix of one- and two-bedroom units supports strong tenant demand in the South Gate rental market. Conveniently located near Firestone Blvd and Tweedy Blvd, the property offers excellent access to local amenities. The Azalea Regional Shopping Center is just a 7-minute drive, Northgate González Market is approximately 2 minutes away, and South Gate Park is within a 10-minute drive. The 710 and 105 freeways are nearby, providing easy commuter access throughout Los Angeles County. Drive-by only. Please do not disturb tenants. PC: Quinn Media
-
1988-08-08soldstatus $325,000
-
1988-08-08soldstatus $325,000
ⓘ Source: listings_history table (triggers on properties + properties_extension) + one-shot
backfill from property_details.listing_events for pre-trigger history.
Tax reassessment forecast CA · Resets to sale price
- Current annual tax
- $6,578 · $548/mo
- Projected year-2 tax
- $11,400 · $950/mo
- Expected delta
- +$4,822/yr (+$402/mo · 73.3%)
ⓘ Screening estimate from a state-policy table — verify with the county assessor before closing.
Climate risk First Street
- Flood 1/10 Low FEMA zone X (unshaded) · 0% chance over 30 yrs
- Wildfire 1/10 Low
- Heat 5/10 Major 7 d/yr ≥91°F today · 22 d/yr by 30 yrs out
- Wind 1/10 Low
- Air quality 6/10 Major 10 unhealthy d/yr today · 10 by 30 yrs out
Nearby sold comps map
Loading sold comps map…
Walkable amenities ~0.75 mi
Loading nearby amenities…
Taxation est. · year 1
- Rental income
- $213,384
- − Mortgage interest
- −$84,023
- − Property taxes
- −$6,578
- − Insurance
- −$7,500
- − Repairs & maintenance
- −$17,071
- − Management
- −$17,071
- − Depreciation
- −$43,636
- Taxable income
- $37,505
- Est. tax owed @ 24.0%
- −$9,001
- After-tax cash flow
- $51,101/yr
For passive investors: Depreciation is non-cash, so a rental often shows a tax loss while cash-flowing — sheltering income. Rental losses are passive: they offset passive income freely, and up to $25,000/yr can offset ordinary (W-2) income if you actively participate and your MAGI is under $100k (phasing out to $0 by $150k); unused losses carry forward. On sale, claimed depreciation is recaptured at up to 25%, and gains may owe capital-gains tax (a 1031 exchange can defer both). Figures are a year-1 estimate at your 24.0% rate — not tax advice; consult a CPA.
Schools (NCES district)
- District
- Los Angeles Unified
- NCES district ID
- 0622710
- Math proficiency
- 29% ▼ -4.00%
- Reading proficiency
- 54% ▲ 10.00%
- Median HH income
- $50,403
- Composite
- 35.67/100
- National rank
- #4875
- State rank
- #223 of 517 in CA
Livability — South Gate
- Score
- 63/100
- State rank
- #459
- US rank
- #15665
Category grades
Schools grade is shown separately in the Schools card above.
Census & demographics
- Census place
- South Gate, CA
- County
- Los Angeles County · 9,444,647 people
- City population
- 91,365
- Metro
- Los Angeles-Long Beach-Anaheim, CA
- Population (ZIP)
- 91,365
- Household income
- $74,651
- Rent vs Own
- Severe rent burden
- 4041.0
Population outlook (Los Angeles County) Hauer SSP2
- Today (2025)
- 10,940,515 people
- By 2030
- 11,256,481 · +2.9%
- By 2040
- 11,729,929 · +7.2%
- By 2050
- 11,948,407 · +9.2%
- By 2075
- 11,818,114 · +8.0%
- By 2100
- 10,842,928 · -0.9%
Race, ethnicity, and origin ACS 2023
- Neighborhood character
- Predominantly Hispanic (95%)
- Race & ethnicity
- Hispanic / Latino 95% Two or more races 27% White 3% Native American 2%
- Hispanic origin (detail)
- Mexican 78%
- Foreign-born
- 42% · Canada
- Languages at home
- 16% English-only · Spanish 83%
Political lean MEDSL · Los Angeles
- 2024 margin
- Solid D (+32.9) · D 64.8% · R 31.9% · Other 3.3%
- 2008→2024 swing
- -7.4pp toward R · 2008: 40.4pp · 2024: 32.9pp
- All cycles
- 2024: D+32.9 2020: D+44.2 2016: D+48.0 2012: D+40.0 2008: D+40.4
Not yet ingested
- Civics
- —
Market trends
- HPI YoY
- ▼ -847.77%
- Current HPI
- 419.791
- Rent YoY
- ▲ 4.95%
- Metro
- Los Angeles-Long Beach-Anaheim, CA
- State GDP YoY
- ▲ 3.21%
- F500 in state
- 116
Industry mix (Fortune 500 HQ in CA)
| Industry | F500 HQs | Revenue |
|---|---|---|
| Technology | 27 | $1,492B |
|
||
| Financial Services | 3 | $174B |
|
||
| Retail | 3 | $44B |
|
||
| Insurance | 3 | $26B |
|
||
| Media / Entertainment | 2 | $115B |
|
||
| Pharmaceuticals / Biotech | 2 | $62B |
|
||
Price history
+361.5% since first listed3 events — show timeline
- 2026-01-30 Listed $1,499,999 CRMLS
- 1988-08-08 Sold (Public Records) $325,000 Public Records
- 1988-08-08 Sold (Public Records) $325,000 Public Records
Property tax history
+2.3%/yrLatest (2025): $6,578 · +5.6% YoY. Source: county tax records.
Cash-flow waterfall
monthlySold comps — $/sqft
last 12 mo · ≤1 miLoading sold comps…