330 East Rd · Hume, IL
Flood risk 1/10 · Minimal
- FEMA flood zone
- X (unshaded)
- Chance of flooding over 30 yrs
- 0.0%
- Est. flood insurance / yr
- $507 – $1,088
Fire risk 1/10 · Minimal
- Est. fire insurance / yr
- $804 – $1,492
Heat risk 4/10 · Minor
- Hot days now (above 105°F)
- 7 days/yr
- Hot days in 30 yrs
- 19 days/yr
Wind risk 2/10 · Minimal
- Chance of severe wind over 30 yrs
- 1.0%
Air-quality risk 2/10 · Minimal
- Unhealthy air days now
- 1 days/yr
- Unhealthy air days in 30 yrs
- 2 days/yr
Risk factors via First Street. Map © Google.
Why this score? — see what drove the B+ grade
The composite is a weighted blend of 9 inputs, each scored 0–100. Each bar is that input's sub-score; the figure is the points it added to the 100-point composite (weight × sub-score).
- Cash flow +30.0/30.0
- ARV discount +15.0/15.0
- 1% rule +10.0/10.0
- DSCR +10.0/10.0
- Appreciation +4.6/10.0
- Livability +2.9/5.0
- Rent growth +2.5/5.0
- Condition / age +2.2/5.0
- Schools +1.4/10.0
$79,900
🖨 Deal sheet 📄 Offer letter ✓ Due diligence
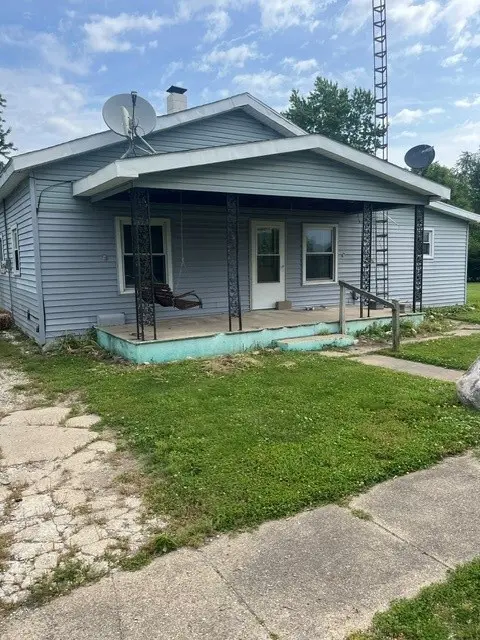
Listing remarks
Use your imagination and make this home your own. This home has been in the same family for over 50 years. The house sits on 2 lots and is being sold with 2 additional lots. The home offers 3 bedrooms and 1 bath. The property has a lot of potential and would make a great starter home. There have been several updates done to the home already which include new doors, newer windows, roof, water heater, some new flooring and a new shed. Home is being sold AS -IS.
Key facts
- Roof
- New doors
- Water heater
Tags
Property features AI
Exterior
- Utilities: Well water; Septic sewer
- Home design: Single-family residence; One story
- Construction: Vinyl siding; Shingle roof
- Exterior features: Front porch; Gravel road access; Shed(s) on property; Lot roughly 0.4 acre (approx. 132 x 231)
Interior
- Kitchen: Oven; Refrigerator
- Bedrooms: 5 total rooms (includes bedrooms and living spaces)
- Bathrooms: 1 full bathroom
- Heating & cooling: Natural gas heating; No central cooling reported
- Interior features: Electric water heater; Crawl space basement
- Laundry & utility: Washer; Dryer; Laundry on main level
Neighborhood map
What this means for you Summary
Snapshot
- This is a 3-bed/1.0-bath single-family listed at $80k. Condition is rated fair.
Deal economics
- At list price, monthly cash flow is $462 ($6k/yr) — positive.
- The deal already cash-flows at list — no discount required.
- Meets the 1% rule at list price ($1k rent vs $80k).
Location & tenants
- Location reads 58/100 on livability (#1,097 in IL) — a working-class tenant base; expect higher turnover. Strengths: cost of living A+, housing A+; Watch: schools F, crime D-, amenities F.
- Shiloh CUSD 1 (rural): math 9% / reading 13% proficiency, ranked #816 of 919 in IL (top 89%) — low school quality limits family demand, transient renter base, plan for 1-2y turnover.
- Market conditions: 2 active listings in the ZIP; 6 units permitted in Edgar County in 2024 (0 in 5+ unit buildings).
Forward outlook
- Local home prices are declining (-0.8%/yr); year-one equity from $552 of loan paydown is wiped out by about $676 of value loss. Plan a longer hold.
- Edgar County population projected at -30% by 2050 — secular population decline; favor cash flow + early exit over multi-decade hold.
- At projected returns (-0.8% appreciation + 3.0% rent growth), your $22k cash investment doubles in ~4 years — after that, you're playing with house money.
Negotiation context
- Only 2 days on market — expect competitive offers; lowballing is unlikely to land.
Risks & watch-outs
- Watch-outs: built in 1950 — expect roof / HVAC / electrical / plumbing capex.
Questions for the listing agent
- Have any recent inspections been done? Can we get a copy of the seller's disclosures and any deferred-maintenance estimates?
- Built in 1950 — when were the roof, HVAC, electrical panel, plumbing, and water heater last replaced?
- Is there a deadline driving the sale (1031 exchange, divorce, estate, relocation)? That informs how much negotiation room exists.
- Schools are F-rated, which usually means shorter tenancies and higher turnover. Who's the typical renter profile here, and what's been the actual vacancy rate?
- Crime grade is D in this area — have there been break-ins, vandalism, or insurance claims at this property in the last 3 years? What carrier currently insures it and at what premium?
- What's the average days-on-market for RENTAL listings here right now (not sales)? A rising rental-DOM trend means longer vacancies and softer asking-rent achievability than the comps imply.
- What's the recent tenant-quality profile in this submarket — average credit score on applications, eviction rate, late-payment / NSF rate, and stable-employment percentage? A property-management company in the area should have these aggregated.
- How much new for-sale + rental construction is in the pipeline within 1–3 miles? Heavy new supply typically softens prices + rents 12–24 months out; constrained supply supports both.
Investment metrics
- 1% rule
- 1.61% ✓
- Cap rate
- 13.24%
- Cash-on-cash
- 24.81%
- DSCR
- 2.10
- GRM
- 5.2
CMA / ARV
- ARV (on-the-fly)
- $102,000
- Comps found
- 1
Show comp detail 1 sale within ~0.75 mi
| Address | Dist | Beds/Ba | Sqft | Sold | Price | $/sf | Match |
|---|---|---|---|---|---|---|---|
| 170 Western Ave | 0.47mi | 2/1.0 (-1) | 1,288 (+7%) | 12mo | $109,900 | $85 | 51 |
Match score weights: distance 35% · size 25% · config 20% · recency 20%. Top-matched comps best support the ARV.
Projected returns pro-forma
-0.85% appreciation · 3.0% rent growth · sell at horizon
- IRR
- 23.2%
- Equity multiple
- 2.07×
- Total profit
- $24,014
- Equity at exit
- $19,878
- IRR
- 28.3%
- Equity multiple
- 3.95×
- Total profit
- $66,003
- Equity at exit
- $21,382
Cash invested: $22,372 (down + closing). Projections, not guarantees.
Landlord ↔ Tenant lean methodology
- Overall (STATE)
- 43 Moderately Tenant-Leaning
- State Illinois
- 43 Moderately Tenant-Leaning · D+7
- County
- — inherits STATE
- City
- — inherits STATE
ZIP-level market 61870
- Home prices YoY
- -0.4%
- Active inventory
- 2
- Price-to-rent
- 5.2×
Monthly cashflow live
- Estimated rent
- $1,284 medium interval (Pro) →
- Mortgage (P&I)
- −$419
- Tax est. 1.5%
- −$100 /mo · $1,198/yr
- Insurance
- −$33
- HOA
- −$0
- Vacancy / Maint / Mgmt
- −$270
- Net cashflow
- $462
Break-even live
UW: 25.0% down · 7.5% · 30yr · 1.5% tax · 5.0% vac · 8.0% maint · 8.0% mgmt
Financing live
Cash to close
- Down payment
- $19,975
- Closing costs
- $2,397
- Reserves months
- —
- Total cash needed
- —
Loan-product check · same deal, 3 products live
Conventional
25% down · 7.5% · 30yr
- Down + closing
- —
- Monthly P&I
- —
- Monthly cashflow
- —
- DSCR
- —
- Eligible?
- —
Personal DTI + credit; lowest rate.
DSCR
20% down · 8.5% · 30yr
- Down + closing
- —
- Monthly P&I
- —
- Monthly cashflow
- —
- DSCR
- —
- Eligible?
- —
No personal income docs; deal must DSCR.
Hard money
10% down · 12.0% · 12mo
- Down + closing
- —
- Monthly P&I
- —
- Monthly cashflow
- —
- DSCR
- —
- Eligible?
- —
Short-term bridge; refi at stabilization.
Listing history 3 events
-
2026-06-05days on market $79,900 Active 2 DOM
-
2026-06-04remarks 463-char remark
-
2026-06-04$79,900 Active 1 DOM
ⓘ Source: listings_history table (triggers on properties + properties_extension) + one-shot
backfill from property_details.listing_events for pre-trigger history.
Climate risk First Street
- Flood 1/10 Low FEMA zone X (unshaded) · 0% chance over 30 yrs
- Wildfire 1/10 Low
- Heat 4/10 Moderate 7 d/yr ≥105°F today · 19 d/yr by 30 yrs out
- Wind 2/10 Low 100% chance of damaging wind over 30 yrs
- Air quality 2/10 Low 1 unhealthy d/yr today · 2 by 30 yrs out
Nearby sold comps map
Loading sold comps map…
Walkable amenities ~0.75 mi
Loading nearby amenities…
Taxation est. · year 1
- Rental income
- $15,412
- − Mortgage interest
- −$4,476
- − Property taxes
- −$1,198
- − Insurance
- −$400
- − Repairs & maintenance
- −$1,233
- − Management
- −$1,233
- − Depreciation
- −$2,324
- Taxable income
- $4,548
- Est. tax owed @ 24.0%
- −$1,092
- After-tax cash flow
- $4,458/yr
For passive investors: Depreciation is non-cash, so a rental often shows a tax loss while cash-flowing — sheltering income. Rental losses are passive: they offset passive income freely, and up to $25,000/yr can offset ordinary (W-2) income if you actively participate and your MAGI is under $100k (phasing out to $0 by $150k); unused losses carry forward. On sale, claimed depreciation is recaptured at up to 25%, and gains may owe capital-gains tax (a 1031 exchange can defer both). Figures are a year-1 estimate at your 24.0% rate — not tax advice; consult a CPA.
Condition & rehab AI · 14 photos
This home requires moderate renovations to improve its condition and increase its value. Upgrading the kitchen and bathroom, repainting the exterior and interior, and replacing the flooring will significantly enhance its appeal.
Repairs flagged
- Major Kitchen cabinets — The cabinets appear outdated and may need replacement.
- Major Bathroom fixtures — The fixtures are dated and may need replacement.
- Major Flooring — The flooring in the kitchen and bathroom appears worn and may need replacement.
- Major Exterior siding — The siding looks weathered and may need repainting or replacement.
- Major Paint — The paint appears to be peeling in some areas and needs repainting.
Value-add opportunities
- Resale Updating the kitchen cabinets and countertops — Updating the kitchen will make it more appealing to potential buyers.
- Resale Updating the bathroom fixtures and flooring — Updating the bathroom will make it more appealing to potential buyers.
- Both Repainting the exterior siding and interior walls — Repainting will improve the curb appeal and interior appearance, benefiting both resale and rental value.
- Both Replacing the flooring — Replacing the flooring will improve the overall appearance and functionality of the home, benefiting both resale and rental value.
Renovation cost estimate screening
| Repair item | Severity | Est. cost |
|---|---|---|
| Kitchen cabinets · The cabinets appear outdated and may need replacement. | Major | $15,000–50,000 |
| Bathroom fixtures · The fixtures are dated and may need replacement. | Major | $15,000–50,000 |
| Flooring · The flooring in the kitchen and bathroom appears worn and may need replacement. | Major | $15,000–50,000 |
| Exterior siding · The siding looks weathered and may need repainting or replacement. | Major | $15,000–50,000 |
| Paint · The paint appears to be peeling in some areas and needs repainting. | Major | $15,000–50,000 |
| Total estimated repair cost · 5 items | $75,000–250,000 |
Value-add ROI direction
- Resale Updating the kitchen cabinets and countertops — Updating the kitchen will make it more appealing to potential buyers. ↑
- Resale Updating the bathroom fixtures and flooring — Updating the bathroom will make it more appealing to potential buyers. ↑
- Both Repainting the exterior siding and interior walls — Repainting will improve the curb appeal and interior appearance, benefiting both resale and rental value. ↑
- Both Replacing the flooring — Replacing the flooring will improve the overall appearance and functionality of the home, benefiting both resale and rental value. ↑
ⓘ Cost ranges are severity-bucket heuristics (US national rule-of-thumb). Get contractor quotes + a written scope before underwriting a rehab budget.
Schools (NCES district)
- District
- Shiloh CUSD 1
- NCES district ID
- 1700122
- Math proficiency
- 9% ▼ -1.00%
- Reading proficiency
- 13% ▼ -7.00%
- Median HH income
- $45,781
- Composite
- 13.65/100
- National rank
- #14481
- State rank
- #816 of 919 in IL
Livability — Hume
- Score
- 58/100
- State rank
- #1097
- US rank
- #20823
Category grades
Schools grade is shown separately in the Schools card above.
Census & demographics
- Census place
- Hume, IL
- City population
- 519
- Population (ZIP)
- 1,153
Population outlook (Edgar County) Hauer SSP2
- Today (2025)
- 15,960 people
- By 2030
- 14,978 · -6.2%
- By 2040
- 12,990 · -18.6%
- By 2050
- 11,087 · -30.5%
- By 2075
- 7,338 · -54.0%
- By 2100
- 4,526 · -71.6%
Race, ethnicity, and origin ACS 2023
- Neighborhood character
- Predominantly White (95%)
- Race & ethnicity
- White 95% Two or more races 3% Hispanic / Latino 2% Black 1%
- Common ancestry
- Serbian 3% Romanian 1% Iranian 1%
- Foreign-born
- 1%
- Languages at home
- 99% English-only · French/Haitian/Cajun 1%
Political lean MEDSL · Edgar
- 2024 margin
- Solid R (+52.4) · D 23.0% · R 75.3% · Other 1.7%
- 2008→2024 swing
- -44.4pp toward R · 2008: -7.9pp · 2024: -52.4pp
- All cycles
- 2024: R+52.4 2020: R+52.5 2016: R+49.5 2012: R+32.8 2008: R+7.9
Not yet ingested
- Civics
- —
Market trends
- HPI YoY
- ▼ -0.85%
- Current HPI
- 219.5996
- Rent YoY
- —
- Metro
- —
- State GDP YoY
- ▲ 1.59%
- F500 in state
- 60
Industry mix (Fortune 500 HQ in IL)
| Industry | F500 HQs | Revenue |
|---|---|---|
| Insurance | 4 | $201B |
|
||
| Consumer Goods | 4 | $87B |
|
||
| Industrial Machinery | 3 | $64B |
|
||
| Healthcare | 2 | $55B |
|
||
| Retail / Pharmacy | 1 | $148B |
|
||
| Agriculture / Food | 1 | $86B |
|
||
Price history
1 event — show timeline
- 2026-06-03 Listed $79,900 CIBR
Cash-flow waterfall
monthlySold comps — $/sqft
last 12 mo · ≤1 miLoading sold comps…