 7-Plex
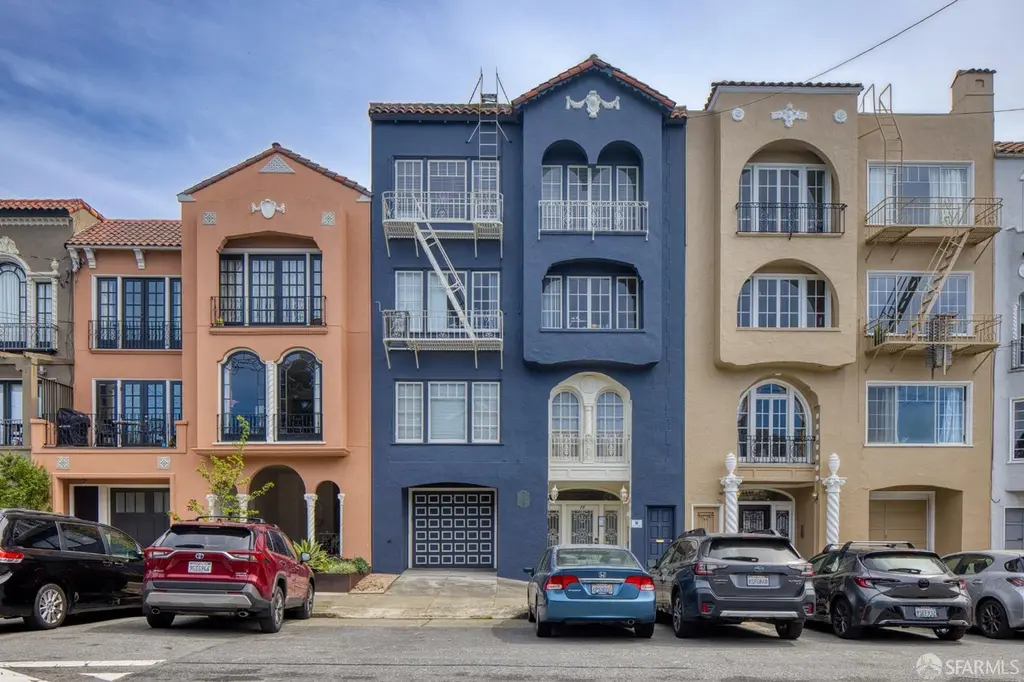
78 Parker Ave · San Francisco, CA
Flood risk 1/10 · Minimal
- FEMA flood zone
- X (unshaded)
- Chance of flooding over 30 yrs
- 0.0%
- Est. flood insurance / yr
- $507 – $1,088
Fire risk 1/10 · Minimal
- Est. fire insurance / yr
- $659 – $1,223
Heat risk 2/10 · Minimal
- Hot days now (above 78°F)
- 7 days/yr
- Hot days in 30 yrs
- 17 days/yr
Wind risk 1/10 · Minimal
- Chance of severe wind over 30 yrs
- —
Air-quality risk 7/10 · Major
- Unhealthy air days now
- 13 days/yr
- Unhealthy air days in 30 yrs
- 13 days/yr
Risk factors via First Street. Map © Google.
Why this score? — see what drove the D grade
The composite is a weighted blend of 9 inputs, each scored 0–100. Each bar is that input's sub-score; the figure is the points it added to the 100-point composite (weight × sub-score).
- Cash flow +10.5/30.0
- Appreciation +9.0/10.0
- Rent growth +5.0/5.0
- Schools +5.0/10.0
- Livability +3.8/5.0
- DSCR +3.0/10.0
- 1% rule +2.5/10.0
- Condition / age +2.5/5.0
- ARV discount +0.0/15.0
$4,350,000
🖨 Deal sheet 📄 Offer letter ✓ Due diligence
Multi-family units
County records classify this as Multi-Family (5+ Unit). Listing-text estimate: 7 units. confirmed
5+ unit building — per-unit beds/baths from public records are typically unavailable; the breakdown below (if shown) is an estimate from the listing text.
Listing remarks MLS
Situated on a prime residential block in Laurel Heights, 78 Parker Avenue presents a well-positioned multifamily investment opportunity in one of San Francisco's most desirable and consistently strong rental neighborhoods. The property offers a quiet, tree-lined setting with close proximity to premier dining, retail, and neighborhood amenities. The subject property consists of a 7-unit apartment building featuring a unit mix of one (1) studio, four (4) one-bedroom units, and two (2) two-bedroom units, offering a balanced and highly rentable configuration. Units feature functional layouts with hardwood flooring, strong natural light, and classic San Francisco charm, with select units updated with modern kitchens and bathrooms. Additional highlights include two (2) on-site parking spaces and on-site laundry. The property has completed the city's mandatory soft-story seismic retrofit program helping to limit near-term capital needs. Ideally located near the Presidio, Laurel Village, Clement and the Sacramento Street retail corridors, the property offers convenient access to parks, neighborhood amenities, and public transportation along California Street, Geary Boulevard, and Park Presidio, supporting strong tenant demand and long-term neighborhood appeal.
Key facts
- On site laundry
- On site parking
- Tree lined setting
Tags
Neighborhood map
What this means for you Summary
Snapshot
- This is a 5×1bd/1ba + 2×2bd/1ba units multifamily listed at $4.35M.
Deal economics
- At list price, monthly cash flow is $-2k ($-27k/yr) — negative. Per door: $-318/mo.
- To cash-flow at today's rent, offer at most $3.96M (9.0% below list).
- To meet the 1% rule (rent ≥ 1% of price), the offer needs to be $3.27M (24.8% below list).
- Recommended offer: $3.27M (24.8% below list) — sets the bar for 1% rule.
- Cap rate 5.7% vs local median 2.1% in San Francisco — top-decile yield for the area; either an underpriced asset or a hidden risk that comps aren't pricing in. Stress-test before assuming the spread holds.
Location & tenants
- Location reads 76/100 on livability (#90 in CA, #3,143 nationally) — a middle-class / working-renter tenant base. Strengths: amenities A+, commute A+, employment A+; Watch: crime F, cost of living F.
- San Francisco Unified (urban): math 50% / reading 56% proficiency, ranked #322 of 1,400 in CA (top 23%) — acceptable for families but not a draw, mixed tenant base, ~2y average lease.
- Market conditions: Rents rising fast (+17.1%/yr); 50 active listings in the ZIP; high-income renter base; 750 units permitted in San Francisco County in 2024 (688 in 5+ unit buildings).
- At $32,733/mo this rent would consume 240% of the median local household income ($164k/yr) (locally 1780% of renters already pay >50% of income on rent) — very limited rent-growth headroom before tenants either downsize or default.
Forward outlook
- In year one you build about $375k of equity ($30k loan paydown + $344k appreciation (7.9% local appreciation)).
- San Francisco County population projected at +39% by 2050 — long-run rental-demand tailwind backs the buy-and-hold thesis.
- By year 2, paydown + projected appreciation supports a ~$600k cash-out refi (75% LTV) — recoverable capital for the next deal without selling this one.
Negotiation context
- It's been on market 66 days — a 6% lower offer ($4.09M) is reasonable based on typical stale-listing flexibility.
- 5 sale attempts since 20y ago with the ask held roughly flat each time — persistent listings suggest the price (not the market) is what's stuck; bring a comps-based counter.
- Current owner paid $122k; list at $4.35M implies a 3451% gain — meaningful room to come down on a strong offer.
Risks & watch-outs
- Watch-outs: built in 1928 — expect roof / HVAC / electrical / plumbing capex.
Questions for the listing agent
- What do current leases actually rent for vs. the listed asking? Can we see a recent rent roll and the last 12 months of T-12 income?
- It's been on market 66 days. Have you received any prior offers? Is the seller open to a 25% concession, seller financing, or rate buy-down credit?
- Can we see the unit-by-unit rent roll, current vacancy, and any below-market leases? What's the average tenancy length?
- What capital expenditures (roof, boiler, parking lot, exteriors) have been made in the last 5 years, and what's planned in the next 2?
- Built in 1928 — when were the roof, HVAC, electrical panel, plumbing, and water heater last replaced?
- Why hasn't it sold? Are there any deal-killer items the seller is aware of (foundation, flood, title, zoning, code violations)?
- Is there a deadline driving the sale (1031 exchange, divorce, estate, relocation)? That informs how much negotiation room exists.
- Schools are B-rated — typically a magnet for longer-tenancy family renters. What's the average tenant stay here, and is there a school-zone premium baked into asking?
- Crime grade is F in this area — have there been break-ins, vandalism, or insurance claims at this property in the last 3 years? What carrier currently insures it and at what premium?
- The area grade is low — what's the realistic commute time and amenity access for the typical tenant pool here? Any planned neighborhood developments (good or bad) we should know about?
- What's the average days-on-market for RENTAL listings here right now (not sales)? A rising rental-DOM trend means longer vacancies and softer asking-rent achievability than the comps imply.
- What's the recent tenant-quality profile in this submarket — average credit score on applications, eviction rate, late-payment / NSF rate, and stable-employment percentage? A property-management company in the area should have these aggregated.
- How much new apartment / multifamily construction is in the pipeline within 1–3 miles? Heavy new supply (>2% of stock underway) typically softens rents 12–24 months out; light construction supports rent growth.
Investment metrics
- 1% rule
- 0.75% ✗
- Cap rate
- 5.68%
- Cash-on-cash
- -2.19%
- DSCR
- 0.90
- GRM
- 11.1
CMA / ARV
- ARV (median comp)
- $3,606,310
- List price
- $4,350,000
- Delta
- 20.62%
- Verdict
- OVERPRICED
- Comps
- 20 within 1.0 mi
Projected returns pro-forma
7.92% appreciation · 8.0% rent growth · sell at horizon
- IRR
- 19.8%
- Equity multiple
- 2.48×
- Total profit
- $1,799,868
- Equity at exit
- $3,280,574
- IRR
- 19.9%
- Equity multiple
- 5.73×
- Total profit
- $5,761,081
- Equity at exit
- $6,488,921
Cash invested: $1,218,000 (down + closing). Projections, not guarantees.
Landlord ↔ Tenant lean methodology
- Overall (CITY)
- 0 Strongly Tenant-Friendly
- State California
- 18 Strongly Tenant-Friendly · D+13
- County
- — inherits STATE
- City San Francisco
- 0 Strongly Tenant-Friendly · D+57
ZIP-level market 94118
- Home prices YoY
- 3.3%
- Rents YoY
- 17.1%
- Active inventory
- 50
- Price-to-rent
- 78.6×
Monthly cashflow live
- Estimated rent
- $32,733 high interval (Pro) →
- Mortgage (P&I)
- −$22,812
- Tax from tax record
- −$3,457 /mo · $41,489/yr
- Insurance
- −$1,812
- HOA
- −$0
- Vacancy / Maint / Mgmt
- −$6,874
- Net cashflow
- $-2,223
Break-even live
7-unit breakdown (identical units grouped — click to expand)
| Units | Beds | Baths | Est. rent |
|---|---|---|---|
| 5× units | 1 | 1 | $23,050 |
| #1 | 1 | 1 | $4,610 |
| #2 | 1 | 1 | $4,610 |
| #3 | 1 | 1 | $4,610 |
| #4 | 1 | 1 | $4,610 |
| #5 | 1 | 1 | $4,610 |
| 2× units | 2 | 1 | $9,684 |
| #6 | 2 | 1 | $4,842 |
| #7 | 2 | 1 | $4,842 |
| Total (7 units) | $32,733 | ||
UW: 25.0% down · 7.5% · 30yr · 1.5% tax · 5.0% vac · 8.0% maint · 8.0% mgmt
Financing live
Cash to close
- Down payment
- $1,087,500
- Closing costs
- $130,500
- Reserves months
- —
- Total cash needed
- —
Loan-product check · same deal, 3 products live
Conventional
25% down · 7.5% · 30yr
- Down + closing
- —
- Monthly P&I
- —
- Monthly cashflow
- —
- DSCR
- —
- Eligible?
- —
Personal DTI + credit; lowest rate.
DSCR
20% down · 8.5% · 30yr
- Down + closing
- —
- Monthly P&I
- —
- Monthly cashflow
- —
- DSCR
- —
- Eligible?
- —
No personal income docs; deal must DSCR.
Hard money
10% down · 12.0% · 12mo
- Down + closing
- —
- Monthly P&I
- —
- Monthly cashflow
- —
- DSCR
- —
- Eligible?
- —
Short-term bridge; refi at stabilization.
Listing history 26 events
-
2026-06-18days on market $4,350,000 Active 66 DOM
-
2026-06-17days on market $4,350,000 Active 65 DOM
-
2026-06-16days on market $4,350,000 Active 64 DOM
-
2026-06-15days on market $4,350,000 Active 63 DOM
-
2026-06-13days on market $4,350,000 Active 61 DOM
-
2026-06-13days on market $4,350,000 Active 60 DOM
-
2026-06-09days on market $4,350,000 Active 57 DOM
-
2026-06-08days on market $4,350,000 Active 56 DOM
-
2026-06-07days on market $4,350,000 Active 55 DOM
-
2026-06-04days on market $4,350,000 Active 52 DOM
-
2026-06-03days on market $4,350,000 Active 51 DOM
-
2026-06-02days on market $4,350,000 Active 50 DOM
-
2026-06-01days on market $4,350,000 Active 49 DOM
-
2026-05-31days on market $4,350,000 Active 48 DOM
-
2026-04-13$4,350,000 Active 1272-char remark
Show marketing remark (1272 chars)
Situated on a prime residential block in Laurel Heights, 78 Parker Avenue presents a well-positioned multifamily investment opportunity in one of San Francisco's most desirable and consistently strong rental neighborhoods. The property offers a quiet, tree-lined setting with close proximity to premier dining, retail, and neighborhood amenities. The subject property consists of a 7-unit apartment building featuring a unit mix of one (1) studio, four (4) one-bedroom units, and two (2) two-bedroom units, offering a balanced and highly rentable configuration. Units feature functional layouts with hardwood flooring, strong natural light, and classic San Francisco charm, with select units updated with modern kitchens and bathrooms. Additional highlights include two (2) on-site parking spaces and on-site laundry. The property has completed the city's mandatory soft-story seismic retrofit program helping to limit near-term capital needs. Ideally located near the Presidio, Laurel Village, Clement and the Sacramento Street retail corridors, the property offers convenient access to parks, neighborhood amenities, and public transportation along California Street, Geary Boulevard, and Park Presidio, supporting strong tenant demand and long-term neighborhood appeal.
-
2024-04-07historical $3,395
-
2024-03-07$3,395
-
2018-08-07soldstatus $122,500
-
2018-08-06soldstatus $20,500
-
2017-08-08soldstatus $84,000
-
2012-12-21soldstatus $2,650,000 Closed
-
2012-12-21soldstatus $2,650,000
-
2012-10-29status Contingent - Show
-
2012-10-11$2,550,000 Active
-
2006-10-04$3,000,000
-
2006-06-06$3,055,000
ⓘ Source: listings_history table (triggers on properties + properties_extension) + one-shot
backfill from property_details.listing_events for pre-trigger history.
Tax reassessment forecast CA · Resets to sale price
- Current annual tax
- $41,489 · $3,457/mo
- Projected year-2 tax
- $41,489 · $3,457/mo
- Expected delta
- $0/yr ($0/mo · 0.0%)
ⓘ Screening estimate from a state-policy table — verify with the county assessor before closing.
Climate risk First Street
- Flood 1/10 Low FEMA zone X (unshaded) · 0% chance over 30 yrs
- Wildfire 1/10 Low
- Heat 2/10 Low 7 d/yr ≥78°F today · 17 d/yr by 30 yrs out
- Wind 1/10 Low
- Air quality 7/10 Severe 13 unhealthy d/yr today · 13 by 30 yrs out
Nearby sold comps map
Loading sold comps map…
Walkable amenities ~0.75 mi
Loading nearby amenities…
Taxation est. · year 1
- Rental income
- $392,796
- − Mortgage interest
- −$243,668
- − Property taxes
- −$41,489
- − Insurance
- −$21,750
- − Repairs & maintenance
- −$31,424
- − Management
- −$31,424
- − Depreciation
- −$126,545
- Taxable loss
- −$103,503
- Est. tax savings @ 24.0%
- +$24,841
- After-tax cash flow
- $-1,832/yr
For passive investors: Depreciation is non-cash, so a rental often shows a tax loss while cash-flowing — sheltering income. Rental losses are passive: they offset passive income freely, and up to $25,000/yr can offset ordinary (W-2) income if you actively participate and your MAGI is under $100k (phasing out to $0 by $150k); unused losses carry forward. On sale, claimed depreciation is recaptured at up to 25%, and gains may owe capital-gains tax (a 1031 exchange can defer both). Figures are a year-1 estimate at your 24.0% rate — not tax advice; consult a CPA.
Schools (NCES district)
- District
- San Francisco Unified
- NCES district ID
- 0634410
- Math proficiency
- 50% ▬ 0.00%
- Reading proficiency
- 56% ▲ 1.00%
- Median HH income
- $81,249
- Composite
- 50.14/100
- National rank
- #4088
- State rank
- #322 of 1400 in CA
Livability — San Francisco
- Score
- 76/100
- State rank
- #90
- US rank
- #3143
Category grades
Schools grade is shown separately in the Schools card above.
Census & demographics
- Census place
- San Francisco, CA
- County
- San Francisco County · 827,552 people
- City population
- 827,552
- Metro
- San Francisco-Oakland-Berkeley, CA
- Population (ZIP)
- 39,130
- Household income
- $163,995
- Rent vs Own
- Severe rent burden
- 1780.0
Population outlook (San Francisco County) Hauer SSP2
- Today (2025)
- 1,030,936 people
- By 2030
- 1,110,409 · +7.7%
- By 2040
- 1,270,010 · +23.2%
- By 2050
- 1,435,001 · +39.2%
- By 2075
- 1,779,074 · +72.6%
- By 2100
- 1,966,767 · +90.8%
Race, ethnicity, and origin ACS 2023
- Neighborhood character
- Diverse neighborhood (Simpson 0.64)
- Race & ethnicity
- White 49% Asian 32% Two or more races 10% Hispanic / Latino 10% Black 1%
- Hispanic origin (detail)
- Mexican 6%
- Common ancestry
- Romanian 3% Italian 3% Scotch-Irish 2%
- Foreign-born
- 25% · China, Canada, South Korea
- Languages at home
- 65% English-only · Chinese 15% Spanish 6% Other Indo-European 3%
Political lean MEDSL · San Francisco
- 2024 margin
- Solid D (+64.8) · D 80.3% · R 15.5% · Other 4.1%
- 2008→2024 swing
- -5.7pp toward R · 2008: 70.5pp · 2024: 64.8pp
- All cycles
- 2024: D+64.8 2020: D+72.5 2016: D+76.1 2012: D+70.2 2008: D+70.5
Not yet ingested
- Civics
- —
Market trends
- HPI YoY
- ▲ 7.92%
- Current HPI
- 250.5205
- Rent YoY
- ▲ 17.14%
- Metro
- San Francisco-Oakland-Berkeley, CA
- State GDP YoY
- ▲ 3.21%
- F500 in state
- 116
Industry mix (Fortune 500 HQ in CA)
| Industry | F500 HQs | Revenue |
|---|---|---|
| Technology | 27 | $1,492B |
|
||
| Financial Services | 3 | $174B |
|
||
| Retail | 3 | $44B |
|
||
| Insurance | 3 | $26B |
|
||
| Media / Entertainment | 2 | $115B |
|
||
| Pharmaceuticals / Biotech | 2 | $62B |
|
||
Price history
+42.4% since first listed12 events — show timeline
- 2026-04-13 Listed $4,350,000 San Francisco MLS
- 2024-04-07 Rental Removed $3,395 RENT.
- 2024-03-07 Listed for Rent $3,395 RENT.
- 2018-08-07 Sold (Public Records) $122,500 Public Records
- 2018-08-06 Sold (Public Records) $20,500 Public Records
- 2017-08-08 Sold (Public Records) $84,000 Public Records
- 2012-12-21 Sold (Public Records) $2,650,000 Public Records
- 2012-12-21 Sold (MLS) $2,650,000 San Francisco MLS
- 2012-10-29 Pending — San Francisco MLS
- 2012-10-11 Listed $2,550,000 San Francisco MLS
- 2006-10-04 Listed $3,000,000 San Francisco MLS
- 2006-06-06 Listed $3,055,000 San Francisco MLS
Property tax history
+10.3%/yrLatest (2025): $41,489 · +3.7% YoY. Source: county tax records.
Cash-flow waterfall
monthlySold comps — $/sqft
last 12 mo · ≤1 miLoading sold comps…