 Fourplex
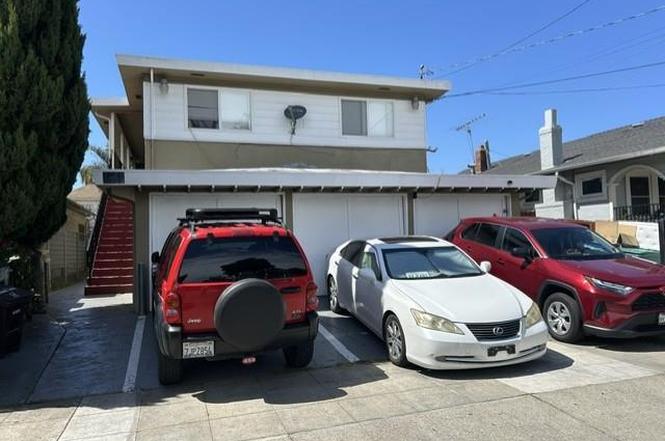
1669 85th Ave · Oakland, CA
Flood risk 1/10 · Minimal
- FEMA flood zone
- X (unshaded)
- Chance of flooding over 30 yrs
- 0.0%
- Est. flood insurance / yr
- $507 – $1,088
Fire risk 1/10 · Minimal
- Est. fire insurance / yr
- $659 – $1,223
Heat risk 4/10 · Minor
- Hot days now (above 84°F)
- 7 days/yr
- Hot days in 30 yrs
- 15 days/yr
Wind risk 1/10 · Minimal
- Chance of severe wind over 30 yrs
- —
Air-quality risk 8/10 · Major
- Unhealthy air days now
- 14 days/yr
- Unhealthy air days in 30 yrs
- 14 days/yr
Risk factors via First Street. Map © Google.
Why this score? — see what drove the D grade
The composite is a weighted blend of 9 inputs, each scored 0–100. Each bar is that input's sub-score; the figure is the points it added to the 100-point composite (weight × sub-score).
- Cash flow +18.1/30.0
- DSCR +5.7/10.0
- 1% rule +5.3/10.0
- Rent growth +4.1/5.0
- Livability +3.6/5.0
- Schools +3.0/10.0
- Condition / age +2.5/5.0
- ARV discount +0.0/15.0
- Appreciation +0.0/10.0
$850,000
🖨 Deal sheet 📄 Offer letter ✓ Due diligence
Multi-family units
County records classify this as Multi-Family (2-4 Unit). Listing-text estimate: 4 units. confirmed
Listing remarks
Great Investment Opportunity 4 plex with three large 2 bedrooms/1 bath units and 1 bedroom/1 bath unit. Enclosed 3 car garages, well maintained building with endless possibilities. Two units have been updated in the past five years, Unit C, kitchen and bath was updated in 2025, and Unit D bath was updated 3 years ago. Unit B bath and kitchen were updated, water heater replaced, new flooring done 2 years ago, and 4th unit is original with a replaced water heater done in June 2026. The roof is approximately 12yrs old. Installation of a wrought iron railing leading to the second floor. In the backyard, each unit has an assigned storage for tenants' extra items and a large backyard for gatherin
Key facts
- Updated bath
- New flooring
- 5,300 sq ft lot
Tags
Property features AI
Finance
- Financial info: Annual rental income $84,600; Annual gross income $84,600; Gross scheduled income $84,600; Gross rent multiplier 10.05; Unit rents: Unit 1 $1,200; Unit 2 $2,200; Unit 3 $1,650; Unit 4 $2,000; Total expenses approximately $16,646; other expenses $600; City transfer tax applies
Exterior
- Parking: Parking area available; 3-car garage spaces
- Utilities: Public water; Public sewer; Public utilities available
- Home design: Individual ownership; One building with 4 units across 2 stories; Living area total reported as 3,152
- Construction: Concrete perimeter and slab foundation
- Exterior features: Flat/low pitch roof; Residential zoning
Interior
- Kitchen: Rents indicate separate kitchens per unit (rental amounts listed for each unit)
- Bedrooms: Unit 1: 1 bedroom; Unit 2: 2 bedrooms; Unit 3: 2 bedrooms; Unit 4: 2 bedrooms
- Bathrooms: Unit 1: 1 full bathroom; Unit 2: 1 full bathroom; Unit 3: 1 full bathroom; Unit 4: 1 full bathroom
- Heating & cooling: Wall furnace heating
- Interior features: Four-unit building with individual tenant electric and gas meters; Annual gross rental income of $84,600; Gross rent multiplier of 10.05; Total annual expenses approximately $16,646; other expenses listed at $600
- Laundry & utility: Tenants pay for electric and gas; Separate electric and separate gas meters
Neighborhood map
What this means for you Summary
Snapshot
- This is a 3×2bd/1.0ba + 1×1bd/1.0ba units multifamily listed at $850k.
Deal economics
- At list price, monthly cash flow is $742 ($9k/yr) — positive. Per door: $185/mo.
- The deal already cash-flows at list — no discount required.
- Meets the 1% rule at list price ($9k rent vs $850k).
- Cap rate 7.3% vs local median 2.4% in Oakland — top-decile yield for the area; either an underpriced asset or a hidden risk that comps aren't pricing in. Stress-test before assuming the spread holds.
Location & tenants
- Location reads 71/100 on livability (#224 in CA) — a middle-class / working-renter tenant base. Strengths: amenities A+, commute A+, employment A+; Watch: schools C-, crime F, cost of living F.
- Oakland Unified (urban): math 27% / reading 33% proficiency, ranked #1,007 of 1,400 in CA (top 72%) — families likely to look elsewhere, expect single-tenant / working-renter base with shorter leases; 68% free/reduced lunch — lower-income household profile, screen leases tightly.
- Market conditions: Rents rising fast (+6.5%/yr); 83 active listings in the ZIP; 1,742 units permitted in Alameda County in 2024 (856 in 5+ unit buildings).
- At $8,722/mo this rent would consume 201% of the median local household income ($52k/yr) (locally 2404% of renters already pay >50% of income on rent) — very limited rent-growth headroom before tenants either downsize or default.
Forward outlook
- Local home prices are declining (-3.0%/yr); year-one equity from $6k of loan paydown is wiped out by about $26k of value loss. Plan a longer hold.
- Alameda County population projected at +34% by 2050 — long-run rental-demand tailwind backs the buy-and-hold thesis.
Negotiation context
- Only 2 days on market — expect competitive offers; lowballing is unlikely to land.
- 6 sale attempts since 21y ago with the ask held roughly flat each time — persistent listings suggest the price (not the market) is what's stuck; bring a comps-based counter.
Questions for the listing agent
- Can we see the unit-by-unit rent roll, current vacancy, and any below-market leases? What's the average tenancy length?
- What capital expenditures (roof, boiler, parking lot, exteriors) have been made in the last 5 years, and what's planned in the next 2?
- Built in 1960 — when were the roof, HVAC, electrical panel, plumbing, and water heater last replaced?
- Is there a deadline driving the sale (1031 exchange, divorce, estate, relocation)? That informs how much negotiation room exists.
- Crime grade is F in this area — have there been break-ins, vandalism, or insurance claims at this property in the last 3 years? What carrier currently insures it and at what premium?
- The area grade is low — what's the realistic commute time and amenity access for the typical tenant pool here? Any planned neighborhood developments (good or bad) we should know about?
- What's the average days-on-market for RENTAL listings here right now (not sales)? A rising rental-DOM trend means longer vacancies and softer asking-rent achievability than the comps imply.
- What's the recent tenant-quality profile in this submarket — average credit score on applications, eviction rate, late-payment / NSF rate, and stable-employment percentage? A property-management company in the area should have these aggregated.
- How much new apartment / multifamily construction is in the pipeline within 1–3 miles? Heavy new supply (>2% of stock underway) typically softens rents 12–24 months out; light construction supports rent growth.
Investment metrics
- 1% rule
- 1.03% ✓
- Cap rate
- 7.34%
- Cash-on-cash
- 3.74%
- DSCR
- 1.17
- GRM
- 8.1
CMA / ARV
- ARV (on-the-fly)
- $706,048
- Comps found
- 7
Show comp detail 7 sales within ~0.75 mi
| Address | Dist | Beds/Ba | Sqft | Sold | Price | $/sf | Match |
|---|---|---|---|---|---|---|---|
| 1749 84th Ave | 0.11mi | 8/4.0 (+1) | 3,456 (+10%) | 8mo | $870,000 | $252 | 67 |
| 1532 90th Ave | 0.36mi | 6/4.0 (-1) | 2,775 (-12%) | 5mo | $402,000 | $145 | 54 |
| 9318 Olive St | 0.55mi | 8/4.0 (+1) | 3,506 (+11%) | 6mo | $682,000 | $195 | 46 |
| 2336 92nd Ave | 0.63mi | 8/4.0 (+1) | 3,346 (+6%) | 15mo | $750,000 | $224 | 43 |
| 2324 92nd Ave | 0.61mi | 8/4.0 (+1) | 3,346 (+6%) | 18mo | $855,000 | $256 | 41 |
| 8836 Dowling St | 0.53mi | 8/4.0 (+1) | 2,900 (-8%) | 19mo | $885,000 | $305 | 41 |
| 1131 88th Ave | 0.51mi | 7/3.0 | 2,700 (-14%) | 24mo | $565,000 | $209 | 28 |
Match score weights: distance 35% · size 25% · config 20% · recency 20%. Top-matched comps best support the ARV.
Projected returns pro-forma
-3.0% appreciation · 6.45% rent growth · sell at horizon
- IRR
- -6.4%
- Equity multiple
- 0.75×
- Total profit
- $-58,884
- Equity at exit
- $126,738
- IRR
- 7.1%
- Equity multiple
- 1.63×
- Total profit
- $148,756
- Equity at exit
- $73,492
Cash invested: $238,000 (down + closing). Projections, not guarantees.
Landlord ↔ Tenant lean methodology
- Overall (CITY)
- 0 Strongly Tenant-Friendly
- State California
- 18 Strongly Tenant-Friendly · D+13
- County
- — inherits STATE
- City Oakland
- 0 Strongly Tenant-Friendly · D+62
ZIP-level market 94621
- Rents YoY
- 6.5%
- Active inventory
- 83
- Price-to-rent
- 32.1×
Monthly cashflow live
- Estimated rent
- $8,722 high interval (Pro) →
- Mortgage (P&I)
- −$4,457
- Tax from tax record
- −$1,337 /mo · $16,046/yr
- Insurance
- −$354
- HOA
- −$0
- Vacancy / Maint / Mgmt
- −$1,832
- Net cashflow
- $742
Break-even live
4-unit breakdown (identical units grouped — click to expand)
| Units | Beds | Baths | Est. rent |
|---|---|---|---|
| 3× units | 2 | 1 | $6,630 |
| #1 | 2 | 1 | $2,210 |
| #2 | 2 | 1 | $2,210 |
| #3 | 2 | 1 | $2,210 |
| 1× unit | 1 | 1 | $2,092 |
| Total (4 units) | $8,722 | ||
UW: 25.0% down · 7.5% · 30yr · 1.5% tax · 5.0% vac · 8.0% maint · 8.0% mgmt
Financing live
Cash to close
- Down payment
- $212,500
- Closing costs
- $25,500
- Reserves months
- —
- Total cash needed
- —
Loan-product check · same deal, 3 products live
Conventional
25% down · 7.5% · 30yr
- Down + closing
- —
- Monthly P&I
- —
- Monthly cashflow
- —
- DSCR
- —
- Eligible?
- —
Personal DTI + credit; lowest rate.
DSCR
20% down · 8.5% · 30yr
- Down + closing
- —
- Monthly P&I
- —
- Monthly cashflow
- —
- DSCR
- —
- Eligible?
- —
No personal income docs; deal must DSCR.
Hard money
10% down · 12.0% · 12mo
- Down + closing
- —
- Monthly P&I
- —
- Monthly cashflow
- —
- DSCR
- —
- Eligible?
- —
Short-term bridge; refi at stabilization.
Listing history 3 events
-
2026-06-18days on market $850,000 Active 2 DOM
-
2026-06-17remarks 699-char remark
-
2026-06-17$850,000 Active 1 DOM
ⓘ Source: listings_history table (triggers on properties + properties_extension) + one-shot
backfill from property_details.listing_events for pre-trigger history.
Tax reassessment forecast CA · Resets to sale price
- Current annual tax
- $16,046 · $1,337/mo
- Projected year-2 tax
- $16,046 · $1,337/mo
- Expected delta
- $0/yr ($0/mo · 0.0%)
ⓘ Screening estimate from a state-policy table — verify with the county assessor before closing.
Climate risk First Street
- Flood 1/10 Low FEMA zone X (unshaded) · 0% chance over 30 yrs
- Wildfire 1/10 Low
- Heat 4/10 Moderate 7 d/yr ≥84°F today · 15 d/yr by 30 yrs out
- Wind 1/10 Low
- Air quality 8/10 Severe 14 unhealthy d/yr today · 14 by 30 yrs out
Nearby sold comps map
Loading sold comps map…
Walkable amenities ~0.75 mi
Loading nearby amenities…
Taxation est. · year 1
- Rental income
- $104,664
- − Mortgage interest
- −$47,613
- − Property taxes
- −$16,046
- − Insurance
- −$4,250
- − Repairs & maintenance
- −$8,373
- − Management
- −$8,373
- − Depreciation
- −$24,727
- Taxable loss
- −$4,719
- Est. tax savings @ 24.0%
- +$1,133
- After-tax cash flow
- $10,031/yr
For passive investors: Depreciation is non-cash, so a rental often shows a tax loss while cash-flowing — sheltering income. Rental losses are passive: they offset passive income freely, and up to $25,000/yr can offset ordinary (W-2) income if you actively participate and your MAGI is under $100k (phasing out to $0 by $150k); unused losses carry forward. On sale, claimed depreciation is recaptured at up to 25%, and gains may owe capital-gains tax (a 1031 exchange can defer both). Figures are a year-1 estimate at your 24.0% rate — not tax advice; consult a CPA.
Schools (NCES district)
- District
- Oakland Unified
- NCES district ID
- 0628050
- Math proficiency
- 27% ▬ 0.00%
- Reading proficiency
- 33% ▬ 0.00%
- Median HH income
- $55,194
- Composite
- 29.52/100
- National rank
- #11769
- State rank
- #1007 of 1400 in CA
Livability — Oakland
- Score
- 71/100
- State rank
- #224
- US rank
- #7245
Category grades
Schools grade is shown separately in the Schools card above.
Census & demographics
- Census place
- Oakland, CA
- County
- Alameda County · 1,614,355 people
- City population
- 385,993
- Metro
- San Francisco-Oakland-Berkeley, CA
- Population (ZIP)
- 33,840
- Household income
- $52,049
- Rent vs Own
- Severe rent burden
- 2404.0
Population outlook (Alameda County) Hauer SSP2
- Today (2025)
- 1,928,884 people
- By 2030
- 2,069,146 · +7.3%
- By 2040
- 2,338,405 · +21.2%
- By 2050
- 2,586,608 · +34.1%
- By 2075
- 3,061,911 · +58.7%
- By 2100
- 3,234,133 · +67.7%
Race, ethnicity, and origin ACS 2023
- Neighborhood character
- Majority Hispanic (63%)
- Race & ethnicity
- Hispanic / Latino 63% Black 24% Two or more races 14% White 6% Asian 4% Native American 2%
- Hispanic origin (detail)
- Mexican 41%
- Common ancestry
- Italian 1%
- Foreign-born
- 35% · Canada, China, Vietnam
- Languages at home
- 40% English-only · Spanish 53% Arabic 2% Other Asian/Pacific 2%
Political lean MEDSL · Alameda
- 2024 margin
- Solid D (+53.6) · D 74.6% · R 21.0% · Other 4.4%
- 2008→2024 swing
- -5.9pp toward R · 2008: 59.5pp · 2024: 53.6pp
- All cycles
- 2024: D+53.6 2020: D+62.5 2016: D+64.4 2012: D+59.8 2008: D+59.5
Not yet ingested
- Civics
- —
Market trends
- HPI YoY
- ▼ -346.43%
- Current HPI
- 523.2253
- Rent YoY
- ▲ 6.45%
- Metro
- San Francisco-Oakland-Berkeley, CA
- State GDP YoY
- ▲ 3.21%
- F500 in state
- 116
Industry mix (Fortune 500 HQ in CA)
| Industry | F500 HQs | Revenue |
|---|---|---|
| Technology | 27 | $1,492B |
|
||
| Financial Services | 3 | $174B |
|
||
| Retail | 3 | $44B |
|
||
| Insurance | 3 | $26B |
|
||
| Media / Entertainment | 2 | $115B |
|
||
| Pharmaceuticals / Biotech | 2 | $62B |
|
||
Price history
+750.0% since first listed23 events — show timeline
- 2026-06-16 Listing Removed — bridgeMLS, Bay East AOR, or Contra Costa AOR
- 2026-06-16 Listing Removed — bridgeMLS, Bay East AOR, or Contra Costa AOR
- 2026-06-16 Listed $850,000 MLSListings
- 2026-06-16 Listed $850,000 bridgeMLS, Bay East AOR, or Contra Costa AOR
- 2021-12-10 Sold (MLS) $875,000 bridgeMLS, Bay East AOR, or Contra Costa AOR
- 2021-12-10 Sold (MLS) $875,000 MLSListings
- 2021-12-07 Sold (Public Records) $875,000 Public Records
- 2021-11-05 Pending — MLSListings
- 2021-07-26 Listed $889,000 MLSListings
- 2021-07-26 Listed $889,000 bridgeMLS, Bay East AOR, or Contra Costa AOR
- 2014-09-16 Listing Removed — bridgeMLS, Bay East AOR, or Contra Costa AOR
- 2014-09-16 Listing Removed — bridgeMLS, Bay East AOR, or Contra Costa AOR
- 2014-09-16 Listing Removed — bridgeMLS, Bay East AOR, or Contra Costa AOR
- 2009-01-30 Sold (MLS) $229,000 bridgeMLS, Bay East AOR, or Contra Costa AOR
- 2009-01-13 Listing Removed — bridgeMLS, Bay East AOR, or Contra Costa AOR
- 2009-01-11 Listed $229,900 bridgeMLS, Bay East AOR, or Contra Costa AOR
- 2008-12-15 Listing Removed — bridgeMLS, Bay East AOR, or Contra Costa AOR
- 2005-10-04 Sold (Public Records) $651,500 Public Records
- 2005-10-04 Sold (MLS) $651,500 bridgeMLS, Bay East AOR, or Contra Costa AOR
- 2005-08-24 Listing Removed — bridgeMLS, Bay East AOR, or Contra Costa AOR
- 2005-08-04 Listed $629,500 bridgeMLS, Bay East AOR, or Contra Costa AOR
- 2002-01-14 Sold (Public Records) $395,000 Public Records
- 1980-03-01 Sold (Public Records) $100,000 Public Records
Property tax history
+2.5%/yrLatest (2025): $16,046 · +4.3% YoY. Source: county tax records.
Cash-flow waterfall
monthlySold comps — $/sqft
last 12 mo · ≤1 miLoading sold comps…