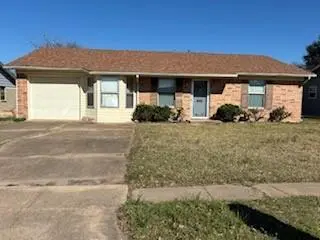
4212 Platte Dr · Balch Springs, TX
Flood risk 1/10 · Minimal
- FEMA flood zone
- X (unshaded)
- Chance of flooding over 30 yrs
- 0.0%
- Est. flood insurance / yr
- $507 – $1,088
Fire risk 3/10 · Minor
- Est. fire insurance / yr
- $1,222 – $2,270
Heat risk 7/10 · Major
- Hot days now (above 110°F)
- 7 days/yr
- Hot days in 30 yrs
- 24 days/yr
Wind risk 6/10 · Moderate
- Chance of severe wind over 30 yrs
- 27.0%
Air-quality risk 2/10 · Minimal
- Unhealthy air days now
- 1 days/yr
- Unhealthy air days in 30 yrs
- 1 days/yr
Risk factors via First Street. Map © Google.
Why this score? — see what drove the C- grade
The composite is a weighted blend of 9 inputs, each scored 0–100. Each bar is that input's sub-score; the figure is the points it added to the 100-point composite (weight × sub-score).
- Cash flow +16.2/30.0
- ARV discount +14.8/15.0
- 1% rule +5.4/10.0
- DSCR +5.0/10.0
- Livability +3.4/5.0
- Schools +2.9/10.0
- Rent growth +2.5/5.0
- Condition / age +2.5/5.0
- Appreciation +0.0/10.0
$185,000
🖨 Deal sheet 📄 Offer letter ✓ Due diligence
Listing remarks MLS
A well-located property just minutes from downtown Dallas, this 3-bedroom, 2-bath single-story ranch style home is ready for its next owner. This home is priced to reflect updates needed. The property features spacious rooms, solid structure, and a large backyard in a great neighborhood just steps from a local park, community water park, and skate park. While the home is in need of updates, the location and layout make it a perfect project for investors or owner-occupants looking to add value and their own style. Property sold as is.
Key facts
- Local park
- Large backyard
- Community water park
Tags
Neighborhood map
What this means for you Summary
Snapshot
- This is a 3-bed/2.0-bath single-family listed at $185k.
Deal economics
- At list price, monthly cash flow is $97 ($1k/yr) — positive.
- The deal already cash-flows at list — no discount required.
- Meets the 1% rule at list price ($2k rent vs $185k).
- Recommended offer: $174k (6.0% below list) — sets the bar for market timing.
- Cap rate 6.9% vs local median 4.7% in Balch Springs — top-decile yield for the area; either an underpriced asset or a hidden risk that comps aren't pricing in. Stress-test before assuming the spread holds.
Location & tenants
- Location reads 68/100 on livability (#487 in TX) — a middle-class / working-renter tenant base. Strengths: cost of living A+, housing A+, health & safety B+; Watch: employment D, schools F, crime F.
- Mesquite ISD (suburban): math 35% / reading 32% proficiency, ranked #536 of 826 in TX (top 65%) — families likely to look elsewhere, expect single-tenant / working-renter base with shorter leases; 63% free/reduced lunch — lower-income household profile, screen leases tightly.
- Market conditions: 85 active listings in the ZIP; 19 comparable units currently listed for rent nearby; rentals at typical pace (median 22d on market — plan ~3-4 weeks tenant-placement turnaround); 12,577 units permitted in Dallas County in 2024 (6,829 in 5+ unit buildings).
- This rent runs 35% of the median local income ($67k/yr) — at the standard rent-burdened threshold; future hikes will face affordability resistance.
Forward outlook
- Local home prices are declining (-3.0%/yr); year-one equity from $1k of loan paydown is wiped out by about $6k of value loss. Plan a longer hold.
- Dallas County population projected at +35% by 2050 — long-run rental-demand tailwind backs the buy-and-hold thesis.
Negotiation context
- It's been on market 68 days — a 6% lower offer ($174k) is reasonable based on typical stale-listing flexibility.
Risks & watch-outs
- Climate carrying-cost: major wind risk, 27% chance of damaging wind over 30y; extreme-heat days projected 7→24/yr by 2055 (HVAC capex compounding) — expect insurance premiums to compound above CPI over the hold.
Questions for the listing agent
- It's been on market 68 days. Have you received any prior offers? Is the seller open to a 6% concession, seller financing, or rate buy-down credit?
- Built in 1967 — when were the roof, HVAC, electrical panel, plumbing, and water heater last replaced?
- Why hasn't it sold? Are there any deal-killer items the seller is aware of (foundation, flood, title, zoning, code violations)?
- Is there a deadline driving the sale (1031 exchange, divorce, estate, relocation)? That informs how much negotiation room exists.
- Schools are F-rated, which usually means shorter tenancies and higher turnover. Who's the typical renter profile here, and what's been the actual vacancy rate?
- Crime grade is F in this area — have there been break-ins, vandalism, or insurance claims at this property in the last 3 years? What carrier currently insures it and at what premium?
- What's the average days-on-market for RENTAL listings here right now (not sales)? A rising rental-DOM trend means longer vacancies and softer asking-rent achievability than the comps imply.
- What's the recent tenant-quality profile in this submarket — average credit score on applications, eviction rate, late-payment / NSF rate, and stable-employment percentage? A property-management company in the area should have these aggregated.
- How much new for-sale + rental construction is in the pipeline within 1–3 miles? Heavy new supply typically softens prices + rents 12–24 months out; constrained supply supports both.
Investment metrics
- 1% rule
- 1.04% ✓
- Cap rate
- 6.92%
- Cash-on-cash
- 2.25%
- DSCR
- 1.10
- GRM
- 8.0
CMA / ARV
- ARV (median comp)
- $220,797
- List price
- $185,000
- Delta
- -16.21%
- Verdict
- UNDERPRICED
- Comps
- 20 within 1.0 mi
Show comp detail 12 sales within ~0.75 mi
| Address | Dist | Beds/Ba | Sqft | Sold | Price | $/sf | Match |
|---|---|---|---|---|---|---|---|
| 4212 Platte Dr | 0.00mi | 3/2.0 | 1,131 (0%) | 1mo | $185,000 | $164 | 100 |
| 14520 Cimarron Dr | 0.31mi | 3/2.0 | 1,144 (+1%) | 6mo | $229,900 | $201 | 79 |
| 14307 S Marsha Dr | 0.20mi | 3/1.5 | 1,190 (+5%) | 4mo | $224,999 | $189 | 77 |
| 3925 Sapling Dr | 0.24mi | 3/2.0 | 1,055 (-7%) | 3mo | $245,000 | $232 | 75 |
| 14004 Cimarron Dr | 0.50mi | 3/1.5 | 1,147 (+1%) | 1mo | $169,900 | $148 | 72 |
| 204002 Cochise Dr | 0.39mi | 3/1.5 | 1,130 (-0%) | 10mo | $204,500 | $181 | 71 |
| 13223 Brandywine Ln | 0.34mi | 3/1.5 | 1,092 (-3%) | 7mo | $199,950 | $183 | 71 |
| 4704 Kristie Dr | 0.44mi | 3/2.0 | 1,155 (+2%) | 8mo | $225,000 | $195 | 70 |
| 4732 Kristie Dr | 0.52mi | 3/1.5 | 1,137 (+0%) | 9mo | $180,000 | $158 | 66 |
| 4621 Kyle Dr | 0.45mi | 4/2.0 (+1) | 1,200 (+6%) | 5mo | $219,000 | $183 | 60 |
| 4306 Linda Ln | 0.73mi | 3/2.0 | 1,030 (-9%) | 5mo | $249,900 | $243 | 46 |
| 14311 Seminole St | 0.56mi | 3/1.0 | 1,280 (+13%) | 8mo | $180,000 | $141 | 41 |
Match score weights: distance 35% · size 25% · config 20% · recency 20%. Top-matched comps best support the ARV.
Projected returns pro-forma
-3.0% appreciation · 3.0% rent growth · sell at horizon
- IRR
- -12.7%
- Equity multiple
- 0.54×
- Total profit
- $-23,661
- Equity at exit
- $27,584
- IRR
- -3.5%
- Equity multiple
- 0.77×
- Total profit
- $-12,132
- Equity at exit
- $15,995
Cash invested: $51,800 (down + closing). Projections, not guarantees.
Landlord ↔ Tenant lean methodology
- Overall (STATE)
- 87 Strongly Landlord-Friendly
- State Texas
- 87 Strongly Landlord-Friendly · R+5
- County
- — inherits STATE
- City
- — inherits STATE
ZIP-level market 75180
- Home prices YoY
- -8.0%
- Active inventory
- 85
- Price-to-rent
- 8.0×
Monthly cashflow live
- Estimated rent
- $1,932 high interval (Pro) →
- Mortgage (P&I)
- −$970
- Tax from tax record
- −$382 /mo · $4,585/yr
- Insurance
- −$77
- HOA
- −$0
- Vacancy / Maint / Mgmt
- −$406
- Net cashflow
- $97
Break-even live
UW: 25.0% down · 7.5% · 30yr · 1.5% tax · 5.0% vac · 8.0% maint · 8.0% mgmt
Financing live
Cash to close
- Down payment
- $46,250
- Closing costs
- $5,550
- Reserves months
- —
- Total cash needed
- —
Loan-product check · same deal, 3 products live
Conventional
25% down · 7.5% · 30yr
- Down + closing
- —
- Monthly P&I
- —
- Monthly cashflow
- —
- DSCR
- —
- Eligible?
- —
Personal DTI + credit; lowest rate.
DSCR
20% down · 8.5% · 30yr
- Down + closing
- —
- Monthly P&I
- —
- Monthly cashflow
- —
- DSCR
- —
- Eligible?
- —
No personal income docs; deal must DSCR.
Hard money
10% down · 12.0% · 12mo
- Down + closing
- —
- Monthly P&I
- —
- Monthly cashflow
- —
- DSCR
- —
- Eligible?
- —
Short-term bridge; refi at stabilization.
Rent comps 19 comps
| Address | Beds | Baths | Sqft | Rent | $/sqft | DOM | Units | Dist |
|---|---|---|---|---|---|---|---|---|
| 15115 Oakwood Ln Unit 1 Mesquite, TX | 3.0 | 1.5 | 1102 | $1,850 | $1.68 | 43d | 1 | 0.15mi |
| 14419 Briarcrest Dr Balch Springs, TX | 3.0 | 2.0 | 1350 | $1,695 | $1.26 | 43d | 1 | 0.27mi |
| 4320 Mohawk Dr Balch Springs, TX | 4.0 | 2.0 | 1110 | $1,900 | $1.71 | 24d | 1 | 0.41mi |
| 14005 Cimarron Dr Balch Springs, TX | 3.0 | 1.0 | 1252 | $1,650 | $1.32 | 24d | 1 | 0.50mi |
| 4605 Navajo Trl Balch Springs, TX | 3.0 | 2.0 | 1152 | $1,795 | $1.56 | 43d | 1 | 0.50mi |
| 4229 Culmer Ln Balch Springs, TX | 3.0 | 1.5 | 1156 | $1,545 | $1.34 | 21d | 1 | 0.71mi |
| 4307 Linda Ln Balch Springs, TX | 4.0 | 1.5 | 1141 | $1,941 | $1.70 | 7d | 1 | 0.77mi |
| 12603 Summer Hill Dr Balch Springs, TX | 3.0 | 2.0 | 1311 | $2,500 | $1.91 | 21d | 1 | 0.87mi |
| 12603 Summer Hill Dr Balch Springs, TX | 3.0 | 2.0 | 1311 | $1,800 | $1.37 | 1d | 1 | 0.87mi |
| 12516 Spring Branch Dr Balch Springs, TX | 3.0 | 1.5 | 1141 | $1,761 | $1.54 | 24d | 1 | 0.89mi |
| 12411 Summer Hill Dr Balch Springs, TX | 3.0 | 2.0 | 1299 | $1,800 | $1.39 | 1d | 1 | 0.96mi |
| 3212 Balch Springs Rd Balch Springs, TX | 1.0–2.0 | 1.0–2.0 | 825 | $1,245 | $1.51 | 7d | 1 | 1.06mi |
| 12416 Fish Rd Dallas, TX | 4.0 | 2.0 | 1427 | $2,011 | $1.41 | 5d | 1 | 1.11mi |
| 2724 Windswept Ln Mesquite, TX | 3.0 | 2.0 | 1402 | $2,300 | $1.64 | 24d | 1 | 1.12mi |
| 12248 Ortega St Dallas, TX | 3.0 | 2.0 | 1346 | $1,970 | $1.46 | 2d | 1 | 1.13mi |
| 3921 Ambassador Way Balch Springs, TX | 4.0 | 1.5 | 1460 | $1,595 | $1.09 | 43d | 1 | 1.17mi |
| 12109 Bishop Dr Balch Springs, TX | 3.0 | 2.0 | 1149 | $1,600 | $1.39 | 7d | 1 | 1.22mi |
| 4400 Ambassador Way Balch Springs, TX | 1.0–2.0 | 1.0–1.5 | 707 | $1,200 | $1.70 | 3d | 4 | 1.36mi |
| 12227 Quail Dr Balch Springs, TX | 1.0–2.0 | 1.0 | 729 | $1,200 | $1.65 | 15d | 1 | 1.37mi |
Listing history 2 events
-
2026-05-05status Pending 539-char remark
Show marketing remark (539 chars)
A well-located property just minutes from downtown Dallas, this 3-bedroom, 2-bath single-story ranch style home is ready for its next owner. This home is priced to reflect updates needed. The property features spacious rooms, solid structure, and a large backyard in a great neighborhood just steps from a local park, community water park, and skate park. While the home is in need of updates, the location and layout make it a perfect project for investors or owner-occupants looking to add value and their own style. Property sold as is.
-
2026-02-25$185,000 Active 539-char remark
Show marketing remark (539 chars)
A well-located property just minutes from downtown Dallas, this 3-bedroom, 2-bath single-story ranch style home is ready for its next owner. This home is priced to reflect updates needed. The property features spacious rooms, solid structure, and a large backyard in a great neighborhood just steps from a local park, community water park, and skate park. While the home is in need of updates, the location and layout make it a perfect project for investors or owner-occupants looking to add value and their own style. Property sold as is.
ⓘ Source: listings_history table (triggers on properties + properties_extension) + one-shot
backfill from property_details.listing_events for pre-trigger history.
Tax reassessment forecast TX · Resets to sale price
- Current annual tax
- $4,585 · $382/mo
- Projected year-2 tax
- $4,585 · $382/mo
- Expected delta
- $0/yr ($0/mo · 0.0%)
ⓘ Screening estimate from a state-policy table — verify with the county assessor before closing.
Climate risk First Street
- Flood 1/10 Low FEMA zone X (unshaded) · 0% chance over 30 yrs
- Wildfire 3/10 Moderate
- Heat 7/10 Severe 7 d/yr ≥110°F today · 24 d/yr by 30 yrs out
- Wind 6/10 Major 27% chance of damaging wind over 30 yrs
- Air quality 2/10 Low 1 unhealthy d/yr today · 1 by 30 yrs out
Nearby sold comps map
Loading sold comps map…
Walkable amenities ~0.75 mi
Loading nearby amenities…
Taxation est. · year 1
- Rental income
- $23,189
- − Mortgage interest
- −$10,363
- − Property taxes
- −$4,585
- − Insurance
- −$925
- − Repairs & maintenance
- −$1,855
- − Management
- −$1,855
- − Depreciation
- −$5,382
- Taxable loss
- −$1,776
- Est. tax savings @ 24.0%
- +$426
- After-tax cash flow
- $1,593/yr
For passive investors: Depreciation is non-cash, so a rental often shows a tax loss while cash-flowing — sheltering income. Rental losses are passive: they offset passive income freely, and up to $25,000/yr can offset ordinary (W-2) income if you actively participate and your MAGI is under $100k (phasing out to $0 by $150k); unused losses carry forward. On sale, claimed depreciation is recaptured at up to 25%, and gains may owe capital-gains tax (a 1031 exchange can defer both). Figures are a year-1 estimate at your 24.0% rate — not tax advice; consult a CPA.
Schools (NCES district)
- District
- Mesquite ISD
- NCES district ID
- 4830390
- Math proficiency
- 35% ▼ -11.00%
- Reading proficiency
- 32% ▼ -7.00%
- Median HH income
- $49,372
- Composite
- 29.06/100
- National rank
- #6606
- State rank
- #536 of 826 in TX
Livability — Balch Springs
- Score
- 68/100
- State rank
- #487
- US rank
- #9673
Category grades
Schools grade is shown separately in the Schools card above.
Census & demographics
- Census place
- Balch Springs, TX
- County
- Dallas County · 2,612,404 people
- City population
- 26,455
- Metro
- Dallas-Fort Worth-Arlington, TX
- Population (ZIP)
- 26,455
- Household income
- $67,019
- Rent vs Own
- Severe rent burden
- 660.0
Population outlook (Dallas County) Hauer SSP2
- Today (2025)
- 2,979,839 people
- By 2030
- 3,191,823 · +7.1%
- By 2040
- 3,619,611 · +21.5%
- By 2050
- 4,026,915 · +35.1%
- By 2075
- 4,957,073 · +66.4%
- By 2100
- 5,508,725 · +84.9%
Race, ethnicity, and origin ACS 2023
- Neighborhood character
- Diverse neighborhood (Simpson 0.61)
- Race & ethnicity
- Hispanic / Latino 51% Black 33% Two or more races 24% White 14% Native American 2%
- Hispanic origin (detail)
- Mexican 46%
- Foreign-born
- 23% · Canada
- Languages at home
- 55% English-only · Spanish 44%
Political lean MEDSL · Dallas
- 2024 margin
- Strong D (+22.2) · D 60.2% · R 38.0% · Other 1.8%
- 2008→2024 swing
- +6.9pp toward D · 2008: 15.3pp · 2024: 22.2pp
- All cycles
- 2024: D+22.2 2020: D+31.6 2016: D+26.2 2012: D+15.4 2008: D+15.3
Not yet ingested
- Civics
- —
Market trends
- HPI YoY
- ▼ -31.21%
- Current HPI
- 361.3668
- Rent YoY
- —
- Metro
- Dallas-Fort Worth-Arlington, TX
- State GDP YoY
- ▲ 3.95%
- F500 in state
- 110
Industry mix (Fortune 500 HQ in TX)
| Industry | F500 HQs | Revenue |
|---|---|---|
| Energy | 16 | $1,198B |
|
||
| Technology | 5 | $198B |
|
||
| Engineering / Construction | 4 | $72B |
|
||
| Energy Services | 3 | $60B |
|
||
| Utilities | 3 | $41B |
|
||
| Healthcare | 2 | $330B |
|
||
Price history
2 events — show timeline
- 2026-05-05 Pending — NTREIS
- 2026-02-25 Listed $185,000 NTREIS
Property tax history
+5.6%/yrLatest (2025): $4,585 · +0.5% YoY. Source: county tax records.
Cash-flow waterfall
monthlySold comps — $/sqft
last 12 mo · ≤1 miLoading sold comps…