1905 W Morton St #19 · Denison, TX
Flood risk 1/10 · Minimal
- FEMA flood zone
- X (unshaded)
- Chance of flooding over 30 yrs
- 0.0%
- Est. flood insurance / yr
- $507 – $1,088
Fire risk 5/10 · Moderate
- Est. fire insurance / yr
- $1,222 – $2,270
Heat risk 6/10 · Moderate
- Hot days now (above 108°F)
- 7 days/yr
- Hot days in 30 yrs
- 21 days/yr
Wind risk 4/10 · Minor
- Chance of severe wind over 30 yrs
- 22.0%
Air-quality risk 3/10 · Minor
- Unhealthy air days now
- 3 days/yr
- Unhealthy air days in 30 yrs
- 3 days/yr
Risk factors via First Street. Map © Google.
Why this score? — see what drove the D grade
The composite is a weighted blend of 9 inputs, each scored 0–100. Each bar is that input's sub-score; the figure is the points it added to the 100-point composite (weight × sub-score).
- Cash flow +13.2/30.0
- ARV discount +8.0/15.0
- 1% rule +4.8/10.0
- DSCR +4.0/10.0
- Schools +3.7/10.0
- Livability +3.7/5.0
- Rent growth +2.5/5.0
- Condition / age +2.5/5.0
- Appreciation +0.0/10.0
$138,500
🖨 Deal sheet 📄 Offer letter ✓ Due diligence
Listing remarks MLS
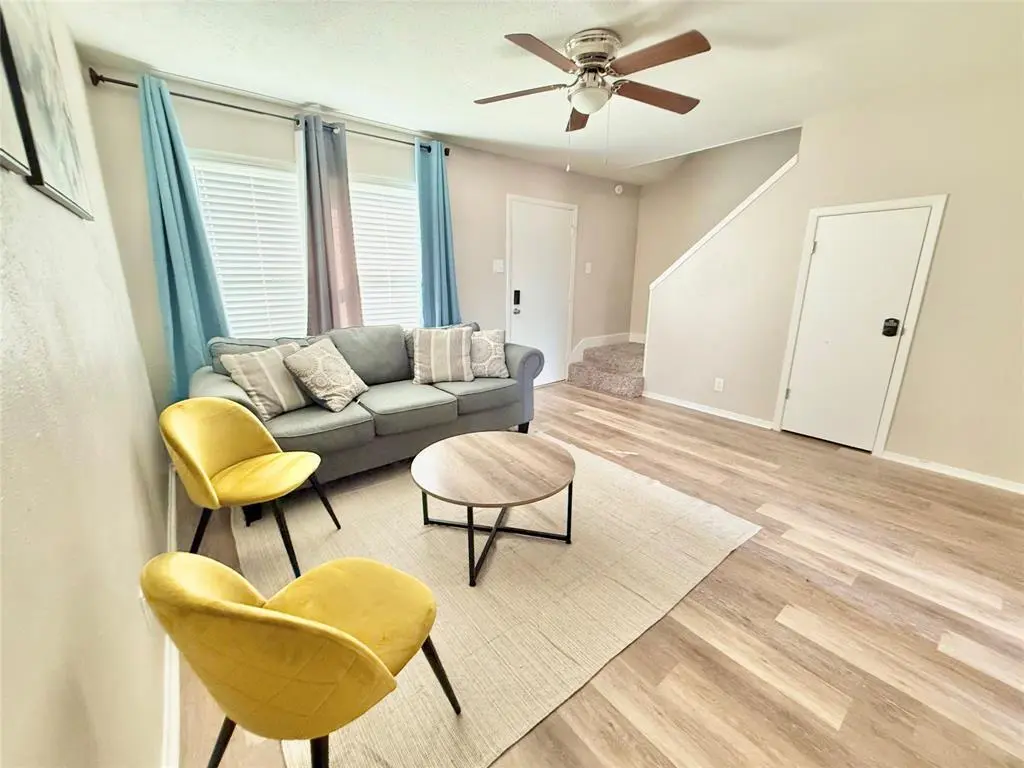
Opportunity to purchase fully remodeled 3 bedroom, 1.5 bath Townhome with private fenced patio including storage shed (one of 4 units available). All electric, central HVAC, 2 assigned parking spaces. Owner Financing.
Key facts
- $50 HOA
- 2 parking spots
- Built 1962
Property features AI
Finance
- Other: County: Grayson; Country: United States; Geocode confidence: High; Latitude/Longitude available
- Financial info: No second mortgage; Loan type: Treat as clear
- HOA & community: Mandatory association (PINES HOA); HOA fee $50 monthly; Association covers grounds maintenance and management fees
Exterior
- Parking: Assigned carport with 2 spaces; No covered garage spaces
- Utilities: City water; City sewer; Not in a municipal utility district
- Home design: Townhouse (residential); Two levels; Property is not attached; Smart home features present
- Construction: Built in 1962
- Exterior features: Lot less than 0.5 acre; Subdivision: Wagner Place Unit 1; Directions: Best to use GPS
Interior
- Kitchen: Dishwasher
- Bedrooms: Primary bedroom on level 2 (9 x 8); Second bedroom on level 2 (9 x 7)
- Bathrooms: One full bathroom; One half bathroom
- Interior features: Pantry; Walk-in closet(s); One living area; One dining area; Three total rooms
- Laundry & utility: Washer; Dryer
Neighborhood map
What this means for you Summary
Snapshot
- This is a 2-bed/1.5-bath townhouse listed at $138k.
Deal economics
- At list price, monthly cash flow is $-2 ($-22/yr) — negative.
- To cash-flow at today's rent, offer at most $138k (0.2% below list).
- To meet the 1% rule (rent ≥ 1% of price), the offer needs to be $135k (2.2% below list).
- Recommended offer: $135k (2.2% below list) — sets the bar for 1% rule.
- Cap rate 6.3% vs local median 3.8% in Denison — top-decile yield for the area; either an underpriced asset or a hidden risk that comps aren't pricing in. Stress-test before assuming the spread holds.
Location & tenants
- Location reads 73/100 on livability (#221 in TX) — a middle-class / working-renter tenant base. Strengths: cost of living A+, housing A+, crime A; Watch: health & safety D+, amenities F, commute F.
- Denison ISD (urban): math 43% / reading 44% proficiency, ranked #315 of 826 in TX (top 38%) — families likely to look elsewhere, expect single-tenant / working-renter base with shorter leases.
- Zoned schools: Mayes El (math 42% / reading 42%, grade F, #1,335 of 4,322 statewide, top 33%, 471 students, 64% FRL).
- Market conditions: Rents flat; 485 active listings in the ZIP; 40 comparable units currently listed for rent nearby; rentals lingering (median 44d on market — plan ~5-8 weeks vacancy on turnover, expect pricing pressure); 58% of comp listings sitting > 30 days — soft ceiling on asking rent; 2,272 units permitted in Grayson County in 2024 (750 in 5+ unit buildings).
Forward outlook
- Local home prices are declining (-3.0%/yr); year-one equity from $958 of loan paydown is wiped out by about $4k of value loss. Plan a longer hold.
- Grayson County population projected at +12% by 2050 — modest demand growth; plan on rents tracking national, not racing it.
Negotiation context
- It's been on market 22 days — a 2% lower offer ($136k) is reasonable based on typical stale-listing flexibility.
- 4 sale attempts since 11y ago with the ask held roughly flat each time — persistent listings suggest the price (not the market) is what's stuck; bring a comps-based counter.
Risks & watch-outs
- Climate carrying-cost: moderate wildfire risk; extreme-heat days projected 7→21/yr by 2055 (HVAC capex compounding) — expect insurance premiums to compound above CPI over the hold.
Questions for the listing agent
- What do current leases actually rent for vs. the listed asking? Can we see a recent rent roll and the last 12 months of T-12 income?
- Built in 1962 — when were the roof, HVAC, electrical panel, plumbing, and water heater last replaced?
- What does the HOA fee cover, when was the last increase, and are there any pending special assessments or reserve-fund shortfalls?
- Is there a deadline driving the sale (1031 exchange, divorce, estate, relocation)? That informs how much negotiation room exists.
- Schools are D-rated, which usually means shorter tenancies and higher turnover. Who's the typical renter profile here, and what's been the actual vacancy rate?
- The area grade is low — what's the realistic commute time and amenity access for the typical tenant pool here? Any planned neighborhood developments (good or bad) we should know about?
- What's the average days-on-market for RENTAL listings here right now (not sales)? A rising rental-DOM trend means longer vacancies and softer asking-rent achievability than the comps imply.
- What's the recent tenant-quality profile in this submarket — average credit score on applications, eviction rate, late-payment / NSF rate, and stable-employment percentage? A property-management company in the area should have these aggregated.
- How much new for-sale + rental construction is in the pipeline within 1–3 miles? Heavy new supply typically softens prices + rents 12–24 months out; constrained supply supports both.
Investment metrics
- 1% rule
- 0.98% ✗
- Cap rate
- 6.28%
- Cash-on-cash
- -0.06%
- DSCR
- 1.00
- GRM
- 8.5
CMA / ARV
- ARV (on-the-fly)
- $140,112
- Comps found
- 4
Show comp detail 4 sales within ~0.75 mi
| Address | Dist | Beds/Ba | Sqft | Sold | Price | $/sf | Match |
|---|---|---|---|---|---|---|---|
| 1905 W Morton St #17 | 0.01mi | 2/1.5 | 1,008 (0%) | 6mo | $70,000 | $69 | 95 |
| 1905 W Morton St #6 | 0.02mi | 3/1.5 (+1) | 1,080 (+7%) | 2mo | $135,000 | $125 | 80 |
| 1905 W Morton St #7 | 0.02mi | 3/1.5 (+1) | 1,080 (+7%) | 4mo | $149,900 | $139 | 79 |
| 1905 W Morton St #14 | 0.04mi | 2/1.5 | 972 (-4%) | 23mo | $142,000 | $146 | 73 |
Match score weights: distance 35% · size 25% · config 20% · recency 20%. Top-matched comps best support the ARV.
Projected returns pro-forma
-3.0% appreciation · 0.05% rent growth · sell at horizon
- IRR
- -20.1%
- Equity multiple
- 0.32×
- Total profit
- $-26,376
- Equity at exit
- $20,651
- IRR
- -22.6%
- Equity multiple
- 0.02×
- Total profit
- $-37,858
- Equity at exit
- $11,975
Cash invested: $38,780 (down + closing). Projections, not guarantees.
Landlord ↔ Tenant lean methodology
- Overall (STATE)
- 87 Strongly Landlord-Friendly
- State Texas
- 87 Strongly Landlord-Friendly · R+5
- County
- — inherits STATE
- City
- — inherits STATE
ZIP-level market 75020
- Rents YoY
- 0.1%
- Active inventory
- 485
- Price-to-rent
- 8.5×
Monthly cashflow live
- Estimated rent
- $1,355 high interval (Pro) →
- Mortgage (P&I)
- −$726
- Tax from tax record
- −$238 /mo · $2,855/yr
- Insurance
- −$58
- HOA
- −$50
- Vacancy / Maint / Mgmt
- −$284
- Net cashflow
- $-2
Break-even live
UW: 25.0% down · 7.5% · 30yr · 1.5% tax · 5.0% vac · 8.0% maint · 8.0% mgmt
Financing live
Cash to close
- Down payment
- $34,625
- Closing costs
- $4,155
- Reserves months
- —
- Total cash needed
- —
Loan-product check · same deal, 3 products live
Conventional
25% down · 7.5% · 30yr
- Down + closing
- —
- Monthly P&I
- —
- Monthly cashflow
- —
- DSCR
- —
- Eligible?
- —
Personal DTI + credit; lowest rate.
DSCR
20% down · 8.5% · 30yr
- Down + closing
- —
- Monthly P&I
- —
- Monthly cashflow
- —
- DSCR
- —
- Eligible?
- —
No personal income docs; deal must DSCR.
Hard money
10% down · 12.0% · 12mo
- Down + closing
- —
- Monthly P&I
- —
- Monthly cashflow
- —
- DSCR
- —
- Eligible?
- —
Short-term bridge; refi at stabilization.
Rent comps 40 comps
| Address | Beds | Baths | Sqft | Rent | $/sqft | DOM | Units | Dist |
|---|---|---|---|---|---|---|---|---|
| 1905 W Morton St #20 Denison, TX | 2.0 | 1.5 | 1008 | $1,250 | $1.24 | 43d | 1 | 0.02mi |
| 1721 W Walker St Denison, TX | 2.0 | 1.0 | 1322 | $1,400 | $1.06 | 43d | 1 | 0.23mi |
| 1731 W Elm St Denison, TX | 3.0 | 2.0 | 1200 | $1,550 | $1.29 | 21d | 1 | 0.30mi |
| 1731 W Elm St Denison, TX | 3.0 | 2.0 | 1200 | $1,575 | $1.31 | 43d | 1 | 0.30mi |
| 1701 W Elm St Denison, TX | 2.0 | 1.0 | 800 | $900 | $1.12 | 21d | 1 | 0.35mi |
| 1703 W Elm St Denison, TX | 2.0 | 1.0 | 800 | $875 | $1.09 | 21d | 1 | 0.36mi |
| 1602 W Elm St Denison, TX | 3.0 | 2.0 | 1141 | $1,495 | $1.31 | 43d | 1 | 0.39mi |
| 102 Lum Ln Unit 101 Denison, TX | 3.0 | 2.0 | 1158 | $1,600 | $1.38 | 43d | 1 | 0.52mi |
| 1326 W Sears St Denison, TX | 2.0 | 1.0 | 1318 | $1,350 | $1.02 | 21d | 1 | 0.54mi |
| 1829 Ridgewood Rd Denison, TX | 3.0 | 1.0 | 1040 | $1,100 | $1.06 | 43d | 1 | 0.65mi |
| 108 N Eddy Ave Denison, TX | 1.0 | 1.0 | 882 | $1,100 | $1.25 | 43d | 1 | 0.68mi |
| 1231 W Main St Denison, TX | 2.0 | 1.5 | 1203 | $1,575 | $1.31 | 21d | 1 | 0.68mi |
| 1035-1033 Ray Dr Denison, TX | 3.0 | 3.0 | 1328 | $1,450 | $1.09 | 43d | 1 | 0.69mi |
| 1016 W Gandy St #4 Denison, TX | 2.0 | 1.5 | 1000 | $1,100 | $1.10 | 43d | 1 | 0.84mi |
| 1131 W Owing St Denison, TX | 3.0 | 2.0 | 1135 | $1,695 | $1.49 | 43d | 1 | 0.86mi |
| 1004 W Gandy St Denison, TX | 3.0 | 1.0 | 1250 | $1,299 | $1.04 | 21d | 1 | 0.86mi |
| 731 Layne Dr Denison, TX | 3.0 | 2.0 | 1215 | $1,600 | $1.32 | 44d | 1 | 0.90mi |
| 1120 W Owing St Denison, TX | 3.0 | 2.0 | 1090 | $1,225 | $1.12 | 21d | 1 | 0.90mi |
| 1311 W Day St Denison, TX | 2.0 | 1.0 | 1188 | $1,050 | $0.88 | 21d | 1 | 0.97mi |
| 3050 Viking St Denison, TX | 1.0–2.0 | 1.0–2.0 | 887 | $1,450 | $1.63 | 21d | 11 | 1.00mi |
| 2824 W Crawford St Denison, TX | 1.0–2.0 | 1.0 | 825 | $999 | $1.21 | 21d | 2 | 1.03mi |
| 731 W Morton St Denison, TX | 3.0 | 2.0 | 1298 | $1,500 | $1.16 | 43d | 1 | 1.05mi |
| 731 W Bond St Denison, TX | 3.0 | 2.0 | 1297 | $1,595 | $1.23 | 21d | 1 | 1.05mi |
| 727 W Johnson St Unit A Denison, TX | 3.0 | 2.5 | 1238 | $1,450 | $1.17 | 43d | 1 | 1.07mi |
| 820 W Crawford St Denison, TX | 2.0 | 1.0 | 996 | $1,250 | $1.26 | 21d | 1 | 1.09mi |
| 1022 W Shepherd St #1022 Denison, TX | 3.0 | 2.5 | 1322 | $1,450 | $1.10 | 21d | 1 | 1.10mi |
| 817 W Owing St Denison, TX | 1.0 | 1.0 | 700 | $800 | $1.14 | 21d | 1 | 1.12mi |
| 715 W Chestnut St Denison, TX | 2.0 | 2.0 | 1273 | $1,300 | $1.02 | 43d | 1 | 1.15mi |
| 617 W Gandy St Unit 3 Denison, TX | 2.0 | 2.0 | 750 | $1,200 | $1.60 | 43d | 1 | 1.18mi |
| 921 W Day St Denison, TX | 3.0 | 2.0 | 1212 | $1,500 | $1.24 | 43d | 1 | 1.20mi |
| 1011 S Perry Ave Denison, TX | 2.0 | 2.0 | 1079 | $1,350 | $1.25 | 43d | 1 | 1.21mi |
| 613 W Elm St Unit 613 Denison, TX | 3.0 | 2.0 | 1375 | $1,525 | $1.11 | 44d | 1 | 1.21mi |
| 626 W Chestnut St Denison, TX | 2.0 | 1.0 | 1132 | $1,300 | $1.15 | 21d | 1 | 1.22mi |
| 527 W Walker St Denison, TX | 3.0 | 2.0 | 1300 | $1,675 | $1.29 | 43d | 1 | 1.24mi |
| 1207 Bruce Dr Denison, TX | 3.0 | 2.0 | 1298 | $1,540 | $1.19 | 43d | 1 | 1.24mi |
| 626 W Crawford St Unit 101 Denison, TX | 2.0 | 2.0 | 950 | $950 | $1.00 | 21d | 1 | 1.25mi |
| 1238 Carla St Denison, TX | 3.0 | 1.5 | 1172 | $1,350 | $1.15 | 43d | 1 | 1.26mi |
| 610 W Owing St Denison, TX | 3.0 | 2.0 | 1108 | $1,395 | $1.26 | 43d | 1 | 1.30mi |
| 410 S Mirick Ave Denison, TX | 3.0 | 2.0 | 1100 | $1,300 | $1.18 | 43d | 1 | 1.36mi |
| 411 S Fannin Ave #411 Denison, TX | 3.0 | 2.5 | 1322 | $1,450 | $1.10 | 21d | 1 | 1.41mi |
HOA detail
- Monthly dues
- $50 · $600/yr
- Likely covers
- electricparking
Listing history 28 events
-
2026-06-19days on market $138,500 Active 22 DOM
-
2026-06-18days on market $138,500 Active 21 DOM
-
2026-06-17days on market $138,500 Active 20 DOM
-
2026-06-16days on market $138,500 Active 19 DOM
-
2026-06-15days on market $138,500 Active 18 DOM
-
2026-06-14days on market $138,500 Active 16 DOM
-
2026-06-13days on market $138,500 Active 15 DOM
-
2026-06-10days on market $138,500 Active 13 DOM
-
2026-06-09days on market $138,500 Active 12 DOM
-
2026-06-08days on market $138,500 Active 11 DOM
-
2026-06-07days on market $138,500 Active 10 DOM
-
2026-06-05days on market $138,500 Active 7 DOM
-
2026-06-03days on market $138,500 Active 6 DOM
-
2026-06-02days on market $138,500 Active 5 DOM
-
2026-06-01days on market $138,500 Active 4 DOM
-
2026-05-31days on market $138,500 Active 3 DOM
-
2026-05-30days on market $138,500 Active 2 DOM
-
2026-05-26$138,500 Active
-
2026-01-31historical
-
2026-01-08$135,000 Active
-
2023-03-14soldstatus
-
2022-07-05soldstatus
-
2022-07-01soldstatus Closed 217-char remark
Show marketing remark (217 chars)
Opportunity to purchase fully remodeled 3 bedroom, 1.5 bath Townhome with private fenced patio including storage shed (one of 4 units available). All electric, central HVAC, 2 assigned parking spaces. Owner Financing.
-
2022-05-23status Pending 217-char remark
Show marketing remark (217 chars)
Opportunity to purchase fully remodeled 3 bedroom, 1.5 bath Townhome with private fenced patio including storage shed (one of 4 units available). All electric, central HVAC, 2 assigned parking spaces. Owner Financing.
-
2022-05-23$134,750 Active 217-char remark
Show marketing remark (217 chars)
Opportunity to purchase fully remodeled 3 bedroom, 1.5 bath Townhome with private fenced patio including storage shed (one of 4 units available). All electric, central HVAC, 2 assigned parking spaces. Owner Financing.
-
2015-05-01soldstatus Sold
-
2015-02-20status Pending
-
2015-01-10$40,000 Active
ⓘ Source: listings_history table (triggers on properties + properties_extension) + one-shot
backfill from property_details.listing_events for pre-trigger history.
Tax reassessment forecast TX · Resets to sale price
- Current annual tax
- $2,855 · $238/mo
- Projected year-2 tax
- $2,855 · $238/mo
- Expected delta
- $0/yr ($0/mo · 0.0%)
ⓘ Screening estimate from a state-policy table — verify with the county assessor before closing.
Climate risk First Street
- Flood 1/10 Low FEMA zone X (unshaded) · 0% chance over 30 yrs
- Wildfire 5/10 Major
- Heat 6/10 Major 7 d/yr ≥108°F today · 21 d/yr by 30 yrs out
- Wind 4/10 Moderate 22% chance of damaging wind over 30 yrs
- Air quality 3/10 Moderate 3 unhealthy d/yr today · 3 by 30 yrs out
Nearby sold comps map
Loading sold comps map…
Walkable amenities ~0.75 mi
Loading nearby amenities…
Taxation est. · year 1
- Rental income
- $16,254
- − Mortgage interest
- −$7,758
- − Property taxes
- −$2,855
- − Insurance
- −$692
- − Repairs & maintenance
- −$1,300
- − Management
- −$1,300
- − HOA
- −$600
- − Depreciation
- −$4,029
- Taxable loss
- −$2,281
- Est. tax savings @ 24.0%
- +$547
- After-tax cash flow
- $525/yr
For passive investors: Depreciation is non-cash, so a rental often shows a tax loss while cash-flowing — sheltering income. Rental losses are passive: they offset passive income freely, and up to $25,000/yr can offset ordinary (W-2) income if you actively participate and your MAGI is under $100k (phasing out to $0 by $150k); unused losses carry forward. On sale, claimed depreciation is recaptured at up to 25%, and gains may owe capital-gains tax (a 1031 exchange can defer both). Figures are a year-1 estimate at your 24.0% rate — not tax advice; consult a CPA.
Schools (NCES district)
- District
- Denison ISD
- NCES district ID
- 4816710
- Math proficiency
- 43% ▼ -7.00%
- Reading proficiency
- 44% ▼ -3.00%
- Median HH income
- $41,650
- Composite
- 36.6/100
- National rank
- #4629
- State rank
- #315 of 826 in TX
Livability — Denison
- Score
- 73/100
- State rank
- #221
- US rank
- #5428
Category grades
Schools grade is shown separately in the Schools card above.
Census & demographics
- Census place
- Denison, TX
- County
- Grayson County · 108,053 people
- City population
- 34,008
- Metro
- Sherman-Denison, TX
- Population (ZIP)
- 24,835
- Household income
- $71,605
- Rent vs Own
- Severe rent burden
- 997.0
Population outlook (Grayson County) Hauer SSP2
- Today (2025)
- 134,540 people
- By 2030
- 138,653 · +3.1%
- By 2040
- 145,958 · +8.5%
- By 2050
- 151,218 · +12.4%
- By 2075
- 161,802 · +20.3%
- By 2100
- 159,036 · +18.2%
Race, ethnicity, and origin ACS 2023
- Neighborhood character
- Predominantly White (73%)
- Race & ethnicity
- White 73% Hispanic / Latino 13% Two or more races 9% Black 6%
- Hispanic origin (detail)
- Mexican 11%
- Common ancestry
- Slovak 5% Serbian 2% Portuguese 2%
- Foreign-born
- 4% · Canada
- Languages at home
- 93% English-only · Spanish 6%
Political lean MEDSL · Grayson
- 2024 margin
- Solid R (+54.3) · D 22.5% · R 76.7%
- 2008→2024 swing
- -16.4pp toward R · 2008: -37.9pp · 2024: -54.3pp
- All cycles
- 2024: R+54.3 2020: R+49.9 2016: R+53.1 2012: R+48.0 2008: R+37.9
Not yet ingested
- Civics
- —
Market trends
- HPI YoY
- ▼ -295.96%
- Current HPI
- 257.1806
- Rent YoY
- ▬ 0.05%
- Metro
- Sherman-Denison, TX
- State GDP YoY
- ▲ 3.95%
- F500 in state
- 110
Industry mix (Fortune 500 HQ in TX)
| Industry | F500 HQs | Revenue |
|---|---|---|
| Energy | 16 | $1,198B |
|
||
| Technology | 5 | $198B |
|
||
| Engineering / Construction | 4 | $72B |
|
||
| Energy Services | 3 | $60B |
|
||
| Utilities | 3 | $41B |
|
||
| Healthcare | 2 | $330B |
|
||
Price history
+246.2% since first listed11 events — show timeline
- 2026-05-26 Listed $138,500 NTREIS
- 2026-01-31 Listing Removed — NTREIS
- 2026-01-08 Listed $135,000 NTREIS
- 2023-03-14 Sold (Public Records) — Public Records
- 2022-07-05 Sold (Public Records) — Public Records
- 2022-07-01 Sold (MLS) — NTREIS
- 2022-05-23 Pending — NTREIS
- 2022-05-23 Listed $134,750 NTREIS
- 2015-05-01 Sold (MLS) — NTREIS
- 2015-02-20 Pending — NTREIS
- 2015-01-10 Listed $40,000 NTREIS
Property tax history
+9.7%/yrLatest (2025): $2,855 · +9.8% YoY. Source: county tax records.
Cash-flow waterfall
monthlySold comps — $/sqft
last 12 mo · ≤1 miLoading sold comps…