50 Graley Rd · Racine, WV
Flood risk 1/10 · Minimal
- FEMA flood zone
- X (unshaded)
- Chance of flooding over 30 yrs
- 0.0%
- Est. flood insurance / yr
- $507 – $1,088
Fire risk 5/10 · Moderate
- Est. fire insurance / yr
- $787 – $1,461
Heat risk 5/10 · Moderate
- Hot days now (above 99°F)
- 8 days/yr
- Hot days in 30 yrs
- 21 days/yr
Wind risk 1/10 · Minimal
- Chance of severe wind over 30 yrs
- 1.0%
Air-quality risk 1/10 · Minimal
- Unhealthy air days now
- 0 days/yr
- Unhealthy air days in 30 yrs
- 0 days/yr
Risk factors via First Street. Map © Google.
Why this score? — see what drove the D+ grade
The composite is a weighted blend of 9 inputs, each scored 0–100. Each bar is that input's sub-score; the figure is the points it added to the 100-point composite (weight × sub-score).
- Cash flow +15.0/30.0
- ARV discount +7.5/15.0
- Appreciation +6.2/10.0
- 1% rule +5.0/10.0
- DSCR +5.0/10.0
- Livability +3.2/5.0
- Schools +2.6/10.0
- Rent growth +2.5/5.0
- Condition / age +2.5/5.0
$5,900
🖨 Deal sheet 📄 Offer letter ✓ Due diligence
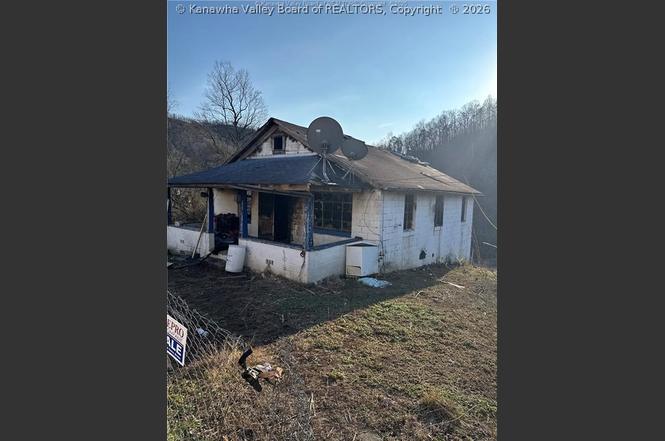
Listing remarks
This . 56 acre lot would be ideal for someone looking to build a home, garage, or place a mobile home. The house is not livable and likely has no useful purpose.
Key facts
- 0.56 acre lot
- Built 1950
- Listed 4 days
Property features AI
Finance
- Financial info: Annual tax information available
Exterior
- Utilities: Public water; Public sewer
- Home design: Single-family residential property
- Construction: Block and plaster construction
- Exterior features: Composition shingle roof
Interior
- Bedrooms: 5 total rooms
- Flooring: Hardwood
- Bathrooms: 1 full bathroom
- Heating & cooling: Has heating; Has cooling; Other heating type; Other cooling type
- Interior features: Hardwood flooring; Full basement
Neighborhood map
What this means for you Summary
Snapshot
- This is a 3-bed/1.0-bath single-family listed at $6k.
Deal economics
- At list price, monthly cash flow is $667 ($8k/yr) — positive.
- The deal already cash-flows at list — no discount required.
- Meets the 1% rule at list price ($895 rent vs $6k).
Location & tenants
- Location reads 64/100 on livability (#150 in WV) — a middle-class / working-renter tenant base. Strengths: cost of living A+, housing A+, crime B+; Watch: employment C-, amenities F, commute F.
- Boone County Schools (rural): math 26% / reading 36% proficiency, ranked #26 of 55 in WV (top 47%) — families likely to look elsewhere, expect single-tenant / working-renter base with shorter leases.
- Zoned schools: Sherman Elementary School (math 67% / reading 62%, grade B, #8 of 377 statewide, top 2%, 250 students, 0% FRL); Sherman Junior High School (math 24% / reading 41%, grade F, #43 of 109 statewide, top 41%, 251 students, 0% FRL); Sherman High School (math 17% / reading 32%, grade F, #91 of 110 statewide, top 85%, 339 students, 0% FRL) — zoned schools average 0% FRL vs 43% district-wide (43 pts lower); this property's tenant base skews higher-income than the district average.
- Market conditions: 2 active listings in the ZIP; 4 units permitted in Boone County in 2024 (0 in 5+ unit buildings).
Forward outlook
- In year one you build about $185 of equity ($41 loan paydown + $144 appreciation (2.4% local appreciation)).
- Boone County population projected at -34% by 2050 — secular population decline; favor cash flow + early exit over multi-decade hold.
- At projected returns (2.4% appreciation + 3.0% rent growth), your $2k cash investment doubles in ~1 year — after that, you're playing with house money.
Negotiation context
- Only 4 days on market — expect competitive offers; lowballing is unlikely to land.
- 3 sale attempts with the ask held roughly flat each time — persistent listings suggest the price (not the market) is what's stuck; bring a comps-based counter.
Risks & watch-outs
- Watch-outs: built in 1950 — expect roof / HVAC / electrical / plumbing capex.
- Climate carrying-cost: moderate wildfire risk; extreme-heat days projected 8→21/yr by 2055 (HVAC capex compounding) — expect insurance premiums to compound above CPI over the hold.
Questions for the listing agent
- Built in 1950 — when were the roof, HVAC, electrical panel, plumbing, and water heater last replaced?
- Is there a deadline driving the sale (1031 exchange, divorce, estate, relocation)? That informs how much negotiation room exists.
- Schools are F-rated, which usually means shorter tenancies and higher turnover. Who's the typical renter profile here, and what's been the actual vacancy rate?
- The area grade is low — what's the realistic commute time and amenity access for the typical tenant pool here? Any planned neighborhood developments (good or bad) we should know about?
- What's the average days-on-market for RENTAL listings here right now (not sales)? A rising rental-DOM trend means longer vacancies and softer asking-rent achievability than the comps imply.
- What's the recent tenant-quality profile in this submarket — average credit score on applications, eviction rate, late-payment / NSF rate, and stable-employment percentage? A property-management company in the area should have these aggregated.
- How much new for-sale + rental construction is in the pipeline within 1–3 miles? Heavy new supply typically softens prices + rents 12–24 months out; constrained supply supports both.
Investment metrics
- 1% rule
- 15.18% ✓
- Cap rate
- 141.88%
- Cash-on-cash
- 484.25%
- DSCR
- 22.55
- GRM
- 0.5
CMA / ARV
No comps found within radius.
Projected returns pro-forma
2.44% appreciation · 3.0% rent growth · sell at horizon
- IRR
- —
- Equity multiple
- 27.04×
- Total profit
- $43,012
- Equity at exit
- $2,470
- IRR
- —
- Equity multiple
- 57.81×
- Total profit
- $93,851
- Equity at exit
- $3,671
Cash invested: $1,652 (down + closing). Projections, not guarantees.
Landlord ↔ Tenant lean methodology
- Overall (STATE)
- 83 Strongly Landlord-Friendly
- State West Virginia
- 83 Strongly Landlord-Friendly · R+22
- County
- — inherits STATE
- City
- — inherits STATE
ZIP-level market 25165
- Home prices YoY
- 2.0%
- Active inventory
- 2
- Price-to-rent
- 0.5×
Monthly cashflow live
- Estimated rent
- $895 medium interval (Pro) →
- Mortgage (P&I)
- −$31
- Tax est. 1.5%
- −$7 /mo · $88/yr
- Insurance
- −$2
- HOA
- −$0
- Vacancy / Maint / Mgmt
- −$188
- Net cashflow
- $667
Break-even live
UW: 25.0% down · 7.5% · 30yr · 1.5% tax · 5.0% vac · 8.0% maint · 8.0% mgmt
Financing live
Cash to close
- Down payment
- $1,475
- Closing costs
- $177
- Reserves months
- —
- Total cash needed
- —
Loan-product check · same deal, 3 products live
Conventional
25% down · 7.5% · 30yr
- Down + closing
- —
- Monthly P&I
- —
- Monthly cashflow
- —
- DSCR
- —
- Eligible?
- —
Personal DTI + credit; lowest rate.
DSCR
20% down · 8.5% · 30yr
- Down + closing
- —
- Monthly P&I
- —
- Monthly cashflow
- —
- DSCR
- —
- Eligible?
- —
No personal income docs; deal must DSCR.
Hard money
10% down · 12.0% · 12mo
- Down + closing
- —
- Monthly P&I
- —
- Monthly cashflow
- —
- DSCR
- —
- Eligible?
- —
Short-term bridge; refi at stabilization.
Listing history 5 events
-
2026-06-18days on market $5,900 Active 4 DOM
-
2026-06-17days on market $5,900 Active 3 DOM
-
2026-06-16days on market $5,900 Active 2 DOM
-
2026-06-15remarks 161-char remark
-
2026-06-15$5,900 Active 1 DOM
ⓘ Source: listings_history table (triggers on properties + properties_extension) + one-shot
backfill from property_details.listing_events for pre-trigger history.
Climate risk First Street
- Flood 1/10 Low FEMA zone X (unshaded) · 0% chance over 30 yrs
- Wildfire 5/10 Major
- Heat 5/10 Major 8 d/yr ≥99°F today · 21 d/yr by 30 yrs out
- Wind 1/10 Low 100% chance of damaging wind over 30 yrs
- Air quality 1/10 Low 0 unhealthy d/yr today · 0 by 30 yrs out
Nearby sold comps map
Loading sold comps map…
Walkable amenities ~0.75 mi
Loading nearby amenities…
Taxation est. · year 1
- Rental income
- $10,746
- − Mortgage interest
- −$330
- − Property taxes
- −$88
- − Insurance
- −$30
- − Repairs & maintenance
- −$860
- − Management
- −$860
- − Depreciation
- −$172
- Taxable income
- $8,406
- Est. tax owed @ 24.0%
- −$2,017
- After-tax cash flow
- $5,982/yr
For passive investors: Depreciation is non-cash, so a rental often shows a tax loss while cash-flowing — sheltering income. Rental losses are passive: they offset passive income freely, and up to $25,000/yr can offset ordinary (W-2) income if you actively participate and your MAGI is under $100k (phasing out to $0 by $150k); unused losses carry forward. On sale, claimed depreciation is recaptured at up to 25%, and gains may owe capital-gains tax (a 1031 exchange can defer both). Figures are a year-1 estimate at your 24.0% rate — not tax advice; consult a CPA.
Schools (NCES district)
- District
- Boone County Schools
- NCES district ID
- 5400090
- Math proficiency
- 26% ▼ -10.00%
- Reading proficiency
- 36% ▼ -7.00%
- Median HH income
- $39,554
- Composite
- 26.0/100
- National rank
- #7318
- State rank
- #26 of 55 in WV
Livability — Racine
- Score
- 64/100
- State rank
- #150
- US rank
- #14647
Category grades
Schools grade is shown separately in the Schools card above.
Census & demographics
- Census place
- Racine, WV
- Population (ZIP)
- 775
Population outlook (Boone County) Hauer SSP2
- Today (2025)
- 20,544 people
- By 2030
- 19,019 · -7.4%
- By 2040
- 16,026 · -22.0%
- By 2050
- 13,482 · -34.4%
- By 2075
- 8,854 · -56.9%
- By 2100
- 6,046 · -70.6%
Race, ethnicity, and origin ACS 2023
- Neighborhood character
- Predominantly White (95%)
- Race & ethnicity
- White 95% Two or more races 5%
- Common ancestry
- Serbian 8% Iranian 1%
Political lean MEDSL · Boone
- 2024 margin
- Solid R (+57.4) · D 20.1% · R 77.5% · Other 2.3%
- 2008→2024 swing
- -68.1pp toward R · 2008: 10.7pp · 2024: -57.4pp
- All cycles
- 2024: R+57.4 2020: R+53.0 2016: R+54.3 2012: R+31.3 2008: D+10.7
Not yet ingested
- Civics
- —
Market trends
- HPI YoY
- ▲ 2.44%
- Current HPI
- 122.8379
- Rent YoY
- —
- Metro
- —
- State GDP YoY
- —
- F500 in state
- 0
Price history
-41.0% since first listed5 events — show timeline
- 2026-06-14 Listed $5,900 KVBOR
- 2026-04-22 Price Changed $6,497 KVBOR
- 2025-11-20 Price Changed $7,997 KVBOR
- 2025-11-03 Listed $9,997 KVBOR
- 2025-03-13 Listed $9,997 KVBOR
Property tax history
+5.8%/yrLatest (2025): $503 · +110.2% YoY. Source: county tax records.
Cash-flow waterfall
monthlySold comps — $/sqft
last 12 mo · ≤1 miLoading sold comps…