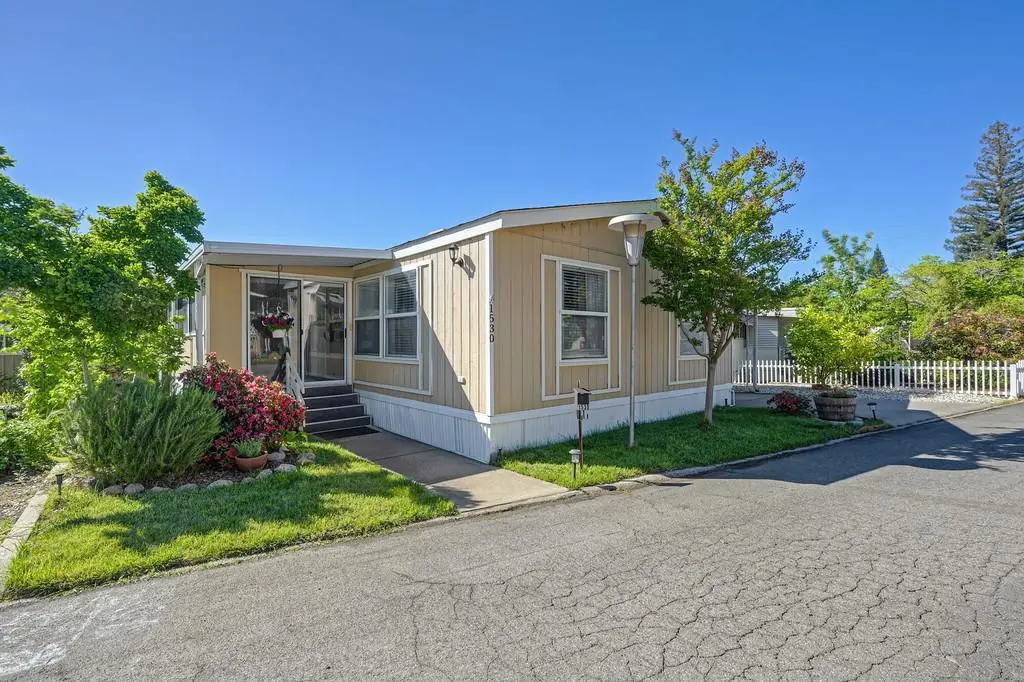
1530 Amy Dr · Newcastle, CA
Flood risk 7/10 · Major
- FEMA flood zone
- X (unshaded)
- Chance of flooding over 30 yrs
- 0.99%
- Est. flood insurance / yr
- $507 – $1,088
Fire risk 10/10 · Severe
- Est. fire insurance / yr
- $659 – $1,223
Heat risk 6/10 · Moderate
- Hot days now (above 100°F)
- 6 days/yr
- Hot days in 30 yrs
- 14 days/yr
Wind risk 1/10 · Minimal
- Chance of severe wind over 30 yrs
- —
Air-quality risk 10/10 · Severe
- Unhealthy air days now
- 34 days/yr
- Unhealthy air days in 30 yrs
- 41 days/yr
Risk factors via First Street. Map © Google.
Why this score? — see what drove the B- grade
The composite is a weighted blend of 9 inputs, each scored 0–100. Each bar is that input's sub-score; the figure is the points it added to the 100-point composite (weight × sub-score).
- Cash flow +30.0/30.0
- 1% rule +10.0/10.0
- DSCR +10.0/10.0
- ARV discount +7.0/15.0
- Schools +4.9/10.0
- Livability +2.8/5.0
- Rent growth +2.5/5.0
- Condition / age +2.5/5.0
- Appreciation +0.0/10.0
$174,000
🖨 Deal sheet 📄 Offer letter ✓ Due diligence
Listing remarks
Welcome to Castle City Mobile Home Park, where you can experience peaceful country living in a vibrant 55+ rent-controlled community. This 1997 double-wide manufactured home is 1,344 sq. feet and features 2 bedrooms, a den & 2 full baths. There is a formal living room, a dining area off of the kitchen, and a breakfast nook. The refrigerator is included, along with the washer and dryer in the laundry room. The primary bedroom features a walk-in closet & a large bathroom with a stall shower. The guest bath has a shower over the tub. Enclosed 8 x 20 front deck, with a small patio and grassy area on the side of the home behind the deck. New space rent will be $842.39, which includes
Key facts
- Breakfast nook
- Walk-in closet
- Formal living room
Tags
Property features AI
Finance
- Other: Lot is not land-leased (land lease listed separately); Land lease amount provided separately
- HOA & community: No homeowners association; Senior community
Exterior
- Parking: Attached covered parking; Guest parking available; No enclosed garage (carport/attached cover)
- Utilities: Individual electric meter; Individual gas meter; Internet available; Public sewer; Private water
- Home design: Manufactured in-park home; Double wide; Karsten Villa (Karsten Co); Built in 1997
- Construction: Composition roof; Vinyl skirting
- Exterior features: Carport awning; Shed(s); Auto sprinkler front and rear; Front yard; Landscaped front and back; Close to clubhouse
Interior
- Kitchen: Free standing gas range; Free standing refrigerator; Hood over range; Dishwasher; Disposal; Pantry cabinet; Breakfast area; Laminate counter; Plumbed for ice maker
- Bedrooms: 2 bedrooms (possible 3rd bedroom)
- Flooring: Carpet; Laminate; Vinyl
- Bathrooms: 2 full bathrooms; Tub with shower over; Shower stall(s)
- Heating & cooling: Central heating (natural gas); Ceiling fan(s); Evaporative cooler
- Interior features: Cathedral ceiling; Dual-pane full windows; Enclosed deck; Uncovered patio; Den, dining room, sun room, living room, master bedroom, kitchen, laundry
- Laundry & utility: Washer and dryer included; Laundry inside; Electric and gas hook-up for laundry
Neighborhood map
What this means for you Summary
Snapshot
- This is a 2-bed/2.0-bath manufactured listed at $174k.
Deal economics
- At list price, monthly cash flow is $808 ($10k/yr) — positive.
- The deal already cash-flows at list — no discount required.
- Meets the 1% rule at list price ($3k rent vs $174k).
- Recommended offer: $164k (6.0% below list) — sets the bar for market timing.
- Cap rate 12.3% vs local median 1.6% in Newcastle — top-decile yield for the area; either an underpriced asset or a hidden risk that comps aren't pricing in. Stress-test before assuming the spread holds.
Location & tenants
- Location reads 56/100 on livability (#792 in CA) — a working-class tenant base; expect higher turnover. Strengths: crime A+, employment A+, housing A+; Watch: amenities F, commute F, cost of living F.
- Placer Union High (suburban): math 39% / reading 72% proficiency, ranked #98 of 517 in CA (top 19%) — acceptable for families but not a draw, mixed tenant base, ~2y average lease.
- Market conditions: 54 active listings in the ZIP; 3,535 units permitted in Placer County in 2024 (689 in 5+ unit buildings).
Forward outlook
- Local home prices are declining (-3.0%/yr); year-one equity from $1k of loan paydown is wiped out by about $5k of value loss. Plan a longer hold.
- Placer County population projected at +20% by 2050 — long-run rental-demand tailwind backs the buy-and-hold thesis.
- At projected returns (-3.0% appreciation + 3.0% rent growth), your $49k cash investment doubles in ~7 years — after that, you're playing with house money.
Negotiation context
- It's been on market 76 days — a 6% lower offer ($164k) is reasonable based on typical stale-listing flexibility.
Risks & watch-outs
- Watch-outs: flood insurance adds $66/mo.
- Climate carrying-cost: major flood risk; severe wildfire risk; extreme-heat days projected 6→14/yr by 2055 (HVAC capex compounding) — expect insurance premiums to compound above CPI over the hold.
Questions for the listing agent
- It's been on market 76 days. Have you received any prior offers? Is the seller open to a 6% concession, seller financing, or rate buy-down credit?
- What's the actual annual flood-insurance premium (NFIP or private), and is the property in a SFHA with mandatory coverage?
- Why hasn't it sold? Are there any deal-killer items the seller is aware of (foundation, flood, title, zoning, code violations)?
- Is there a deadline driving the sale (1031 exchange, divorce, estate, relocation)? That informs how much negotiation room exists.
- Schools are A-rated — typically a magnet for longer-tenancy family renters. What's the average tenant stay here, and is there a school-zone premium baked into asking?
- What's the average days-on-market for RENTAL listings here right now (not sales)? A rising rental-DOM trend means longer vacancies and softer asking-rent achievability than the comps imply.
- What's the recent tenant-quality profile in this submarket — average credit score on applications, eviction rate, late-payment / NSF rate, and stable-employment percentage? A property-management company in the area should have these aggregated.
- How much new for-sale + rental construction is in the pipeline within 1–3 miles? Heavy new supply typically softens prices + rents 12–24 months out; constrained supply supports both.
Investment metrics
- 1% rule
- 1.51% ✓
- Cap rate
- 12.32%
- Cash-on-cash
- 21.54%
- DSCR
- 1.96
- GRM
- 5.5
CMA / ARV
- ARV (on-the-fly)
- $172,032
- Comps found
- 9
Show comp detail 9 sales within ~0.75 mi
| Address | Dist | Beds/Ba | Sqft | Sold | Price | $/sf | Match |
|---|---|---|---|---|---|---|---|
| 6060 Nob Hl | 0.03mi | 2/2.0 | 1,344 (0%) | 24mo | $160,000 | $119 | 79 |
| 6074 Coleman Dr | 0.07mi | 2/2.0 | 1,180 (-12%) | 3mo | $185,000 | $157 | 74 |
| 6374 Brodie Dr | 0.28mi | 2/2.0 | 1,472 (+10%) | 2mo | $169,500 | $115 | 70 |
| 1911 Hillcrest Dr #067 | 0.37mi | 2/2.0 | 1,440 (+7%) | 6mo | $147,500 | $102 | 66 |
| 6536 Crest Dr #57 | 0.29mi | 2/2.0 | 1,440 (+7%) | 13mo | $184,792 | $128 | 64 |
| 1755 Sunset Dr | 0.15mi | 2/2.0 | 1,200 (-11%) | 14mo | $130,000 | $108 | 63 |
| 1962 Hillcrest Dr | 0.28mi | 2/2.0 | 1,440 (+7%) | 15mo | $186,000 | $129 | 63 |
| 6503 Lake Dr | 0.23mi | 2/2.0 | 1,440 (+7%) | 19mo | $225,000 | $156 | 62 |
| 6556 Crest Dr | 0.26mi | 2/2.0 | 1,200 (-11%) | 22mo | $162,500 | $135 | 52 |
Match score weights: distance 35% · size 25% · config 20% · recency 20%. Top-matched comps best support the ARV.
Projected returns pro-forma
-3.0% appreciation · 3.0% rent growth · sell at horizon
- IRR
- 12.1%
- Equity multiple
- 1.48×
- Total profit
- $23,353
- Equity at exit
- $25,944
- IRR
- 21.0%
- Equity multiple
- 2.78×
- Total profit
- $86,935
- Equity at exit
- $15,044
Cash invested: $48,720 (down + closing). Projections, not guarantees.
Landlord ↔ Tenant lean methodology
- Overall (STATE)
- 18 Strongly Tenant-Friendly
- State California
- 18 Strongly Tenant-Friendly · D+13
- County
- — inherits STATE
- City
- — inherits STATE
ZIP-level market 95658
- Active inventory
- 54
- Price-to-rent
- 5.5×
Monthly cashflow live
- Estimated rent
- $2,629 medium interval (Pro) →
- Mortgage (P&I)
- −$912
- Tax est. 1.5%
- −$218 /mo · $2,610/yr
- Insurance
- −$72
- Flood insurance flood zone
- −$66 /mo · $798/yr
- HOA
- −$0
- Vacancy / Maint / Mgmt
- −$552
- Net cashflow
- $808
Break-even live
UW: 25.0% down · 7.5% · 30yr · 1.5% tax · 5.0% vac · 8.0% maint · 8.0% mgmt
Financing live
Cash to close
- Down payment
- $43,500
- Closing costs
- $5,220
- Reserves months
- —
- Total cash needed
- —
Loan-product check · same deal, 3 products live
Conventional
25% down · 7.5% · 30yr
- Down + closing
- —
- Monthly P&I
- —
- Monthly cashflow
- —
- DSCR
- —
- Eligible?
- —
Personal DTI + credit; lowest rate.
DSCR
20% down · 8.5% · 30yr
- Down + closing
- —
- Monthly P&I
- —
- Monthly cashflow
- —
- DSCR
- —
- Eligible?
- —
No personal income docs; deal must DSCR.
Hard money
10% down · 12.0% · 12mo
- Down + closing
- —
- Monthly P&I
- —
- Monthly cashflow
- —
- DSCR
- —
- Eligible?
- —
Short-term bridge; refi at stabilization.
Listing history 13 events
-
2026-06-18days on market $174,000 Active 76 DOM
-
2026-06-17pricedays on market $174,000 Active 75 DOM
-
2026-06-16days on market $189,000 Active 74 DOM
-
2026-06-15days on market $189,000 Active 73 DOM
-
2026-06-13days on market $189,000 Active 71 DOM
-
2026-06-13days on market $189,000 Active 70 DOM
-
2026-06-09days on market $189,000 Active 67 DOM
-
2026-06-08days on market $189,000 Active 66 DOM
-
2026-06-07days on market $189,000 Active 65 DOM
-
2026-06-03days on market $189,000 Active 61 DOM
-
2026-06-02days on market $189,000 Active 60 DOM
-
2026-06-01days on market $189,000 Active 59 DOM
-
2026-05-31days on market $189,000 Active 58 DOM
ⓘ Source: listings_history table (triggers on properties + properties_extension) + one-shot
backfill from property_details.listing_events for pre-trigger history.
Climate risk First Street
- Flood 7/10 Severe FEMA zone X (unshaded) · 99% chance over 30 yrs
- Wildfire 10/10 Extreme
- Heat 6/10 Major 6 d/yr ≥100°F today · 14 d/yr by 30 yrs out
- Wind 1/10 Low
- Air quality 10/10 Extreme 34 unhealthy d/yr today · 41 by 30 yrs out
Nearby sold comps map
Loading sold comps map…
Walkable amenities ~0.75 mi
Loading nearby amenities…
Taxation est. · year 1
- Rental income
- $31,550
- − Mortgage interest
- −$9,747
- − Property taxes
- −$2,610
- − Insurance
- −$1,667
- − Repairs & maintenance
- −$2,524
- − Management
- −$2,524
- − Depreciation
- −$5,062
- Taxable income
- $7,416
- Est. tax owed @ 24.0%
- −$1,780
- After-tax cash flow
- $7,917/yr
For passive investors: Depreciation is non-cash, so a rental often shows a tax loss while cash-flowing — sheltering income. Rental losses are passive: they offset passive income freely, and up to $25,000/yr can offset ordinary (W-2) income if you actively participate and your MAGI is under $100k (phasing out to $0 by $150k); unused losses carry forward. On sale, claimed depreciation is recaptured at up to 25%, and gains may owe capital-gains tax (a 1031 exchange can defer both). Figures are a year-1 estimate at your 24.0% rate — not tax advice; consult a CPA.
Schools (NCES district)
- District
- Placer Union High
- NCES district ID
- 0630750
- Math proficiency
- 39% ▲ 1.00%
- Reading proficiency
- 72% ▲ 3.00%
- Median HH income
- $69,119
- Composite
- 49.04/100
- National rank
- #2060
- State rank
- #98 of 517 in CA
Livability — Newcastle
- Score
- 56/100
- State rank
- #792
- US rank
- #22660
Category grades
Schools grade is shown separately in the Schools card above.
Census & demographics
- Census place
- Newcastle, CA
- Population (ZIP)
- 6,197
Population outlook (Placer County) Hauer SSP2
- Today (2025)
- 422,709 people
- By 2030
- 444,249 · +5.1%
- By 2040
- 480,192 · +13.6%
- By 2050
- 506,390 · +19.8%
- By 2075
- 550,219 · +30.2%
- By 2100
- 547,760 · +29.6%
Race, ethnicity, and origin ACS 2023
- Neighborhood character
- Predominantly White (80%)
- Race & ethnicity
- White 80% Hispanic / Latino 9% Two or more races 7% Black 3% Native American 2% Asian 1%
- Hispanic origin (detail)
- Mexican 8%
- Common ancestry
- Italian 5% Slovak 4% Russian 3%
- Foreign-born
- 4% · Canada
- Languages at home
- 93% English-only · German/W. Germanic 2% Spanish 1% Other Asian/Pacific 1%
Political lean MEDSL · Placer
- 2024 margin
- Lean R (+8.5) · D 44.3% · R 52.8% · Other 2.9%
- 2008→2024 swing
- +2.8pp toward D · 2008: -11.3pp · 2024: -8.5pp
- All cycles
- 2024: R+8.5 2020: R+6.7 2016: R+11.3 2012: R+20.1 2008: R+11.3
Not yet ingested
- Civics
- —
Market trends
- HPI YoY
- ▼ -292.40%
- Current HPI
- 288.3247
- Rent YoY
- —
- Metro
- —
- State GDP YoY
- ▲ 3.21%
- F500 in state
- 116
Industry mix (Fortune 500 HQ in CA)
| Industry | F500 HQs | Revenue |
|---|---|---|
| Technology | 27 | $1,492B |
|
||
| Financial Services | 3 | $174B |
|
||
| Retail | 3 | $44B |
|
||
| Insurance | 3 | $26B |
|
||
| Media / Entertainment | 2 | $115B |
|
||
| Pharmaceuticals / Biotech | 2 | $62B |
|
||
Cash-flow waterfall
monthlySold comps — $/sqft
last 12 mo · ≤1 miLoading sold comps…