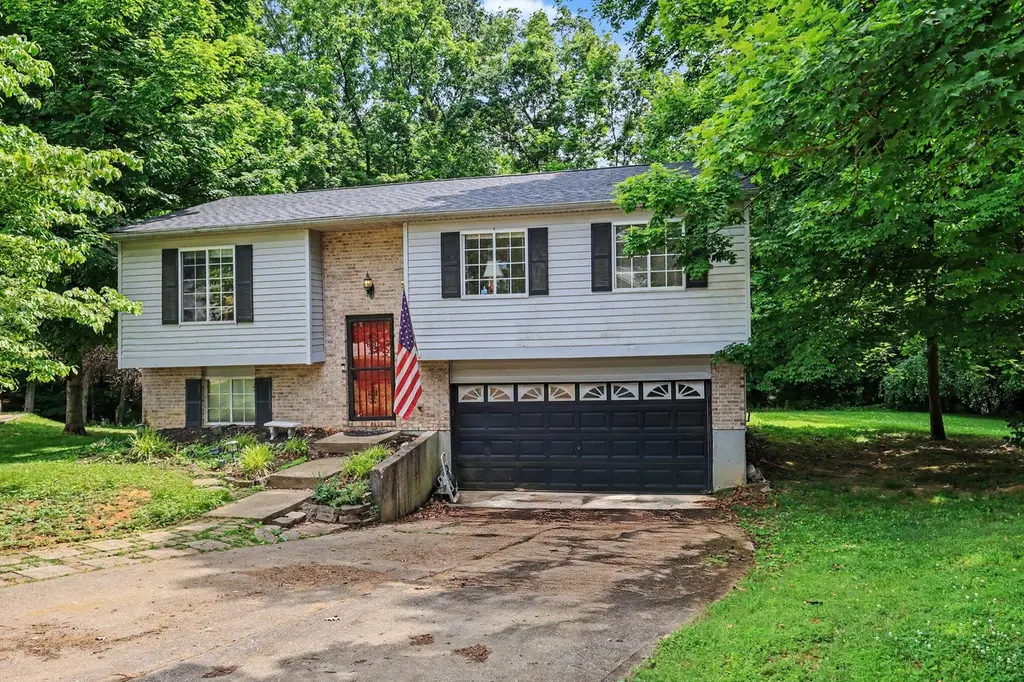
13 Ashwood Ln · Alexandria, KY
Flood risk 1/10 · Minimal
- FEMA flood zone
- X (unshaded)
- Chance of flooding over 30 yrs
- 0.0%
- Est. flood insurance / yr
- $507 – $1,088
Fire risk 1/10 · Minimal
- Est. fire insurance / yr
- $839 – $1,559
Heat risk 4/10 · Minor
- Hot days now (above 103°F)
- 7 days/yr
- Hot days in 30 yrs
- 19 days/yr
Wind risk 2/10 · Minimal
- Chance of severe wind over 30 yrs
- 1.0%
Air-quality risk 3/10 · Minor
- Unhealthy air days now
- 2 days/yr
- Unhealthy air days in 30 yrs
- 3 days/yr
Risk factors via First Street. Map © Google.
Why this score? — see what drove the D+ grade
The composite is a weighted blend of 9 inputs, each scored 0–100. Each bar is that input's sub-score; the figure is the points it added to the 100-point composite (weight × sub-score).
- ARV discount +14.6/15.0
- Cash flow +13.1/30.0
- Livability +4.2/5.0
- Schools +4.0/10.0
- DSCR +3.9/10.0
- 1% rule +3.2/10.0
- Rent growth +2.5/5.0
- Condition / age +2.5/5.0
- Appreciation +0.0/10.0
$229,000
🖨 Deal sheet 📄 Offer letter ✓ Due diligence
Listing remarks
Welcome home to this charming 3-bedroom, 2-bath residence offering the perfect blend of comfort and functionality. Step outside to enjoy the large rear deck, perfect for entertaining, grilling, or relaxing while overlooking the peaceful wooded backyard. With generous living areas and flexible bonus space in the basement, this home is ready for you to make it your own.
Key facts
- Flexible bonus space
- Large rear deck
- 0.72 acre lot
Tags
Property features AI
Exterior
- Parking: Driveway; Garage (1-car)
- Utilities: Public water; Public sewer; Sewer and water available
- Home design: Single family residence; Two levels; Existing structure
- Construction: Vinyl siding; Poured concrete foundation
- Exterior features: Vinyl frames on windows; Shingle roof; Lot approximately 0.72 acres
Interior
- Kitchen: Electric cooktop; Electric oven; Dishwasher; Microwave; Refrigerator
- Bedrooms: Primary bedroom (11 x 15); Bedroom 2 (10 x 12); Bedroom 3 (9 x 9)
- Bathrooms: 2 full bathrooms
- Heating & cooling: Central air conditioning; Electric heating
- Interior features: Dishwasher; Microwave; Refrigerator; Electric cooktop; Electric oven; Full basement
Neighborhood map
What this means for you Summary
Snapshot
- This is a 3-bed/2.0-bath single-family listed at $229k.
Deal economics
- At list price, monthly cash flow is $-8 ($-91/yr) — negative.
- To cash-flow at today's rent, offer at most $228k (0.6% below list).
- To meet the 1% rule (rent ≥ 1% of price), the offer needs to be $187k (18.2% below list).
- Recommended offer: $187k (18.2% below list) — sets the bar for 1% rule.
- Cap rate 6.3% vs local median 2.6% in Alexandria — top-decile yield for the area; either an underpriced asset or a hidden risk that comps aren't pricing in. Stress-test before assuming the spread holds.
Location & tenants
- Location reads 84/100 on livability (#51 in KY, #644 nationally) — a professional / high-income tenant draw. Strengths: crime A+, employment A+, cost of living A+; Watch: amenities F, health & safety F.
- Campbell County (suburban): math 43% / reading 47% proficiency, ranked #15 of 165 in KY (top 9%) — families likely to look elsewhere, expect single-tenant / working-renter base with shorter leases.
- Zoned schools: Crossroads Elementary School (math 39% / reading 37%, grade F, #242 of 676 statewide, top 37%, 613 students, 58% FRL); Campbell County Middle School (math 37% / reading 45%, grade F, #54 of 217 statewide, top 25%, 1,184 students, 45% FRL); Campbell County High School (math 35% / reading 43%, grade F, #51 of 254 statewide, top 21%, 1,551 students, 41% FRL).
- Market conditions: 171 active listings in the ZIP; solid renter incomes; 247 units permitted in Campbell County in 2024 (77 in 5+ unit buildings).
Forward outlook
- Local home prices are declining (-3.0%/yr); year-one equity from $2k of loan paydown is wiped out by about $7k of value loss. Plan a longer hold.
Negotiation context
- Only 1 days on market — expect competitive offers; lowballing is unlikely to land.
- Current owner paid $120k; list at $229k implies a 91% gain — meaningful room to come down on a strong offer.
Questions for the listing agent
- What do current leases actually rent for vs. the listed asking? Can we see a recent rent roll and the last 12 months of T-12 income?
- Is there a deadline driving the sale (1031 exchange, divorce, estate, relocation)? That informs how much negotiation room exists.
- Schools are A-rated — typically a magnet for longer-tenancy family renters. What's the average tenant stay here, and is there a school-zone premium baked into asking?
- The area grade is low — what's the realistic commute time and amenity access for the typical tenant pool here? Any planned neighborhood developments (good or bad) we should know about?
- What's the average days-on-market for RENTAL listings here right now (not sales)? A rising rental-DOM trend means longer vacancies and softer asking-rent achievability than the comps imply.
- What's the recent tenant-quality profile in this submarket — average credit score on applications, eviction rate, late-payment / NSF rate, and stable-employment percentage? A property-management company in the area should have these aggregated.
- How much new for-sale + rental construction is in the pipeline within 1–3 miles? Heavy new supply typically softens prices + rents 12–24 months out; constrained supply supports both.
Investment metrics
- 1% rule
- 0.82% ✗
- Cap rate
- 6.25%
- Cash-on-cash
- -0.14%
- DSCR
- 0.99
- GRM
- 10.2
CMA / ARV
- ARV (on-the-fly)
- $272,160
- Comps found
- 12
Show comp detail 12 sales within ~0.75 mi
| Address | Dist | Beds/Ba | Sqft | Sold | Price | $/sf | Match |
|---|---|---|---|---|---|---|---|
| 4 Woodbury Ln | 0.19mi | 3/2.0 | 1,449 (+1%) | 7mo | $155,000 | $107 | 84 |
| 602 Brookwood Dr | 0.16mi | 3/2.5 | 1,506 (+5%) | 1mo | $282,500 | $188 | 82 |
| 9 N Rosewood Ct | 0.26mi | 3/2.5 | 1,440 (0%) | 10mo | $285,000 | $198 | 78 |
| 8 Driftwood Ct | 0.18mi | 3/2.5 | 1,510 (+5%) | 5mo | $285,000 | $189 | 77 |
| 604 Brookwood Dr | 0.16mi | 3/1.5 | 1,400 (-3%) | 11mo | $278,000 | $199 | 77 |
| 222 Springwood Dr | 0.27mi | 3/2.5 | 1,518 (+5%) | 2mo | $300,000 | $198 | 75 |
| 320 Brookwood Dr | 0.23mi | 3/2.0 | 1,516 (+5%) | 13mo | $260,000 | $172 | 70 |
| 504 Brookwood Dr | 0.13mi | 4/2.5 (+1) | 1,536 (+7%) | 10mo | $294,000 | $191 | 68 |
| 502 Brookwood Dr | 0.12mi | 3/2.5 | 1,628 (+13%) | 4mo | $285,000 | $175 | 67 |
| 17 Valleyview Cir | 0.41mi | 4/2.0 (+1) | 1,512 (+5%) | 3mo | $277,900 | $184 | 65 |
| 2 S Bellewood Ct | 0.58mi | 3/2.5 | 1,510 (+5%) | 6mo | $285,000 | $189 | 57 |
| 144 Ridgewood Dr | 0.71mi | 3/2.0 | 1,624 (+13%) | 12mo | $340,000 | $209 | 36 |
Match score weights: distance 35% · size 25% · config 20% · recency 20%. Top-matched comps best support the ARV.
Projected returns pro-forma
-3.0% appreciation · 3.0% rent growth · sell at horizon
- IRR
- -16.6%
- Equity multiple
- 0.41×
- Total profit
- $-37,619
- Equity at exit
- $34,145
- IRR
- -8.4%
- Equity multiple
- 0.48×
- Total profit
- $-33,500
- Equity at exit
- $19,800
Cash invested: $64,120 (down + closing). Projections, not guarantees.
Landlord ↔ Tenant lean methodology
- Overall (STATE)
- 83 Strongly Landlord-Friendly
- State Kentucky
- 83 Strongly Landlord-Friendly · R+16
- County
- — inherits STATE
- City
- — inherits STATE
ZIP-level market 41001
- Active inventory
- 171
- Price-to-rent
- 10.2×
Monthly cashflow live
- Estimated rent
- $1,874 medium interval (Pro) →
- Mortgage (P&I)
- −$1,201
- Tax from tax record
- −$192 /mo · $2,299/yr
- Insurance
- −$95
- HOA
- −$0
- Vacancy / Maint / Mgmt
- −$394
- Net cashflow
- $-8
Break-even live
UW: 25.0% down · 7.5% · 30yr · 1.5% tax · 5.0% vac · 8.0% maint · 8.0% mgmt
Financing live
Cash to close
- Down payment
- $57,250
- Closing costs
- $6,870
- Reserves months
- —
- Total cash needed
- —
Loan-product check · same deal, 3 products live
Conventional
25% down · 7.5% · 30yr
- Down + closing
- —
- Monthly P&I
- —
- Monthly cashflow
- —
- DSCR
- —
- Eligible?
- —
Personal DTI + credit; lowest rate.
DSCR
20% down · 8.5% · 30yr
- Down + closing
- —
- Monthly P&I
- —
- Monthly cashflow
- —
- DSCR
- —
- Eligible?
- —
No personal income docs; deal must DSCR.
Hard money
10% down · 12.0% · 12mo
- Down + closing
- —
- Monthly P&I
- —
- Monthly cashflow
- —
- DSCR
- —
- Eligible?
- —
Short-term bridge; refi at stabilization.
Listing history 3 events
-
2026-06-13status $229,000 Pending 1 DOM
-
2026-06-13remarks 370-char remark
-
2026-06-13$229,000 Active 1 DOM
ⓘ Source: listings_history table (triggers on properties + properties_extension) + one-shot
backfill from property_details.listing_events for pre-trigger history.
Tax reassessment forecast KY · Resets to sale price
- Current annual tax
- $2,299 · $192/mo
- Projected year-2 tax
- $2,299 · $192/mo
- Expected delta
- $0/yr ($0/mo · 0.0%)
ⓘ Screening estimate from a state-policy table — verify with the county assessor before closing.
Climate risk First Street
- Flood 1/10 Low FEMA zone X (unshaded) · 0% chance over 30 yrs
- Wildfire 1/10 Low
- Heat 4/10 Moderate 7 d/yr ≥103°F today · 19 d/yr by 30 yrs out
- Wind 2/10 Low 100% chance of damaging wind over 30 yrs
- Air quality 3/10 Moderate 2 unhealthy d/yr today · 3 by 30 yrs out
Nearby sold comps map
Loading sold comps map…
Walkable amenities ~0.75 mi
Loading nearby amenities…
Taxation est. · year 1
- Rental income
- $22,486
- − Mortgage interest
- −$12,828
- − Property taxes
- −$2,299
- − Insurance
- −$1,145
- − Repairs & maintenance
- −$1,799
- − Management
- −$1,799
- − Depreciation
- −$6,662
- Taxable loss
- −$4,045
- Est. tax savings @ 24.0%
- +$971
- After-tax cash flow
- $880/yr
For passive investors: Depreciation is non-cash, so a rental often shows a tax loss while cash-flowing — sheltering income. Rental losses are passive: they offset passive income freely, and up to $25,000/yr can offset ordinary (W-2) income if you actively participate and your MAGI is under $100k (phasing out to $0 by $150k); unused losses carry forward. On sale, claimed depreciation is recaptured at up to 25%, and gains may owe capital-gains tax (a 1031 exchange can defer both). Figures are a year-1 estimate at your 24.0% rate — not tax advice; consult a CPA.
Schools (NCES district)
- District
- Campbell County
- NCES district ID
- 2100900
- Math proficiency
- 43% ▼ -11.00%
- Reading proficiency
- 47% ▼ -14.00%
- Median HH income
- $62,891
- Composite
- 39.86/100
- National rank
- #3864
- State rank
- #15 of 165 in KY
Livability — Alexandria
- Score
- 84/100
- State rank
- #51
- US rank
- #644
Category grades
Schools grade is shown separately in the Schools card above.
Census & demographics
- Census place
- Alexandria, KY
- County
- Campbell County · 84,793 people
- City population
- 19,323
- Metro
- Cincinnati, OH-KY-IN
- Population (ZIP)
- 19,323
- Household income
- $102,447
- Rent vs Own
- Severe rent burden
- 129.0
Population outlook (Campbell County) Hauer SSP2
- Today (2025)
- 95,668 people
- By 2030
- 96,886 · +1.3%
- By 2040
- 97,734 · +2.2%
- By 2050
- 96,413 · +0.8%
- By 2075
- 90,211 · -5.7%
- By 2100
- 79,434 · -17.0%
Race, ethnicity, and origin ACS 2023
- Neighborhood character
- Predominantly White (93%)
- Race & ethnicity
- White 93% Two or more races 3% Hispanic / Latino 2% Asian 2% Black 1%
- Common ancestry
- Slovak 4% Lithuanian 2% Italian 2%
- Foreign-born
- 2%
- Languages at home
- 97% English-only · Other Indo-European 1% Other Asian/Pacific 1% Spanish 0%
Political lean MEDSL · Campbell
- 2024 margin
- R (+19.7) · D 39.2% · R 58.9% · Other 1.9%
- 2008→2024 swing
- +1.2pp toward D · 2008: -20.9pp · 2024: -19.7pp
- All cycles
- 2024: R+19.7 2020: R+18.6 2016: R+24.5 2012: R+22.8 2008: R+20.9
Not yet ingested
- Civics
- —
Market trends
- HPI YoY
- ▼ -120.32%
- Current HPI
- 189.7464
- Rent YoY
- —
- Metro
- Cincinnati, OH-KY-IN
- State GDP YoY
- ▲ 1.81%
- F500 in state
- 4
Industry mix (Fortune 500 HQ in KY)
| Industry | F500 HQs | Revenue |
|---|---|---|
| Healthcare | 1 | $118B |
|
||
| Food / Beverage | 1 | $7B |
|
||
Price history
+242.3% since first listed3 events — show timeline
- 2026-06-12 Listed $229,000 NKMLS
- 2002-09-10 Sold (Public Records) $120,000 Public Records
- 1991-09-18 Sold (Public Records) $66,900 Public Records
Property tax history
+4.1%/yrLatest (2025): $2,299 · -1.3% YoY. Source: county tax records.
Cash-flow waterfall
monthlySold comps — $/sqft
last 12 mo · ≤1 miLoading sold comps…