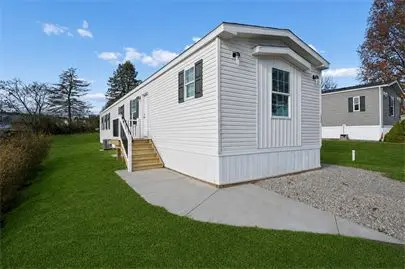
157 Treesdale Dr #56 · Cranberry, PA
Flood risk 1/10 · Minimal
- FEMA flood zone
- X (unshaded)
- Chance of flooding over 30 yrs
- 0.0%
- Est. flood insurance / yr
- $473 – $860
Fire risk 1/10 · Minimal
- Est. fire insurance / yr
- $511 – $949
Heat risk 4/10 · Minor
- Hot days now (above 96°F)
- 7 days/yr
- Hot days in 30 yrs
- 18 days/yr
Wind risk 1/10 · Minimal
- Chance of severe wind over 30 yrs
- —
Air-quality risk 3/10 · Minor
- Unhealthy air days now
- 3 days/yr
- Unhealthy air days in 30 yrs
- 5 days/yr
Risk factors via First Street. Map © Google.
Why this score? — see what drove the B grade
The composite is a weighted blend of 9 inputs, each scored 0–100. Each bar is that input's sub-score; the figure is the points it added to the 100-point composite (weight × sub-score).
- Cash flow +30.0/30.0
- 1% rule +10.0/10.0
- DSCR +10.0/10.0
- ARV discount +7.5/15.0
- Schools +5.2/10.0
- Condition / age +4.0/5.0
- Livability +2.5/5.0
- Rent growth +2.0/5.0
- Appreciation +0.0/10.0
$119,900
🖨 Deal sheet (PDF) 📄 Offer letter ✓ Due diligence
Listing remarks MLS
Brand new Colony 3 bedroom, 2 bathroom home located in our beautiful, private community. Transom window in Living Room, lots of cabinetry through the house, central air conditioning, black appliances, ceiling fans, 10 x 10 storage shed, paved sidewalk, poured patio and driveway are included in the price along with landscaping.
Key facts
- Black appliances
- Ceiling fans
- Storage shed
Tags
Neighborhood map
What this means for you Summary
Snapshot
- This is a 3-bed/2.0-bath manufactured listed at $120k. Condition is rated good.
Deal economics
- At list price, monthly cash flow is $864 ($10k/yr) — positive.
- The deal already cash-flows at list — no discount required.
- Meets the 1% rule at list price ($2k rent vs $120k).
- Recommended offer: $106k (12.0% below list) — sets the bar for market timing.
Location & tenants
- Location reads: area grade B — affects rentability + tenant quality, not the cash-flow math above.
- Seneca Valley SD (rural): math 48% / reading 67% proficiency, ranked #73 of 539 in PA (top 14%) — acceptable for families but not a draw, mixed tenant base, ~2y average lease; only 12% free/reduced lunch — higher-income household profile.
- Market conditions: Rents soft (-1.9%/yr); 289 active listings in the ZIP; 14 comparable units currently listed for rent nearby; rentals leasing fast (median 3d on market — plan ~1-2 weeks tenant-placement turnaround); high-income renter base; 987 units permitted in Butler County in 2024 (0 in 5+ unit buildings).
Forward outlook
- Local home prices are declining (-3.0%/yr); year-one equity from $829 of loan paydown is wiped out by about $4k of value loss. Plan a longer hold.
- Butler County population projected to shrink 5% by 2050 — rents likely to lag national; underwrite the cash flow, not the appreciation.
- At projected returns (-3.0% appreciation + 0.0% rent growth), your $34k cash investment doubles in ~5 years — after that, you're playing with house money.
Negotiation context
- It's been on market 351 days — a 12% lower offer ($106k) is reasonable based on typical stale-listing flexibility.
Questions for the listing agent
- It's been on market 351 days. Have you received any prior offers? Is the seller open to a 12% concession, seller financing, or rate buy-down credit?
- Why hasn't it sold? Are there any deal-killer items the seller is aware of (foundation, flood, title, zoning, code violations)?
- Is there a deadline driving the sale (1031 exchange, divorce, estate, relocation)? That informs how much negotiation room exists.
- What's the average days-on-market for RENTAL listings here right now (not sales)? A rising rental-DOM trend means longer vacancies and softer asking-rent achievability than the comps imply.
- What's the recent tenant-quality profile in this submarket — average credit score on applications, eviction rate, late-payment / NSF rate, and stable-employment percentage? A property-management company in the area should have these aggregated.
- How much new for-sale + rental construction is in the pipeline within 1–3 miles? Heavy new supply typically softens prices + rents 12–24 months out; constrained supply supports both.
Investment metrics
- 1% rule
- 1.79% ✓
- Cap rate
- 14.94%
- Cash-on-cash
- 30.90%
- DSCR
- 2.37
- GRM
- 4.7
CMA / ARV
- ARV (median comp)
- $59,832
- List price
- $119,900
- Delta
- 100.39%
- Verdict
- OVERPRICED
- Comps
- 2 within 2.0 mi
Show comp detail 3 sales within ~0.75 mi
| Address | Dist | Beds/Ba | Sqft | Sold | Price | $/sf | Match |
|---|---|---|---|---|---|---|---|
| 601 Country Vue Ct | 0.04mi | 3/2.0 | 1,200 (+5%) | 4mo | $70,000 | $58 | 86 |
| 140 Treesdale Dr | 0.19mi | 3/2.0 | 1,200 (+5%) | 21mo | $55,000 | $46 | 65 |
| 402 Sunnydale Dr | 0.20mi | 3/2.0 | 1,200 (+5%) | 21mo | $30,000 | $25 | 64 |
Match score weights: distance 35% · size 25% · config 20% · recency 20%. Top-matched comps best support the ARV.
Projected returns pro-forma
-3.0% appreciation · 0.0% rent growth · sell at horizon
- IRR
- 22.2%
- Equity multiple
- 1.88×
- Total profit
- $29,379
- Equity at exit
- $17,877
- IRR
- 28.2%
- Equity multiple
- 3.15×
- Total profit
- $72,337
- Equity at exit
- $10,367
Cash invested: $33,572 (down + closing). Projections, not guarantees.
Landlord ↔ Tenant lean methodology
- Overall (STATE)
- 62 Landlord-Friendly
- State Pennsylvania
- 62 Landlord-Friendly · EVEN
- County
- — inherits STATE
- City
- — inherits STATE
ZIP-level market 16066
- Rents YoY
- -1.9%
- Active inventory
- 289
- Price-to-rent
- 4.7×
Monthly cashflow live
- Estimated rent
- $2,143 high interval (Pro) →
- Mortgage (P&I)
- −$629
- Tax est. 1.5%
- −$150 /mo · $1,798/yr
- Insurance
- −$50
- HOA
- −$0
- Vacancy / Maint / Mgmt
- −$450
- Net cashflow
- $864
Break-even live
Sensitivity live
| Price | -10% $947 | -5% $906 | +0% $864 | +5% $823 | +10% $782 |
|---|---|---|---|---|---|
| Rent | -10% $695 | -5% $780 | +0% $864 | +5% $949 | +10% $1,034 |
| Rate | -1.0pp $925 | -0.5pp $895 | base $864 | +0.5pp $833 | +1.0pp $802 |
UW: 25.0% down · 7.5% · 30yr · 1.5% tax · 5.0% vac · 8.0% maint · 8.0% mgmt
Financing live
Cash to close
- Down payment
- $29,975
- Closing costs
- $3,597
- Reserves months
- —
- Total cash needed
- —
Loan-product check · same deal, 3 products live
Conventional
25% down · 7.5% · 30yr
- Down + closing
- —
- Monthly P&I
- —
- Monthly cashflow
- —
- DSCR
- —
- Eligible?
- —
Personal DTI + credit; lowest rate.
DSCR
20% down · 8.5% · 30yr
- Down + closing
- —
- Monthly P&I
- —
- Monthly cashflow
- —
- DSCR
- —
- Eligible?
- —
No personal income docs; deal must DSCR.
Hard money
10% down · 12.0% · 12mo
- Down + closing
- —
- Monthly P&I
- —
- Monthly cashflow
- —
- DSCR
- —
- Eligible?
- —
Short-term bridge; refi at stabilization.
Rent comps 14 comps
| Address | Beds | Baths | Sqft | Rent | $/sqft | DOM | Units | Dist |
|---|---|---|---|---|---|---|---|---|
| 411 Sussex Dr Cranberry Township, PA | 4.0 | 2.0 | 1352 | $2,500 | $1.85 | 15d | 1 | 0.33mi |
| 244 E Commons Dr Cranberry Township, PA | 2.0 | 1.5 | 1116 | $1,700 | $1.52 | 13d | 1 | 0.41mi |
| 315 Bellford Ct Cranberry Township, PA | 2.0 | 1.5 | 1116 | $850 | $0.76 | 18d | 1 | 0.44mi |
| 24 Robinhood Dr Cranberry Township, PA | 3.0 | 1.5 | 1170 | $2,125 | $1.82 | 44d | 1 | 0.54mi |
| 8000 Brandt Dr Cranberry Twp, PA | 1.0–3.0 | 1.0–2.0 | 1193 | $2,776 | $2.33 | 2d | 26 | 0.73mi |
| 401 Collingwood Ct Cranberry Twp, PA | 1.0–3.0 | 1.0–2.0 | 950 | $1,865 | $1.96 | 2d | 1 | 0.86mi |
| 26 Monmouth Dr Cranberry Township, PA | 3.0 | 1.5 | 1470 | $2,150 | $1.46 | 2d | 1 | 0.89mi |
| 10100 Kettlecreek Dr Cranberry Township, PA | 1.0–2.0 | 1.0–2.0 | 976 | $1,875 | $1.92 | 2d | 21 | 0.95mi |
| 15000 Metropolitan WAY Cranberry Twp, PA | 2.0 | 2.0 | 1202 | $1,805 | $1.50 | 3d | 4 | 1.00mi |
| 90 Berkley Manor Dr Cranberry Township, PA | 1.0–3.0 | 1.0–2.0 | 1023 | $2,340 | $2.29 | 2d | 16 | 1.10mi |
| 1000 Strand Rd Cranberry Township, PA | 1.0–3.0 | 1.0–2.0 | 1117 | $3,048 | $2.73 | 3d | 13 | 1.11mi |
| 102 Holly Dr Cranberry Township, PA | 3.0 | 1.0–2.0 | 1129 | $1,175 | $1.04 | 2d | 1 | 1.35mi |
| 1204 Dutilh Rd #1 Cranberry Township, PA | 2.0 | 1.0 | 1008 | $1,500 | $1.49 | 2d | 1 | 1.45mi |
| 1202 Dutilh Rd Unit 24 Cranberry Twp, PA | 2.0 | 1.5 | 950 | $1,500 | $1.58 | 2d | 1 | 1.50mi |
Listing history 15 events
-
2026-06-17days on market $119,900 Active 351 DOM
-
2026-06-16days on market $119,900 Active 350 DOM
-
2026-06-15days on market $119,900 Active 349 DOM
-
2026-06-13days on market $119,900 Active 347 DOM
-
2026-06-13days on market $119,900 Active 346 DOM
-
2026-06-09days on market $119,900 Active 343 DOM
-
2026-06-08days on market $119,900 Active 342 DOM
-
2026-06-07days on market $119,900 Active 341 DOM
-
2026-06-05days on market $119,900 Active 338 DOM
-
2026-06-03days on market $119,900 Active 337 DOM
-
2026-06-02days on market $119,900 Active 336 DOM
-
2026-06-01days on market $119,900 Active 335 DOM
-
2026-05-31days on market $119,900 Active 334 DOM
-
2026-01-14price $119,900 328-char remark
Show marketing remark (328 chars)
Brand new Colony 3 bedroom, 2 bathroom home located in our beautiful, private community. Transom window in Living Room, lots of cabinetry through the house, central air conditioning, black appliances, ceiling fans, 10 x 10 storage shed, paved sidewalk, poured patio and driveway are included in the price along with landscaping.
-
2025-07-01$122,500 Active 328-char remark
Show marketing remark (328 chars)
Brand new Colony 3 bedroom, 2 bathroom home located in our beautiful, private community. Transom window in Living Room, lots of cabinetry through the house, central air conditioning, black appliances, ceiling fans, 10 x 10 storage shed, paved sidewalk, poured patio and driveway are included in the price along with landscaping.
ⓘ Source: listings_history table (triggers on properties + properties_extension) + one-shot
backfill from property_details.listing_events for pre-trigger history.
Climate risk First Street
- Flood 1/10 Low FEMA zone X (unshaded) · 0% chance over 30 yrs
- Wildfire 1/10 Low
- Heat 4/10 Moderate 7 d/yr ≥96°F today · 18 d/yr by 30 yrs out
- Wind 1/10 Low
- Air quality 3/10 Moderate 3 unhealthy d/yr today · 5 by 30 yrs out
Nearby sold comps map
Loading sold comps map…
Walkable amenities ~0.75 mi
Loading nearby amenities…
Taxation est. · year 1
- Rental income
- $25,717
- − Mortgage interest
- −$6,716
- − Property taxes
- −$1,798
- − Insurance
- −$600
- − Repairs & maintenance
- −$2,057
- − Management
- −$2,057
- − Depreciation
- −$3,488
- Taxable income
- $9,000
- Est. tax owed @ 24.0%
- −$2,160
- After-tax cash flow
- $8,213/yr
For passive investors: Depreciation is non-cash, so a rental often shows a tax loss while cash-flowing — sheltering income. Rental losses are passive: they offset passive income freely, and up to $25,000/yr can offset ordinary (W-2) income if you actively participate and your MAGI is under $100k (phasing out to $0 by $150k); unused losses carry forward. On sale, claimed depreciation is recaptured at up to 25%, and gains may owe capital-gains tax (a 1031 exchange can defer both). Figures are a year-1 estimate at your 24.0% rate — not tax advice; consult a CPA.
Condition & rehab AI · 12 photos
This brand new mobile home is in excellent condition with modern finishes and a well-maintained exterior. It offers a great opportunity for investors looking to maximize both resale and rental value.
Value-add opportunities
- Both Paint exterior siding — Fresh paint can enhance curb appeal and property value
- Both Replace ceiling fans with energy-efficient models — Energy-efficient fans can reduce energy costs and improve comfort
- Both Install smart home devices — Smart home devices can increase property value and attract tech-savvy buyers
Renovation cost estimate screening
Value-add ROI direction
- Both Paint exterior siding — Fresh paint can enhance curb appeal and property value ↑
- Both Replace ceiling fans with energy-efficient models — Energy-efficient fans can reduce energy costs and improve comfort ↑
- Both Install smart home devices — Smart home devices can increase property value and attract tech-savvy buyers ↑
ⓘ Cost ranges are severity-bucket heuristics (US national rule-of-thumb). Get contractor quotes + a written scope before underwriting a rehab budget.
Schools (NCES district)
- District
- Seneca Valley SD
- NCES district ID
- 4222440
- Math proficiency
- 48% ▼ -15.00%
- Reading proficiency
- 67% ▼ -12.00%
- Median HH income
- $80,381
- Composite
- 51.84/100
- National rank
- #1666
- State rank
- #73 of 539 in PA
Livability — Cranberry
No livability data for this city. (Only ~50 U.S. cities are tracked.)
Census & demographics
- County
- Butler County · 73,107 people
- Metro
- Pittsburgh, PA
- Population (ZIP)
- 33,873
- Household income
- $124,189
- Rent vs Own
- Severe rent burden
- 536.0
Population outlook (Butler County) Hauer SSP2
- Today (2025)
- 190,777 people
- By 2030
- 191,476 · +0.4%
- By 2040
- 189,474 · -0.7%
- By 2050
- 182,050 · -4.6%
- By 2075
- 159,526 · -16.4%
- By 2100
- 129,028 · -32.4%
Race, ethnicity, and origin ACS 2023
- Neighborhood character
- Predominantly White (90%)
- Race & ethnicity
- White 90% Asian 4% Two or more races 3% Hispanic / Latino 2% Black 1%
- Common ancestry
- Romanian 10% Slovak 1% Italian 1%
- Foreign-born
- 5% · Canada, China
- Languages at home
- 93% English-only · Other Indo-European 2% Spanish 1% Other Asian/Pacific 1%
Political lean MEDSL · Butler
- 2024 margin
- Solid R (+32.2) · D 33.5% · R 65.7%
- 2008→2024 swing
- -4.8pp toward R · 2008: -27.4pp · 2024: -32.2pp
- All cycles
- 2024: R+32.2 2020: R+32.5 2016: R+37.5 2012: R+34.9 2008: R+27.4
Not yet ingested
- Civics
- —
Market trends
- HPI YoY
- ▼ -154.35%
- Current HPI
- 276.4597
- Rent YoY
- ▼ -1.93%
- Metro
- Pittsburgh, PA
- State GDP YoY
- ▲ 1.68%
- F500 in state
- 34
Industry mix (Fortune 500 HQ in PA)
| Industry | F500 HQs | Revenue |
|---|---|---|
| Healthcare | 2 | $309B |
|
||
| Insurance | 2 | $27B |
|
||
| Telecommunications / Media | 1 | $124B |
|
||
| Industrial Distribution | 1 | $22B |
|
||
| Financial Services | 1 | $20B |
|
||
| Chemicals / Materials | 1 | $18B |
|
||
Price history
-2.1% since first listed2 events — show timeline
- 2026-01-14 Price Changed $119,900 Zillow
- 2025-07-01 Listed $122,500 Zillow
Cash-flow waterfall
monthlySold comps — $/sqft
last 12 mo · ≤1 miLoading sold comps…