7633 Rutherford Ln · Wildwood, FL
Flood risk No data
- FEMA flood zone
- —
- Chance of flooding over 30 yrs
- —
- Est. flood insurance / yr
- —
Fire risk No data
- Est. fire insurance / yr
- —
Heat risk No data
- Hot days now (above threshold)
- —
- Hot days in 30 yrs
- —
Wind risk No data
- Chance of severe wind over 30 yrs
- —
Air-quality risk No data
- Unhealthy air days now
- —
- Unhealthy air days in 30 yrs
- —
Risk factors via First Street. Map © Google.
Why this score? — see what drove the D+ grade
The composite is a weighted blend of 9 inputs, each scored 0–100. Each bar is that input's sub-score; the figure is the points it added to the 100-point composite (weight × sub-score).
- Cash flow +13.1/30.0
- ARV discount +7.5/15.0
- Schools +5.2/10.0
- Appreciation +5.0/10.0
- DSCR +3.9/10.0
- 1% rule +3.7/10.0
- Livability +3.5/5.0
- Rent growth +2.5/5.0
- Condition / age +2.5/5.0
$369,000
🖨 Deal sheet 📄 Offer letter ✓ Due diligence
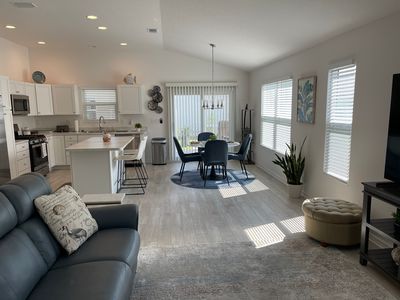
Listing remarks
Live the Lifestyle & acirc; & euro; & rdquo; Or Invest in It Welcome to this beautifully furnished, like-new home that offers the perfect blend of comfort, convenience, and opportunity. At just 1 1/2 years old, this 3-bedroom, 2-bath home is truly move-in ready & acirc; & euro; & rdquo; whether you& apos; re looking for a seasonal retreat, full-time residence, or a smart investment property. Step inside and feel instantly at home. The space is thoughtfully decorated and fully furnished, creating a warm and inviting atmosphere ideal for relaxing after a day of activities or hosting family and friends. Every room & acirc; & euro; & rdquo; including t
Key facts
- Double sinks
- Walk in showers
- Ceiling light-fans
Tags
Neighborhood map
What this means for you Summary
Snapshot
- This is a 3-bed/2.0-bath other listed at $369k.
Deal economics
- At list price, monthly cash flow is $-12 ($-144/yr) — negative.
- To cash-flow at today's rent, offer at most $367k (0.5% below list).
- To meet the 1% rule (rent ≥ 1% of price), the offer needs to be $321k (12.9% below list).
- Recommended offer: $321k (12.9% below list) — sets the bar for 1% rule.
- Cap rate 6.3% vs local median 3.9% in Wildwood — top-decile yield for the area; either an underpriced asset or a hidden risk that comps aren't pricing in. Stress-test before assuming the spread holds.
Location & tenants
- Location reads 69/100 on livability (#471 in FL) — a middle-class / working-renter tenant base. Strengths: health & safety A+, cost of living A, crime A-; Watch: schools C-, amenities F, commute F.
- Sumter (rural): math 61% / reading 61% proficiency, ranked #11 of 73 in FL (top 15%) — acceptable for families but not a draw, mixed tenant base, ~2y average lease.
- Market conditions: 44 active listings in the ZIP; 2 comparable units currently listed for rent nearby; 3,961 units permitted in Sumter County in 2024 (248 in 5+ unit buildings).
Forward outlook
- In year one you build about $14k of equity ($3k loan paydown + $11k appreciation (3.0% local appreciation)).
- Sumter County population projected at +45% by 2050 — long-run rental-demand tailwind backs the buy-and-hold thesis.
- At projected returns (3.0% appreciation + 3.0% rent growth), your $103k cash investment doubles in ~7 years — after that, you're playing with house money.
- By year 3, paydown + projected appreciation supports a ~$34k cash-out refi (75% LTV) — recoverable capital for the next deal without selling this one.
Negotiation context
- Only 1 days on market — expect competitive offers; lowballing is unlikely to land.
Questions for the listing agent
- What do current leases actually rent for vs. the listed asking? Can we see a recent rent roll and the last 12 months of T-12 income?
- Is there a deadline driving the sale (1031 exchange, divorce, estate, relocation)? That informs how much negotiation room exists.
- The area grade is low — what's the realistic commute time and amenity access for the typical tenant pool here? Any planned neighborhood developments (good or bad) we should know about?
- What's the average days-on-market for RENTAL listings here right now (not sales)? A rising rental-DOM trend means longer vacancies and softer asking-rent achievability than the comps imply.
- What's the recent tenant-quality profile in this submarket — average credit score on applications, eviction rate, late-payment / NSF rate, and stable-employment percentage? A property-management company in the area should have these aggregated.
- How much new for-sale + rental construction is in the pipeline within 1–3 miles? Heavy new supply typically softens prices + rents 12–24 months out; constrained supply supports both.
Investment metrics
- 1% rule
- 0.87% ✗
- Cap rate
- 6.25%
- Cash-on-cash
- -0.14%
- DSCR
- 0.99
- GRM
- 9.6
CMA / ARV
No comps found within radius.
Projected returns pro-forma
3.0% appreciation · 3.0% rent growth · sell at horizon
- IRR
- 7.4%
- Equity multiple
- 1.42×
- Total profit
- $43,734
- Equity at exit
- $165,918
- IRR
- 10.1%
- Equity multiple
- 2.52×
- Total profit
- $156,886
- Equity at exit
- $255,700
Cash invested: $103,320 (down + closing). Projections, not guarantees.
Landlord ↔ Tenant lean methodology
- Overall (STATE)
- 87 Strongly Landlord-Friendly
- State Florida
- 87 Strongly Landlord-Friendly · R+3
- County
- — inherits STATE
- City
- — inherits STATE
ZIP-level market 33585
- Active inventory
- 44
- Price-to-rent
- 9.6×
Monthly cashflow live
- Estimated rent
- $3,213 medium interval (Pro) →
- Mortgage (P&I)
- −$1,935
- Tax est. 1.5%
- −$461 /mo · $5,535/yr
- Insurance
- −$154
- HOA
- −$0
- Vacancy / Maint / Mgmt
- −$675
- Net cashflow
- $-12
Break-even live
UW: 25.0% down · 7.5% · 30yr · 1.5% tax · 5.0% vac · 8.0% maint · 8.0% mgmt
Financing live
Cash to close
- Down payment
- $92,250
- Closing costs
- $11,070
- Reserves months
- —
- Total cash needed
- —
Loan-product check · same deal, 3 products live
Conventional
25% down · 7.5% · 30yr
- Down + closing
- —
- Monthly P&I
- —
- Monthly cashflow
- —
- DSCR
- —
- Eligible?
- —
Personal DTI + credit; lowest rate.
DSCR
20% down · 8.5% · 30yr
- Down + closing
- —
- Monthly P&I
- —
- Monthly cashflow
- —
- DSCR
- —
- Eligible?
- —
No personal income docs; deal must DSCR.
Hard money
10% down · 12.0% · 12mo
- Down + closing
- —
- Monthly P&I
- —
- Monthly cashflow
- —
- DSCR
- —
- Eligible?
- —
Short-term bridge; refi at stabilization.
Rent comps 2 comps
| Address | Beds | Baths | Sqft | Rent | $/sqft | DOM | Units | Dist |
|---|---|---|---|---|---|---|---|---|
| 7661 Rutherford Ln Sumterville, FL | 3.0 | 2.0 | 1505 | $3,200 | $2.13 | 21d | 1 | 0.08mi |
| 6776 Robinette Run Sumterville, FL | 3.0 | 2.0 | 1929 | $3,450 | $1.79 | 21d | 1 | 1.46mi |
Nearby sold comps map
Loading sold comps map…
Walkable amenities ~0.75 mi
Loading nearby amenities…
Taxation est. · year 1
- Rental income
- $38,553
- − Mortgage interest
- −$20,670
- − Property taxes
- −$5,535
- − Insurance
- −$1,845
- − Repairs & maintenance
- −$3,084
- − Management
- −$3,084
- − Depreciation
- −$10,735
- Taxable loss
- −$6,400
- Est. tax savings @ 24.0%
- +$1,536
- After-tax cash flow
- $1,392/yr
For passive investors: Depreciation is non-cash, so a rental often shows a tax loss while cash-flowing — sheltering income. Rental losses are passive: they offset passive income freely, and up to $25,000/yr can offset ordinary (W-2) income if you actively participate and your MAGI is under $100k (phasing out to $0 by $150k); unused losses carry forward. On sale, claimed depreciation is recaptured at up to 25%, and gains may owe capital-gains tax (a 1031 exchange can defer both). Figures are a year-1 estimate at your 24.0% rate — not tax advice; consult a CPA.
Schools (NCES district)
- District
- Sumter
- NCES district ID
- 1201800
- Math proficiency
- 61% ▼ -4.00%
- Reading proficiency
- 61% ▼ -2.00%
- Median HH income
- $48,240
- Composite
- 51.74/100
- National rank
- #1682
- State rank
- #11 of 73 in FL
Livability — Wildwood
- Score
- 69/100
- State rank
- #471
- US rank
- #8500
Category grades
Schools grade is shown separately in the Schools card above.
Census & demographics
- Census place
- Wildwood, FL
- City population
- 21,568
- Population (ZIP)
- 1,424
Population outlook (Sumter County) Hauer SSP2
- Today (2025)
- 161,172 people
- By 2030
- 180,083 · +11.7%
- By 2040
- 209,892 · +30.2%
- By 2050
- 234,186 · +45.3%
- By 2075
- 284,602 · +76.6%
- By 2100
- 317,039 · +96.7%
Race, ethnicity, and origin ACS 2023
- Neighborhood character
- Predominantly White (69%)
- Race & ethnicity
- White 69% Hispanic / Latino 30% Two or more races 8%
- Hispanic origin (detail)
- Mexican 8% Puerto Rican 17% Cuban 5%
- Common ancestry
- Lithuanian 3% Scotch-Irish 2% Italian 2%
- Foreign-born
- 6% · Canada
- Languages at home
- 84% English-only · Spanish 15% French/Haitian/Cajun 1%
Political lean MEDSL · Sumter
- 2024 margin
- Solid R (+37.6) · D 30.9% · R 68.6%
- 2008→2024 swing
- -10.6pp toward R · 2008: -27.0pp · 2024: -37.6pp
- All cycles
- 2024: R+37.6 2020: R+36.1 2016: R+39.2 2012: R+34.9 2008: R+27.0
Not yet ingested
- Civics
- —
Market trends
- HPI YoY
- —
- Current HPI
- —
- Rent YoY
- —
- Metro
- —
- State GDP YoY
- ▲ 3.28%
- F500 in state
- 36
Industry mix (Fortune 500 HQ in FL)
| Industry | F500 HQs | Revenue |
|---|---|---|
| Industrial Technology | 2 | $29B |
|
||
| Insurance | 2 | $17B |
|
||
| Retail | 1 | $60B |
|
||
| Technology Distribution | 1 | $58B |
|
||
| Homebuilding | 1 | $35B |
|
||
| Technology Manufacturing | 1 | $35B |
|
||
Cash-flow waterfall
monthlySold comps — $/sqft
last 12 mo · ≤1 miLoading sold comps…