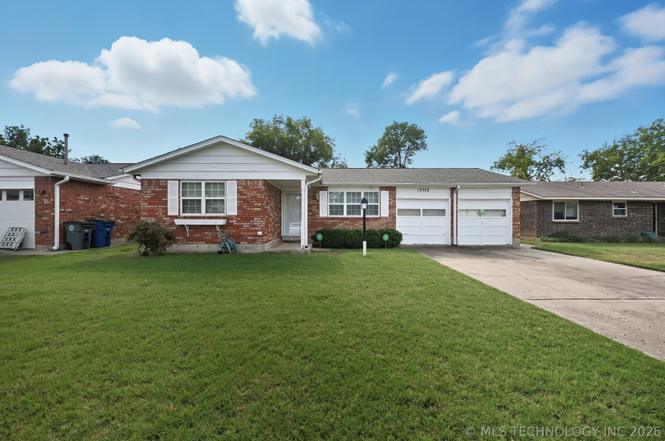
12308 E 18th St · Tulsa, OK
Flood risk 3/10 · Minor
- FEMA flood zone
- X (unshaded)
- Chance of flooding over 30 yrs
- 0.2%
- Est. flood insurance / yr
- $473 – $860
Fire risk 4/10 · Minor
- Est. fire insurance / yr
- $2,463 – $4,575
Heat risk 7/10 · Major
- Hot days now (above 110°F)
- 7 days/yr
- Hot days in 30 yrs
- 18 days/yr
Wind risk 2/10 · Minimal
- Chance of severe wind over 30 yrs
- 4.0%
Air-quality risk 2/10 · Minimal
- Unhealthy air days now
- 1 days/yr
- Unhealthy air days in 30 yrs
- 1 days/yr
Risk factors via First Street. Map © Google.
Why this score? — see what drove the D- grade
The composite is a weighted blend of 9 inputs, each scored 0–100. Each bar is that input's sub-score; the figure is the points it added to the 100-point composite (weight × sub-score).
- Cash flow +17.8/30.0
- DSCR +5.6/10.0
- 1% rule +3.8/10.0
- Livability +3.8/5.0
- Rent growth +2.5/5.0
- Condition / age +2.5/5.0
- Schools +0.8/10.0
- ARV discount +0.0/15.0
- Appreciation +0.0/10.0
$182,500
🖨 Deal sheet (PDF) 📄 Offer letter ✓ Due diligence
Listing remarks
MAKE-OVER MAGIC-Don't snooze on this cutie! Interior has been completely refreshed with new paint, changing the outdated 80's look to a contemporary, move-in ready home. Exterior paint has been updated along with some fixtures, exterior door and other repairs. Original custom touches remain, including thoughtfully designed built-in shelving that maximizes storage and adds character to every room. Impossible to find, the 18ft x 22 ft workshop with AC is perfect for hobbies, woodworking or extra storage. Inside, above-ground storm shelter provides peace of mind year round. With its functional floor plan, master suite with 1/2 bath and prime location close to schools and shopping, this is a gr
Key facts
- 18ft x 22ft workshop
- Split-bedroom layout
- Storm shelter
Tags
Neighborhood map
What this means for you Summary
Snapshot
- This is a 4-bed/1.0-bath single-family listed at $182k.
Deal economics
- At list price, monthly cash flow is $151 ($2k/yr) — positive.
- The deal already cash-flows at list — no discount required.
- To meet the 1% rule (rent ≥ 1% of price), the offer needs to be $160k (12.4% below list).
- Recommended offer: $160k (12.4% below list) — sets the bar for 1% rule.
- Cap rate 7.3% vs local median 3.8% in Tulsa — top-decile yield for the area; either an underpriced asset or a hidden risk that comps aren't pricing in. Stress-test before assuming the spread holds.
Location & tenants
- Location reads 75/100 on livability (#13 in OK, #4,058 nationally) — a middle-class / working-renter tenant base. Strengths: amenities A+, commute A+, cost of living A+; Watch: crime F, employment D-.
- Tulsa (urban): math 7% / reading 12% proficiency, ranked #250 of 270 in OK (top 93%) — low school quality limits family demand, transient renter base, plan for 1-2y turnover; 76% free/reduced lunch — lower-income household profile, screen leases tightly.
- Zoned schools: Project Accept Traice Es (math 10% / reading 10%, grade F, #695 of 845 statewide, top 84%, 558 students, 0% FRL); Monroe Demonstration Ms (math 0% / reading 2%, grade F, #344 of 345 statewide, top 100%, 688 students, 0% FRL); Booker T. Washington Hs (math 41% / reading 61%, grade D+, #2 of 447 statewide, top 0%, 1,280 students, 0% FRL) — zoned schools average 0% FRL vs 76% district-wide (76 pts lower); this property's tenant base skews higher-income than the district average.
- Market conditions: 38 active listings in the ZIP; 8 comparable units currently listed for rent nearby; rentals at typical pace (median 21d on market — plan ~3-4 weeks tenant-placement turnaround); 2,818 units permitted in Tulsa County in 2024 (518 in 5+ unit buildings).
- This rent runs 37% of the median local income ($52k/yr) — at the standard rent-burdened threshold; future hikes will face affordability resistance.
Forward outlook
- Local home prices are declining (-3.0%/yr); year-one equity from $1k of loan paydown is wiped out by about $5k of value loss. Plan a longer hold.
- Tulsa County population projected at +30% by 2050 — long-run rental-demand tailwind backs the buy-and-hold thesis.
Negotiation context
- It's been on market 173 days — a 12% lower offer ($161k) is reasonable based on typical stale-listing flexibility.
Risks & watch-outs
- Climate carrying-cost: extreme-heat days projected 7→18/yr by 2055 (HVAC capex compounding) — expect insurance premiums to compound above CPI over the hold.
Questions for the listing agent
- It's been on market 173 days. Have you received any prior offers? Is the seller open to a 12% concession, seller financing, or rate buy-down credit?
- Built in 1970 — when were the roof, HVAC, electrical panel, plumbing, and water heater last replaced?
- Why hasn't it sold? Are there any deal-killer items the seller is aware of (foundation, flood, title, zoning, code violations)?
- Is there a deadline driving the sale (1031 exchange, divorce, estate, relocation)? That informs how much negotiation room exists.
- Schools are F-rated, which usually means shorter tenancies and higher turnover. Who's the typical renter profile here, and what's been the actual vacancy rate?
- Crime grade is F in this area — have there been break-ins, vandalism, or insurance claims at this property in the last 3 years? What carrier currently insures it and at what premium?
- The area grade is low — what's the realistic commute time and amenity access for the typical tenant pool here? Any planned neighborhood developments (good or bad) we should know about?
- What's the average days-on-market for RENTAL listings here right now (not sales)? A rising rental-DOM trend means longer vacancies and softer asking-rent achievability than the comps imply.
- What's the recent tenant-quality profile in this submarket — average credit score on applications, eviction rate, late-payment / NSF rate, and stable-employment percentage? A property-management company in the area should have these aggregated.
- How much new for-sale + rental construction is in the pipeline within 1–3 miles? Heavy new supply typically softens prices + rents 12–24 months out; constrained supply supports both.
Investment metrics
- 1% rule
- 0.88% ✗
- Cap rate
- 7.29%
- Cash-on-cash
- 3.55%
- DSCR
- 1.16
- GRM
- 9.5
CMA / ARV
- ARV (on-the-fly)
- $151,435
- Comps found
- 12
Show comp detail 12 sales within ~0.75 mi
| Address | Dist | Beds/Ba | Sqft | Sold | Price | $/sf | Match |
|---|---|---|---|---|---|---|---|
| 2141 S 120th East Ave | 0.36mi | 3/1.0 (-1) | 1,040 (+6%) | 2mo | $175,000 | $168 | 66 |
| 2206 S 131st East Ave | 0.62mi | 3/1.0 (-1) | 980 (+0%) | 1mo | $180,000 | $184 | 65 |
| 12442 E 13th Pl | 0.47mi | 3/1.0 (-1) | 1,018 (+4%) | 2mo | $164,400 | $161 | 64 |
| 2217 S 128th East Pl | 0.51mi | 3/2.0 (-1) | 1,034 (+6%) | 2mo | $112,132 | $108 | 56 |
| 2403 S 124th EastAvenue | 0.50mi | 3/1.5 (-1) | 1,068 (+9%) | 3mo | $160,000 | $150 | 52 |
| 1824 S 119th EastAvenue | 0.30mi | 3/2.0 (-1) | 1,123 (+15%) | 0mo | $174,000 | $155 | 52 |
| 2203 S 124th EastAvenue | 0.40mi | 3/1.5 (-1) | 1,100 (+13%) | 3mo | $185,000 | $168 | 51 |
| 12620 S 127th Ave E | 0.52mi | 3/1.0 (-1) | 874 (-10%) | 2mo | $86,500 | $99 | 51 |
| 12444 E 13th St | 0.54mi | 3/1.0 (-1) | 1,092 (+12%) | 2mo | $115,000 | $105 | 48 |
| 12820 E 14th St | 0.48mi | 3/1.0 (-1) | 1,108 (+13%) | 2mo | $160,000 | $144 | 48 |
| 2509 S 126th East Ave | 0.61mi | 3/1.0 (-1) | 876 (-10%) | 2mo | $160,000 | $183 | 48 |
| 12520 E 25th St | 0.61mi | 3/1.0 (-1) | 1,082 (+11%) | 2mo | $155,000 | $143 | 47 |
Match score weights: distance 35% · size 25% · config 20% · recency 20%. Top-matched comps best support the ARV.
Projected returns pro-forma
-3.0% appreciation · 3.0% rent growth · sell at horizon
- IRR
- -10.8%
- Equity multiple
- 0.61×
- Total profit
- $-20,010
- Equity at exit
- $27,211
- IRR
- -1.5%
- Equity multiple
- 0.90×
- Total profit
- $-5,298
- Equity at exit
- $15,779
Cash invested: $51,100 (down + closing). Projections, not guarantees.
Landlord ↔ Tenant lean methodology
- Overall (STATE)
- 83 Strongly Landlord-Friendly
- State Oklahoma
- 83 Strongly Landlord-Friendly · R+20
- County
- — inherits STATE
- City
- — inherits STATE
ZIP-level market 74128
- Home prices YoY
- -21.6%
- Active inventory
- 38
- Price-to-rent
- 9.5×
Monthly cashflow live
- Estimated rent
- $1,600 high interval (Pro) →
- Mortgage (P&I)
- −$957
- Tax from tax record
- −$79 /mo · $952/yr
- Insurance
- −$76
- HOA
- −$0
- Vacancy / Maint / Mgmt
- −$336
- Net cashflow
- $151
Break-even live
Sensitivity live
| Price | -10% $255 | -5% $203 | +0% $151 | +5% $100 | +10% $48 |
|---|---|---|---|---|---|
| Rent | -10% $25 | -5% $88 | +0% $151 | +5% $214 | +10% $278 |
| Rate | -1.0pp $243 | -0.5pp $198 | base $151 | +0.5pp $104 | +1.0pp $56 |
UW: 25.0% down · 7.5% · 30yr · 1.5% tax · 5.0% vac · 8.0% maint · 8.0% mgmt
Financing live
Cash to close
- Down payment
- $45,625
- Closing costs
- $5,475
- Reserves months
- —
- Total cash needed
- —
Loan-product check · same deal, 3 products live
Conventional
25% down · 7.5% · 30yr
- Down + closing
- —
- Monthly P&I
- —
- Monthly cashflow
- —
- DSCR
- —
- Eligible?
- —
Personal DTI + credit; lowest rate.
DSCR
20% down · 8.5% · 30yr
- Down + closing
- —
- Monthly P&I
- —
- Monthly cashflow
- —
- DSCR
- —
- Eligible?
- —
No personal income docs; deal must DSCR.
Hard money
10% down · 12.0% · 12mo
- Down + closing
- —
- Monthly P&I
- —
- Monthly cashflow
- —
- DSCR
- —
- Eligible?
- —
Short-term bridge; refi at stabilization.
Rent comps 8 comps
| Address | Beds | Baths | Sqft | Rent | $/sqft | DOM | Units | Dist |
|---|---|---|---|---|---|---|---|---|
| 1801 S 132nd East Pl Tulsa, OK | 2.0–3.0 | 1.0–2.0 | 950 | $1,499 | $1.58 | 3d | 4 | 0.42mi |
| 1801 S 132nd East Pl Tulsa, OK | 2.0–3.0 | 1.5–2.0 | 975 | $1,439 | $1.48 | 23d | 4 | 0.42mi |
| 2319 S 119th East Ave Tulsa, OK | 3.0 | 1.0 | 990 | $1,365 | $1.38 | 25d | 1 | 0.54mi |
| 1433 S 107th East Ave Tulsa, OK | 1.0–3.0 | 1.0–1.5 | 840 | $1,199 | $1.43 | 21d | 3 | 0.98mi |
| 2336 S 137th East Ave Tulsa, OK | 1.0–3.0 | 1.0–2.0 | 1080 | $1,499 | $1.39 | 3d | 1 | 1.03mi |
| 2756 S 114th East Ave Tulsa, OK | 3.0 | 2.0 | 1120 | $1,650 | $1.47 | 25d | 1 | 1.07mi |
| 1645 S 101st East Ave Tulsa, OK | 1.0–3.0 | 1.0–2.0 | 1013 | $1,899 | $1.87 | 4d | 35 | 1.34mi |
| 10124 E 22nd St Tulsa, OK | 3.0 | 2.0 | 1117 | $1,350 | $1.21 | 16d | 1 | 1.36mi |
Listing history 6 events
-
2026-04-08status Pending
-
2026-04-02price $182,500
-
2026-03-13price $184,900
-
2026-01-29price $189,900
-
2025-11-03price $195,000
-
2025-10-17$216,500 Active
ⓘ Source: listings_history table (triggers on properties + properties_extension) + one-shot
backfill from property_details.listing_events for pre-trigger history.
Tax reassessment forecast OK · Resets to sale price
- Current annual tax
- $952 · $79/mo
- Projected year-2 tax
- $1,642 · $137/mo
- Expected delta
- +$690/yr (+$58/mo · 72.5%)
ⓘ Screening estimate from a state-policy table — verify with the county assessor before closing.
Climate risk First Street
- Flood 3/10 Moderate FEMA zone X (unshaded) · 20% chance over 30 yrs
- Wildfire 4/10 Moderate
- Heat 7/10 Severe 7 d/yr ≥110°F today · 18 d/yr by 30 yrs out
- Wind 2/10 Low 4% chance of damaging wind over 30 yrs
- Air quality 2/10 Low 1 unhealthy d/yr today · 1 by 30 yrs out
Nearby sold comps map
Loading sold comps map…
Walkable amenities ~0.75 mi
Loading nearby amenities…
Taxation est. · year 1
- Rental income
- $19,194
- − Mortgage interest
- −$10,223
- − Property taxes
- −$952
- − Insurance
- −$912
- − Repairs & maintenance
- −$1,536
- − Management
- −$1,536
- − Depreciation
- −$5,309
- Taxable loss
- −$1,273
- Est. tax savings @ 24.0%
- +$306
- After-tax cash flow
- $2,120/yr
For passive investors: Depreciation is non-cash, so a rental often shows a tax loss while cash-flowing — sheltering income. Rental losses are passive: they offset passive income freely, and up to $25,000/yr can offset ordinary (W-2) income if you actively participate and your MAGI is under $100k (phasing out to $0 by $150k); unused losses carry forward. On sale, claimed depreciation is recaptured at up to 25%, and gains may owe capital-gains tax (a 1031 exchange can defer both). Figures are a year-1 estimate at your 24.0% rate — not tax advice; consult a CPA.
Schools (NCES district)
- District
- Tulsa
- NCES district ID
- 4030240
- Math proficiency
- 7% ▼ -9.00%
- Reading proficiency
- 12% ▼ -7.00%
- Median HH income
- $37,895
- Composite
- 8.04/100
- National rank
- #9919
- State rank
- #250 of 270 in OK
Livability — Tulsa
- Score
- 75/100
- State rank
- #13
- US rank
- #4058
Category grades
Schools grade is shown separately in the Schools card above.
Census & demographics
- Census place
- Tulsa, OK
- County
- Tulsa County · 640,811 people
- City population
- 389,418
- Metro
- Tulsa, OK
- Population (ZIP)
- 13,751
- Household income
- $52,195
- Rent vs Own
- Severe rent burden
- 382.0
Population outlook (Tulsa County) Hauer SSP2
- Today (2025)
- 723,846 people
- By 2030
- 766,033 · +5.8%
- By 2040
- 851,386 · +17.6%
- By 2050
- 938,389 · +29.6%
- By 2075
- 1,166,011 · +61.1%
- By 2100
- 1,350,277 · +86.5%
Race, ethnicity, and origin ACS 2023
- Neighborhood character
- Diverse neighborhood (Simpson 0.69)
- Race & ethnicity
- Hispanic / Latino 39% White 38% Two or more races 23% Black 10% Asian 4% Native American 4%
- Hispanic origin (detail)
- Mexican 32%
- Common ancestry
- Italian 1% Slovak 1% Romanian 1%
- Foreign-born
- 19% · Canada
- Languages at home
- 59% English-only · Spanish 36% Other Asian/Pacific 2% Other Indo-European 1%
Political lean MEDSL · Tulsa
- 2024 margin
- R (+15.2) · D 41.3% · R 56.5% · Other 2.2%
- 2008→2024 swing
- +9.2pp toward D · 2008: -24.5pp · 2024: -15.2pp
- All cycles
- 2024: R+15.2 2020: R+15.6 2016: R+22.9 2012: R+27.4 2008: R+24.5
Not yet ingested
- Civics
- —
Market trends
- HPI YoY
- ▼ -66.16%
- Current HPI
- 240.6763
- Rent YoY
- —
- Metro
- Tulsa, OK
- State GDP YoY
- ▲ 1.55%
- F500 in state
- 6
Industry mix (Fortune 500 HQ in OK)
| Industry | F500 HQs | Revenue |
|---|---|---|
| Energy | 3 | $48B |
|
||
Price history
-15.7% since first listed6 events — show timeline
- 2026-04-08 Pending — MLS Technology, Inc.
- 2026-04-02 Price Changed $182,500 MLS Technology, Inc.
- 2026-03-13 Price Changed $184,900 MLS Technology, Inc.
- 2026-01-29 Price Changed $189,900 MLS Technology, Inc.
- 2025-11-03 Price Changed $195,000 MLS Technology, Inc.
- 2025-10-17 Listed $216,500 MLS Technology, Inc.
Property tax history
+0.4%/yrLatest (2025): $952 · +3.5% YoY. Source: county tax records.
Cash-flow waterfall
monthlySold comps — $/sqft
last 12 mo · ≤1 miLoading sold comps…