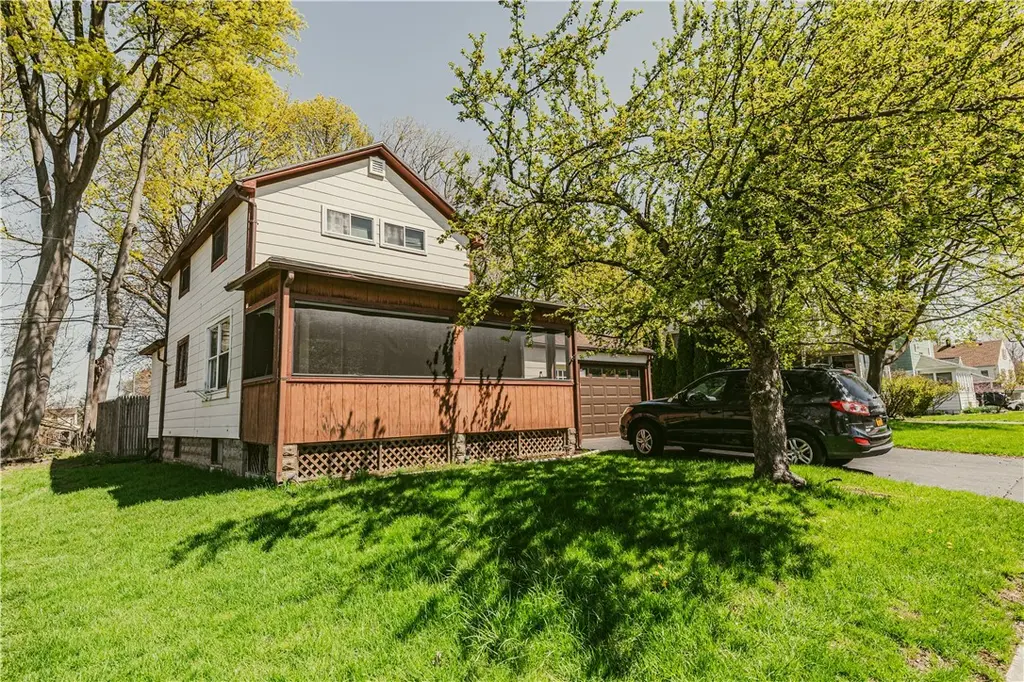
474 Lake Shore Boulevard Ext · Irondequoit, NY
Flood risk 1/10 · Minimal
- FEMA flood zone
- X (unshaded)
- Chance of flooding over 30 yrs
- 0.0%
- Est. flood insurance / yr
- $473 – $860
Fire risk 3/10 · Minor
- Est. fire insurance / yr
- $691 – $1,283
Heat risk 2/10 · Minimal
- Hot days now (above 95°F)
- 7 days/yr
- Hot days in 30 yrs
- 16 days/yr
Wind risk 1/10 · Minimal
- Chance of severe wind over 30 yrs
- —
Air-quality risk 2/10 · Minimal
- Unhealthy air days now
- 1 days/yr
- Unhealthy air days in 30 yrs
- 2 days/yr
Risk factors via First Street. Map © Google.
Why this score? — see what drove the B+ grade
The composite is a weighted blend of 9 inputs, each scored 0–100. Each bar is that input's sub-score; the figure is the points it added to the 100-point composite (weight × sub-score).
- Cash flow +27.0/30.0
- ARV discount +15.0/15.0
- 1% rule +9.8/10.0
- DSCR +9.3/10.0
- Schools +6.2/10.0
- Livability +4.0/5.0
- Rent growth +2.5/5.0
- Condition / age +2.5/5.0
- Appreciation +0.0/10.0
$124,900
🖨 Deal sheet (PDF) 📄 Offer letter ✓ Due diligence
Listing remarks MLS
CUTE SUMMERVILLE BUNGALOW! W IROND FOR UNDER $80,000. LOW, LOW TAXES! THIS HOME IS JUST A MINTUES WALK TO THE LAKE. HURRY, SUMMER IS JUST AROUND THE CORNER!
Key facts
- Large back deck
- Formal dining room
- Screened-in porch
Tags
Property features AI
Exterior
- Parking: Attached garage; 2 garage spaces; Driveway parking
- Utilities: Public water connected; Sewer connected; Electric service with circuit breakers
- Home design: 2-story house; Existing (previously built) property; Irregular residential lot on a city street; Lot dimensions approximately 68 x 72
- Construction: Cedar and composite siding; Block foundation
- Exterior features: Blacktop driveway; Deck (including screened); Porch; Partial fencing; Shed(s)/storage
Interior
- Kitchen: Gas oven; Gas range; Microwave; Dishwasher; Refrigerator; Eat-in kitchen
- Flooring: Carpet; Ceramic tile; Hardwood; Varied flooring
- Bathrooms: 1 full bathroom
- Heating & cooling: Heat pump (cooling); Heat pump and gas heating; Hot water heating; Circuit breaker electric
- Interior features: Leaded glass windows; Sliding doors / sliding glass door(s); Separate/formal dining room; Separate/formal living room; Eat-in kitchen
- Laundry & utility: Washer and dryer; Laundry located in basement; Gas water heater
Neighborhood map
What this means for you Summary
Snapshot
- This is a 3-bed/1.0-bath single-family listed at $125k.
Deal economics
- At list price, monthly cash flow is $348 ($4k/yr) — positive.
- The deal already cash-flows at list — no discount required.
- Meets the 1% rule at list price ($2k rent vs $125k).
- Cap rate 9.6% vs local median 4.5% in Irondequoit — top-decile yield for the area; either an underpriced asset or a hidden risk that comps aren't pricing in. Stress-test before assuming the spread holds.
Location & tenants
- Location reads 81/100 on livability (#92 in NY, #1,414 nationally) — a professional / high-income tenant draw. Strengths: housing A+, health & safety A+, crime B+; Watch: amenities F.
- West Irondequoit Central School District (suburban): math 73% / reading 70% proficiency, ranked #126 of 590 in NY (top 21%) — strong family-tenant draw, lease renewals of 3-5y typical; only 18% free/reduced lunch — higher-income household profile.
- Zoned schools: Irondequoit High School (math 96% / reading 64%, grade A, #509 of 1,100 statewide, top 46%, 1,163 students, 33% FRL).
- Market conditions: 104 active listings in the ZIP; 2 comparable units currently listed for rent nearby; solid renter incomes; 1,169 units permitted in Monroe County in 2024 (591 in 5+ unit buildings).
Forward outlook
- Local home prices are declining (-3.0%/yr); year-one equity from $864 of loan paydown is wiped out by about $4k of value loss. Plan a longer hold.
- Monroe County population projected to shrink 6% by 2050 — rents likely to lag national; underwrite the cash flow, not the appreciation.
- At projected returns (-3.0% appreciation + 3.0% rent growth), your $35k cash investment doubles in ~10 years — after that, you're playing with house money.
Negotiation context
- Only 6 days on market — expect competitive offers; lowballing is unlikely to land.
- 2 sale attempts since 16y ago with the ask held roughly flat each time — persistent listings suggest the price (not the market) is what's stuck; bring a comps-based counter.
- Current owner paid $75k; list at $125k implies a 67% gain — meaningful room to come down on a strong offer.
Risks & watch-outs
- Watch-outs: property tax is 3.9% of price; built in 1925 — expect roof / HVAC / electrical / plumbing capex.
Questions for the listing agent
- Built in 1925 — when were the roof, HVAC, electrical panel, plumbing, and water heater last replaced?
- Property tax is high relative to price — has the assessment been appealed recently, and will the sale trigger a re-assessment?
- Is there a deadline driving the sale (1031 exchange, divorce, estate, relocation)? That informs how much negotiation room exists.
- Schools are B-rated — typically a magnet for longer-tenancy family renters. What's the average tenant stay here, and is there a school-zone premium baked into asking?
- What's the average days-on-market for RENTAL listings here right now (not sales)? A rising rental-DOM trend means longer vacancies and softer asking-rent achievability than the comps imply.
- What's the recent tenant-quality profile in this submarket — average credit score on applications, eviction rate, late-payment / NSF rate, and stable-employment percentage? A property-management company in the area should have these aggregated.
- How much new for-sale + rental construction is in the pipeline within 1–3 miles? Heavy new supply typically softens prices + rents 12–24 months out; constrained supply supports both.
Investment metrics
- 1% rule
- 1.48% ✓
- Cap rate
- 9.64%
- Cash-on-cash
- 11.94%
- DSCR
- 1.53
- GRM
- 5.6
CMA / ARV
- ARV (on-the-fly)
- $182,016
- Comps found
- 12
Show comp detail 12 sales within ~0.75 mi
| Address | Dist | Beds/Ba | Sqft | Sold | Price | $/sf | Match |
|---|---|---|---|---|---|---|---|
| 587 Washington Ave | 0.11mi | 3/1.0 | 936 (-1%) | 21mo | $120,000 | $128 | 75 |
| 283 Pattonwood Dr | 0.16mi | 2/1.0 (-1) | 935 (-1%) | 14mo | $205,000 | $219 | 73 |
| 306 Norcrest Dr | 0.33mi | 3/1.5 | 988 (+4%) | 10mo | $190,000 | $192 | 67 |
| 77 Parkview Ter | 0.29mi | 2/1.0 (-1) | 880 (-7%) | 3mo | $220,000 | $250 | 67 |
| 832 Washington Ave | 0.31mi | 2/1.0 (-1) | 1,001 (+6%) | 6mo | $200,000 | $200 | 66 |
| 18 Beach Ter | 0.29mi | 2/1.0 (-1) | 928 (-2%) | 20mo | $165,000 | $178 | 61 |
| 388 Eaton Rd | 0.19mi | 2/1.5 (-1) | 1,046 (+10%) | 7mo | $187,000 | $179 | 61 |
| 500 Lake Shore Boulevard Ext | 0.03mi | 2/1.0 (-1) | 822 (-13%) | 13mo | $143,000 | $174 | 60 |
| 54 Oaklawn Dr | 0.24mi | 3/1.5 | 1,072 (+13%) | 11mo | $260,000 | $243 | 56 |
| 9 2nd St | 0.51mi | 2/1.0 (-1) | 944 (-0%) | 21mo | $142,000 | $150 | 53 |
| 29 Centre Ter | 0.37mi | 2/1.0 (-1) | 808 (-15%) | 13mo | $165,000 | $204 | 42 |
| 94 Shorewood Dr | 0.51mi | 3/1.5 | 1,062 (+12%) | 19mo | $201,000 | $189 | 38 |
Match score weights: distance 35% · size 25% · config 20% · recency 20%. Top-matched comps best support the ARV.
Projected returns pro-forma
-3.0% appreciation · 3.0% rent growth · sell at horizon
- IRR
- 1.6%
- Equity multiple
- 1.06×
- Total profit
- $2,100
- Equity at exit
- $18,623
- IRR
- 11.3%
- Equity multiple
- 1.89×
- Total profit
- $31,101
- Equity at exit
- $10,799
Cash invested: $34,972 (down + closing). Projections, not guarantees.
Landlord ↔ Tenant lean methodology
- Overall (STATE)
- 15 Strongly Tenant-Friendly
- State New York
- 15 Strongly Tenant-Friendly · D+10
- County
- — inherits STATE
- City
- — inherits STATE
ZIP-level market 14617
- Active inventory
- 104
- Price-to-rent
- 5.6×
Monthly cashflow live
- Estimated rent
- $1,851 medium interval (Pro) →
- Mortgage (P&I)
- −$655
- Tax from tax record
- −$407 /mo · $4,889/yr
- Insurance
- −$52
- HOA
- −$0
- Lot rent
- −$0
- Vacancy / Maint / Mgmt
- −$389
- Net cashflow
- $348
Break-even live
Sensitivity live
| Price | -10% $419 | -5% $383 | +0% $348 | +5% $313 | +10% $277 |
|---|---|---|---|---|---|
| Rent | -10% $202 | -5% $275 | +0% $348 | +5% $421 | +10% $494 |
| Rate | -1.0pp $411 | -0.5pp $380 | base $348 | +0.5pp $316 | +1.0pp $283 |
UW: 25.0% down · 7.5% · 30yr · 1.5% tax · 5.0% vac · 8.0% maint · 8.0% mgmt
Financing live
Cash to close
- Down payment
- $31,225
- Closing costs
- $3,747
- Reserves months
- —
- Total cash needed
- —
Loan-product check · same deal, 3 products live
Conventional
25% down · 7.5% · 30yr
- Down + closing
- —
- Monthly P&I
- —
- Monthly cashflow
- —
- DSCR
- —
- Eligible?
- —
Personal DTI + credit; lowest rate.
DSCR
20% down · 8.5% · 30yr
- Down + closing
- —
- Monthly P&I
- —
- Monthly cashflow
- —
- DSCR
- —
- Eligible?
- —
No personal income docs; deal must DSCR.
Hard money
10% down · 12.0% · 12mo
- Down + closing
- —
- Monthly P&I
- —
- Monthly cashflow
- —
- DSCR
- —
- Eligible?
- —
Short-term bridge; refi at stabilization.
Rent comps 2 comps
| Address | Beds | Baths | Sqft | Rent | $/sqft | DOM | Units | Dist |
|---|---|---|---|---|---|---|---|---|
| 123 Spanish Trl Rochester, NY | 1.0–2.0 | 1.0–1.5 | 945 | $1,775 | $1.88 | 5d | 1 | 1.10mi |
| 3677 Lake Ave Rochester, NY | 2.0 | 1.0 | 1088 | $1,200 | $1.10 | 46d | 1 | 1.39mi |
Listing history 5 events
-
2026-05-06status Pending
-
2026-04-30$124,900 Active
-
2010-05-28soldstatus $74,800 156-char remark
Show marketing remark (156 chars)
CUTE SUMMERVILLE BUNGALOW! W IROND FOR UNDER $80,000. LOW, LOW TAXES! THIS HOME IS JUST A MINTUES WALK TO THE LAKE. HURRY, SUMMER IS JUST AROUND THE CORNER!
-
2010-05-21soldstatus $74,800
-
2010-03-19$79,900 156-char remark
Show marketing remark (156 chars)
CUTE SUMMERVILLE BUNGALOW! W IROND FOR UNDER $80,000. LOW, LOW TAXES! THIS HOME IS JUST A MINTUES WALK TO THE LAKE. HURRY, SUMMER IS JUST AROUND THE CORNER!
ⓘ Source: listings_history table (triggers on properties + properties_extension) + one-shot
backfill from property_details.listing_events for pre-trigger history.
Tax reassessment forecast NY · Partial reset (capped growth)
- Current annual tax
- $4,889 · $407/mo
- Projected year-2 tax
- $4,889 · $407/mo
- Expected delta
- $0/yr ($0/mo · 0.0%)
ⓘ Screening estimate from a state-policy table — verify with the county assessor before closing.
Climate risk First Street
- Flood 1/10 Low FEMA zone X (unshaded) · 0% chance over 30 yrs
- Wildfire 3/10 Moderate
- Heat 2/10 Low 7 d/yr ≥95°F today · 16 d/yr by 30 yrs out
- Wind 1/10 Low
- Air quality 2/10 Low 1 unhealthy d/yr today · 2 by 30 yrs out
Nearby sold comps map
Loading sold comps map…
Walkable amenities ~0.75 mi
Loading nearby amenities…
Taxation est. · year 1
- Rental income
- $22,213
- − Mortgage interest
- −$6,996
- − Property taxes
- −$4,889
- − Insurance
- −$624
- − Repairs & maintenance
- −$1,777
- − Management
- −$1,777
- − Depreciation
- −$3,633
- Taxable income
- $2,515
- Est. tax owed @ 24.0%
- −$604
- After-tax cash flow
- $3,571/yr
For passive investors: Depreciation is non-cash, so a rental often shows a tax loss while cash-flowing — sheltering income. Rental losses are passive: they offset passive income freely, and up to $25,000/yr can offset ordinary (W-2) income if you actively participate and your MAGI is under $100k (phasing out to $0 by $150k); unused losses carry forward. On sale, claimed depreciation is recaptured at up to 25%, and gains may owe capital-gains tax (a 1031 exchange can defer both). Figures are a year-1 estimate at your 24.0% rate — not tax advice; consult a CPA.
Schools (NCES district)
- District
- West Irondequoit Central School District
- NCES district ID
- 3615390
- Math proficiency
- 73% ▲ 3.00%
- Reading proficiency
- 70% ▲ 5.00%
- Median HH income
- $60,218
- Composite
- 61.61/100
- National rank
- #748
- State rank
- #126 of 590 in NY
Livability — Irondequoit
- Score
- 81/100
- State rank
- #92
- US rank
- #1414
Category grades
Schools grade is shown separately in the Schools card above.
Census & demographics
- Census place
- Irondequoit, NY
- County
- Monroe County · 674,131 people
- City population
- 74,252
- Metro
- Rochester, NY
- Population (ZIP)
- 21,788
- Household income
- $90,192
- Rent vs Own
- Severe rent burden
- 426.0
Population outlook (Monroe County) Hauer SSP2
- Today (2025)
- 759,460 people
- By 2030
- 757,154 · -0.3%
- By 2040
- 740,644 · -2.5%
- By 2050
- 714,443 · -5.9%
- By 2075
- 645,883 · -15.0%
- By 2100
- 547,084 · -28.0%
Race, ethnicity, and origin ACS 2023
- Neighborhood character
- Predominantly White (85%)
- Race & ethnicity
- White 85% Hispanic / Latino 8% Two or more races 6% Black 4%
- Hispanic origin (detail)
- Puerto Rican 4%
- Common ancestry
- Romanian 6% Iranian 3% Lithuanian 3%
- Foreign-born
- 4% · Canada
- Languages at home
- 93% English-only · Spanish 4% Other Indo-European 1% Russian/Polish/Slavic 1%
Political lean MEDSL · Monroe
- 2024 margin
- D (+19.1) · D 59.5% · R 40.5%
- 2008→2024 swing
- +1.4pp toward D · 2008: 17.7pp · 2024: 19.1pp
- All cycles
- 2024: D+19.1 2020: D+21.0 2016: D+14.1 2012: D+17.4 2008: D+17.7
Not yet ingested
- Civics
- —
Market trends
- HPI YoY
- ▼ -148.22%
- Current HPI
- 263.9973
- Rent YoY
- —
- Metro
- Rochester, NY
- State GDP YoY
- ▲ 2.60%
- F500 in state
- 92
Industry mix (Fortune 500 HQ in NY)
| Industry | F500 HQs | Revenue |
|---|---|---|
| Financial Services | 10 | $950B |
|
||
| Consumer Goods | 9 | $162B |
|
||
| Insurance | 4 | $225B |
|
||
| Telecommunications | 2 | $144B |
|
||
| Pharmaceuticals | 2 | $112B |
|
||
| Media / Entertainment | 2 | $69B |
|
||
Price history
+56.3% since first listed5 events — show timeline
- 2026-05-06 Pending — UNYREIS
- 2026-04-30 Listed $124,900 UNYREIS
- 2010-05-28 Sold (MLS) $74,800 UNYREIS
- 2010-05-21 Sold (Public Records) $74,800 Public Records
- 2010-03-19 Listed $79,900 UNYREIS
Property tax history
+3.3%/yrLatest (2025): $4,889 · +60.8% YoY. Source: county tax records.
Cash-flow waterfall
monthlySold comps — $/sqft
last 12 mo · ≤1 miLoading sold comps…