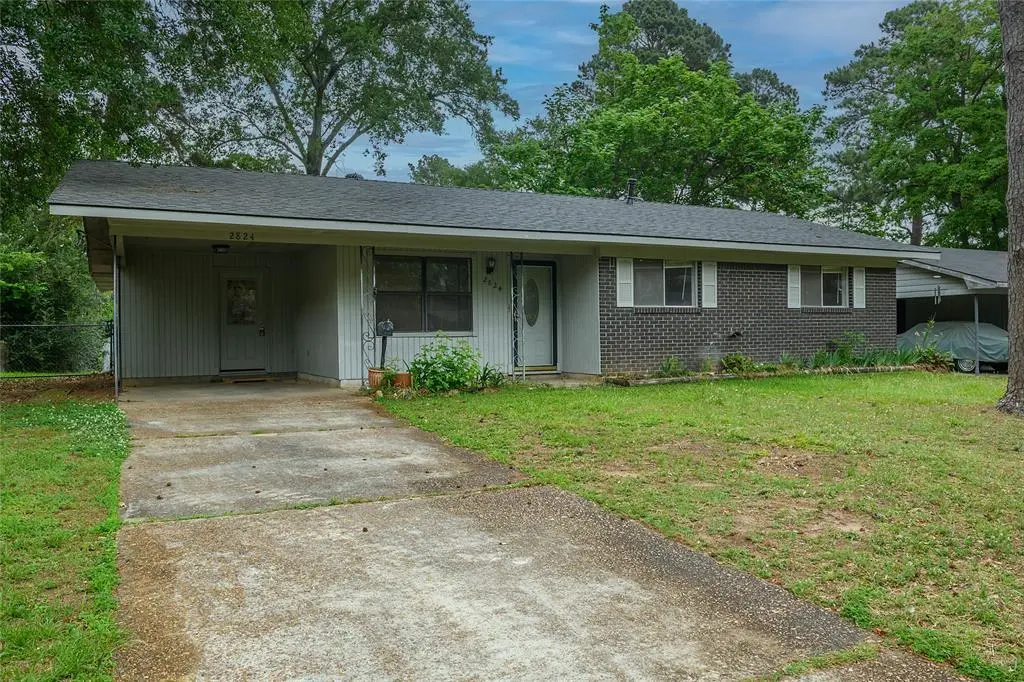
2824 Alkay Dr · Shreveport, LA
Flood risk 1/10 · Minimal
- FEMA flood zone
- X (unshaded)
- Chance of flooding over 30 yrs
- 0.0%
- Est. flood insurance / yr
- $507 – $1,088
Fire risk 2/10 · Minimal
- Est. fire insurance / yr
- $1,269 – $2,357
Heat risk 7/10 · Major
- Hot days now (above 110°F)
- 7 days/yr
- Hot days in 30 yrs
- 22 days/yr
Wind risk 6/10 · Moderate
- Chance of severe wind over 30 yrs
- 68.0%
Air-quality risk 2/10 · Minimal
- Unhealthy air days now
- 1 days/yr
- Unhealthy air days in 30 yrs
- 1 days/yr
Risk factors via First Street. Map © Google.
Why this score? — see what drove the C- grade
The composite is a weighted blend of 9 inputs, each scored 0–100. Each bar is that input's sub-score; the figure is the points it added to the 100-point composite (weight × sub-score).
- Cash flow +20.2/30.0
- ARV discount +9.4/15.0
- DSCR +6.4/10.0
- 1% rule +4.7/10.0
- Livability +3.0/5.0
- Rent growth +2.9/5.0
- Condition / age +2.5/5.0
- Schools +2.2/10.0
- Appreciation +0.0/10.0
$147,500
🖨 Deal sheet 📄 Offer letter ✓ Due diligence
Listing remarks
Well maintained home in a quiet subdivision. 4 bedrooms and 2 full baths with a large utility room office off of the eat in kitchen. An addition of a primary bedroom and bath with a walk in closet makes this a little different from all the other homes in the neighborhood. This is one you should see right away as it will go quickly. Make your appointment today.
Key facts
- 1 acre lot
- Parking
- Built 1969
Property features AI
Finance
- Other: Probate listing; Will not subdivide
- Financial info: Treat as clear loan type; No second mortgage
- HOA & community: No homeowners association; Community sidewalks
Exterior
- Parking: Attached carport; Covered parking (1); 1 carport space
- Utilities: City water; City sewer; Individual gas meter; Individual water meter; Asphalt roads/drive; Curbs; Cable available; Phone available; Not in a municipal utility district
- Home design: Single family residence; One story; Residential property; Built in 1969
- Construction: Brick construction; Composition roof; Slab foundation
- Exterior features: Back yard fencing; Chain link fence; Sidewalks
Interior
- Kitchen: Built-in cabinets; Corian-type countertops; Dishwasher; Gas cooktop; Gas oven; Refrigerator
- Bedrooms: 4 bedrooms (all on main level); Primary bedroom with ensuite bath and walk-in closet
- Flooring: Carpet; Ceramic tile; Linoleum; Wood
- Bathrooms: 2 full bathrooms; Bathroom(s) with tile counters
- Heating & cooling: Central heating; Central air; Electric heating components; Ceiling fan(s)
- Interior features: Eat-in kitchen; Walk-in closet(s); One living area; One dining area; Room count of 8
- Laundry & utility: Utility room with built-in cabinets; Full-size washer/dryer area; Washer hookup; Electric dryer hookup
Neighborhood map
What this means for you Summary
Snapshot
- This is a 3-bed/1.0-bath single-family listed at $148k.
Deal economics
- At list price, monthly cash flow is $187 ($2k/yr) — positive.
- The deal already cash-flows at list — no discount required.
- To meet the 1% rule (rent ≥ 1% of price), the offer needs to be $142k (3.4% below list).
- Recommended offer: $142k (3.4% below list) — sets the bar for 1% rule.
- Cap rate 7.8% vs local median 5.7% in Shreveport — top-decile yield for the area; either an underpriced asset or a hidden risk that comps aren't pricing in. Stress-test before assuming the spread holds.
Location & tenants
- Location reads 59/100 on livability (#270 in LA) — a working-class tenant base; expect higher turnover. Strengths: cost of living A+, housing A; Watch: schools D+, crime F, amenities F.
- Caddo Parish (urban): math 21% / reading 32% proficiency, ranked #53 of 98 in LA (top 54%) — low school quality limits family demand, transient renter base, plan for 1-2y turnover; 64% free/reduced lunch — lower-income household profile, screen leases tightly.
- Market conditions: Rents rising (+1.7%/yr); 115 active listings in the ZIP; 10 comparable units currently listed for rent nearby; rentals at typical pace (median 21d on market — plan ~3-4 weeks tenant-placement turnaround); 40% of comp listings sitting > 30 days — soft ceiling on asking rent; 221 units permitted in Caddo Parish in 2024 (0 in 5+ unit buildings).
- This rent runs 34% of the median local income ($50k/yr) — at the standard rent-burdened threshold; future hikes will face affordability resistance.
Forward outlook
- Local home prices are declining (-3.0%/yr); year-one equity from $1k of loan paydown is wiped out by about $4k of value loss. Plan a longer hold.
- Caddo County population projected at -15% by 2050 — secular population decline; favor cash flow + early exit over multi-decade hold.
Negotiation context
- Only 4 days on market — expect competitive offers; lowballing is unlikely to land.
Risks & watch-outs
- Climate carrying-cost: major wind risk, 68% chance of damaging wind over 30y; extreme-heat days projected 7→22/yr by 2055 (HVAC capex compounding) — expect insurance premiums to compound above CPI over the hold.
Questions for the listing agent
- Built in 1969 — when were the roof, HVAC, electrical panel, plumbing, and water heater last replaced?
- Is there a deadline driving the sale (1031 exchange, divorce, estate, relocation)? That informs how much negotiation room exists.
- Schools are D-rated, which usually means shorter tenancies and higher turnover. Who's the typical renter profile here, and what's been the actual vacancy rate?
- Crime grade is F in this area — have there been break-ins, vandalism, or insurance claims at this property in the last 3 years? What carrier currently insures it and at what premium?
- What's the average days-on-market for RENTAL listings here right now (not sales)? A rising rental-DOM trend means longer vacancies and softer asking-rent achievability than the comps imply.
- What's the recent tenant-quality profile in this submarket — average credit score on applications, eviction rate, late-payment / NSF rate, and stable-employment percentage? A property-management company in the area should have these aggregated.
- How much new for-sale + rental construction is in the pipeline within 1–3 miles? Heavy new supply typically softens prices + rents 12–24 months out; constrained supply supports both.
Investment metrics
- 1% rule
- 0.97% ✗
- Cap rate
- 7.82%
- Cash-on-cash
- 5.44%
- DSCR
- 1.24
- GRM
- 8.6
CMA / ARV
- ARV (median comp)
- $154,162
- List price
- $147,500
- Delta
- -4.32%
- Verdict
- FAIR
- Comps
- 20 within 1.0 mi
Show comp detail 12 sales within ~0.75 mi
| Address | Dist | Beds/Ba | Sqft | Sold | Price | $/sf | Match |
|---|---|---|---|---|---|---|---|
| 9034 Sara Ln | 0.16mi | 3/1.5 | 1,513 (-2%) | 2mo | $165,000 | $109 | 86 |
| 9028 Letha Ln | 0.17mi | 3/1.5 | 1,507 (-2%) | 5mo | $169,900 | $113 | 83 |
| 3037 Salem Dr | 0.53mi | 3/2.0 | 1,542 (+0%) | 0mo | $175,000 | $113 | 71 |
| 9014 Southwood Dr Unit 16-161404-17-19 | 0.22mi | 3/2.0 | 1,695 (+10%) | 4mo | $170,000 | $100 | 66 |
| 2951 Salem Dr | 0.40mi | 3/2.0 | 1,635 (+6%) | 3mo | $179,000 | $109 | 65 |
| 9033 Hilton Dr | 0.35mi | 4/2.0 (+1) | 1,459 (-5%) | 2mo | $185,000 | $127 | 64 |
| 9039 Sara Ln | 0.18mi | 4/2.0 (+1) | 1,413 (-8%) | 7mo | $154,950 | $110 | 63 |
| 3038 Hoyte Dr | 0.52mi | 3/2.0 | 1,459 (-5%) | 1mo | $125,000 | $86 | 62 |
| 3050 Lone Oak Dr | 0.33mi | 3/1.5 | 1,720 (+12%) | 2mo | $182,500 | $106 | 62 |
| 8823 Kensington Dr | 0.51mi | 3/2.0 | 1,634 (+6%) | 0mo | $140,000 | $86 | 61 |
| 8866 Hedges Dr | 0.60mi | 3/2.0 | 1,582 (+3%) | 5mo | $192,500 | $122 | 59 |
| 8802 Kensington Dr | 0.58mi | 3/2.0 | 1,680 (+9%) | 7mo | $219,900 | $131 | 48 |
Match score weights: distance 35% · size 25% · config 20% · recency 20%. Top-matched comps best support the ARV.
Projected returns pro-forma
-3.0% appreciation · 1.74% rent growth · sell at horizon
- IRR
- -9.2%
- Equity multiple
- 0.67×
- Total profit
- $-13,785
- Equity at exit
- $21,993
- IRR
- -1.5%
- Equity multiple
- 0.91×
- Total profit
- $-3,894
- Equity at exit
- $12,753
Cash invested: $41,300 (down + closing). Projections, not guarantees.
Landlord ↔ Tenant lean methodology
- Overall (STATE)
- 90 Strongly Landlord-Friendly
- State Louisiana
- 90 Strongly Landlord-Friendly · R+12
- County
- — inherits STATE
- City
- — inherits STATE
ZIP-level market 71118
- Rents YoY
- 1.7%
- Active inventory
- 115
- Price-to-rent
- 8.6×
Monthly cashflow live
- Estimated rent
- $1,424 high interval (Pro) →
- Mortgage (P&I)
- −$774
- Tax from tax record
- −$103 /mo · $1,236/yr
- Insurance
- −$61
- HOA
- −$0
- Vacancy / Maint / Mgmt
- −$299
- Net cashflow
- $187
Break-even live
UW: 25.0% down · 7.5% · 30yr · 1.5% tax · 5.0% vac · 8.0% maint · 8.0% mgmt
Financing live
Cash to close
- Down payment
- $36,875
- Closing costs
- $4,425
- Reserves months
- —
- Total cash needed
- —
Loan-product check · same deal, 3 products live
Conventional
25% down · 7.5% · 30yr
- Down + closing
- —
- Monthly P&I
- —
- Monthly cashflow
- —
- DSCR
- —
- Eligible?
- —
Personal DTI + credit; lowest rate.
DSCR
20% down · 8.5% · 30yr
- Down + closing
- —
- Monthly P&I
- —
- Monthly cashflow
- —
- DSCR
- —
- Eligible?
- —
No personal income docs; deal must DSCR.
Hard money
10% down · 12.0% · 12mo
- Down + closing
- —
- Monthly P&I
- —
- Monthly cashflow
- —
- DSCR
- —
- Eligible?
- —
Short-term bridge; refi at stabilization.
Rent comps 10 comps
| Address | Beds | Baths | Sqft | Rent | $/sqft | DOM | Units | Dist |
|---|---|---|---|---|---|---|---|---|
| 2832 Holiday Ln Shreveport, LA | 3.0 | 1.0 | 1104 | $1,250 | $1.13 | 13d | 1 | 0.26mi |
| 9063 Marva Dr Shreveport, LA | 3.0 | 1.5 | 1052 | $1,375 | $1.31 | 44d | 1 | 0.31mi |
| 3011 Mackey Ln Shreveport, LA | 3.0 | 1.5 | 1222 | $1,300 | $1.06 | 13d | 1 | 0.35mi |
| 2935 Salem Dr Shreveport, LA | 3.0 | 2.0 | 1581 | $1,400 | $0.89 | 13d | 1 | 0.40mi |
| 9137 Mansfield Rd Shreveport, LA | 1.0–2.0 | 1.0–2.0 | 1018 | $1,700 | $1.67 | 13d | 3 | 0.48mi |
| 8860 Bernay Dr Shreveport, LA | 3.0 | 1.5 | 1200 | $1,300 | $1.08 | 44d | 1 | 0.51mi |
| 3002 Hazel Cir Shreveport, LA | 4.0 | 2.0 | 1553 | $1,500 | $0.97 | 13d | 1 | 0.64mi |
| 9295 Savanna Dr Shreveport, LA | 3.0 | 1.0 | 1297 | $1,250 | $0.96 | 21d | 1 | 0.84mi |
| 2045 Bert Kouns Industrial Loop Shreveport, LA | 1.0–3.0 | 1.0–2.0 | 1006 | $1,320 | $1.31 | 44d | 11 | 1.00mi |
| 1029 Bert Kouns Industrial Loop Shreveport, LA | 3.0 | 1.5 | 1134 | $1,500 | $1.32 | 44d | 1 | 1.18mi |
Listing history 3 events
-
2026-05-11status Pending 366-char remark
-
2026-04-16$147,500 Active 366-char remark
-
1991-02-28soldstatus
ⓘ Source: listings_history table (triggers on properties + properties_extension) + one-shot
backfill from property_details.listing_events for pre-trigger history.
Tax reassessment forecast LA · Resets to sale price
- Current annual tax
- $1,236 · $103/mo
- Projected year-2 tax
- $1,236 · $103/mo
- Expected delta
- $0/yr ($0/mo · 0.0%)
ⓘ Screening estimate from a state-policy table — verify with the county assessor before closing.
Climate risk First Street
- Flood 1/10 Low FEMA zone X (unshaded) · 0% chance over 30 yrs
- Wildfire 2/10 Low
- Heat 7/10 Severe 7 d/yr ≥110°F today · 22 d/yr by 30 yrs out
- Wind 6/10 Major 68% chance of damaging wind over 30 yrs
- Air quality 2/10 Low 1 unhealthy d/yr today · 1 by 30 yrs out
Nearby sold comps map
Loading sold comps map…
Walkable amenities ~0.75 mi
Loading nearby amenities…
Taxation est. · year 1
- Rental income
- $17,093
- − Mortgage interest
- −$8,262
- − Property taxes
- −$1,236
- − Insurance
- −$738
- − Repairs & maintenance
- −$1,367
- − Management
- −$1,367
- − Depreciation
- −$4,291
- Taxable loss
- −$169
- Est. tax savings @ 24.0%
- +$41
- After-tax cash flow
- $2,288/yr
For passive investors: Depreciation is non-cash, so a rental often shows a tax loss while cash-flowing — sheltering income. Rental losses are passive: they offset passive income freely, and up to $25,000/yr can offset ordinary (W-2) income if you actively participate and your MAGI is under $100k (phasing out to $0 by $150k); unused losses carry forward. On sale, claimed depreciation is recaptured at up to 25%, and gains may owe capital-gains tax (a 1031 exchange can defer both). Figures are a year-1 estimate at your 24.0% rate — not tax advice; consult a CPA.
Schools (NCES district)
- District
- Caddo Parish
- NCES district ID
- 2200300
- Math proficiency
- 21% ▼ -33.00%
- Reading proficiency
- 32% ▼ -30.00%
- Median HH income
- $39,227
- Composite
- 22.23/100
- National rank
- #8148
- State rank
- #53 of 98 in LA
Livability — Shreveport
- Score
- 59/100
- State rank
- #270
- US rank
- #19730
Category grades
Schools grade is shown separately in the Schools card above.
Census & demographics
- Census place
- Shreveport, LA
- County
- Caddo Parish · 178,536 people
- City population
- 164,123
- Metro
- Shreveport-Bossier City, LA
- Population (ZIP)
- 23,219
- Household income
- $50,287
- Rent vs Own
- Severe rent burden
- 1046.0
Population outlook (Caddo County) Hauer SSP2
- Today (2025)
- 243,190 people
- By 2030
- 237,231 · -2.5%
- By 2040
- 222,502 · -8.5%
- By 2050
- 206,516 · -15.1%
- By 2075
- 165,706 · -31.9%
- By 2100
- 122,262 · -49.7%
Race, ethnicity, and origin ACS 2023
- Neighborhood character
- Diverse neighborhood (Simpson 0.55)
- Race & ethnicity
- Black 58% White 33% Two or more races 5% Hispanic / Latino 4% Asian 1%
- Common ancestry
- Slovak 2% Lithuanian 2% Serbian 1%
- Foreign-born
- 2% · Canada
- Languages at home
- 97% English-only · Spanish 2%
Political lean MEDSL · Caddo
- 2024 margin
- Toss-up / Even · D 51.6% · R 47.0% · Other 1.4%
- 2008→2024 swing
- +1.6pp toward D · 2008: 3.0pp · 2024: 4.6pp
- All cycles
- 2024: D+4.6 2020: D+6.8 2016: D+4.2 2012: D+4.9 2008: D+3.0
Not yet ingested
- Civics
- —
Market trends
- HPI YoY
- ▼ -78.81%
- Current HPI
- 129.1782
- Rent YoY
- ▲ 1.74%
- Metro
- Shreveport-Bossier City, LA
- State GDP YoY
- ▲ 3.29%
- F500 in state
- 10
Industry mix (Fortune 500 HQ in LA)
| Industry | F500 HQs | Revenue |
|---|---|---|
| Telecommunications | 2 | $23B |
|
||
| Utilities | 1 | $12B |
|
||
| Wholesale / Distribution | 1 | $5B |
|
||
| Advertising | 1 | $2B |
|
||
Price history
3 events — show timeline
- 2026-05-11 Pending — NTREIS
- 2026-04-16 Listed $147,500 NTREIS
- 1991-02-28 Sold (Public Records) — Public Records
Property tax history
+11.7%/yrLatest (2025): $1,236 · +0.4% YoY. Source: county tax records.
Cash-flow waterfall
monthlySold comps — $/sqft
last 12 mo · ≤1 miLoading sold comps…