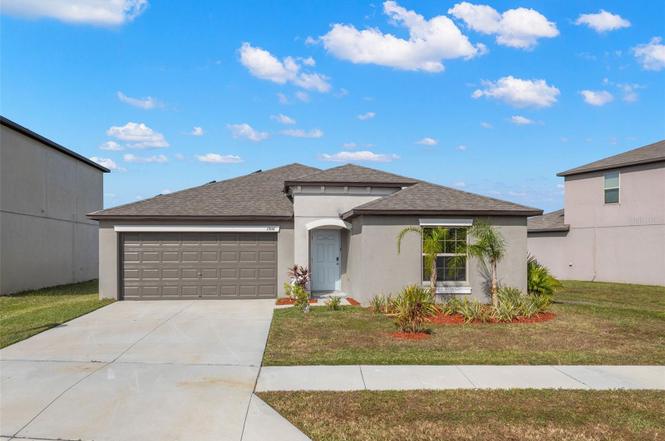
13641 Wild Ginger St · Riverview, FL
Flood risk 1/10 · Minimal
- FEMA flood zone
- X (unshaded)
- Chance of flooding over 30 yrs
- 0.0%
- Est. flood insurance / yr
- $507 – $1,088
Fire risk 5/10 · Moderate
- Est. fire insurance / yr
- $947 – $1,759
Heat risk 10/10 · Severe
- Hot days now (above 109°F)
- 7 days/yr
- Hot days in 30 yrs
- 26 days/yr
Wind risk 10/10 · Severe
- Chance of severe wind over 30 yrs
- 99.0%
Air-quality risk 3/10 · Minor
- Unhealthy air days now
- 3 days/yr
- Unhealthy air days in 30 yrs
- 3 days/yr
Risk factors via First Street. Map © Google.
Why this score? — see what drove the D- grade
The composite is a weighted blend of 9 inputs, each scored 0–100. Each bar is that input's sub-score; the figure is the points it added to the 100-point composite (weight × sub-score).
- Cash flow +7.8/30.0
- ARV discount +7.5/15.0
- Appreciation +4.3/10.0
- Schools +4.2/10.0
- Livability +4.0/5.0
- 1% rule +3.3/10.0
- Rent growth +2.8/5.0
- Condition / age +2.5/5.0
- DSCR +1.9/10.0
$359,990
🖨 Deal sheet (PDF) 📄 Offer letter ✓ Due diligence
Listing remarks
Better-than-new and truly move-in ready, this beautifully maintained 4-bedroom, 2-bathroom single-story home offers peaceful lake views and a highly functional open-concept layout in the sought-after SouthFork Lakes community. The spacious living room flows effortlessly into the dining area and well-appointed kitchen featuring a large center island with breakfast bar, stainless steel appliances, granite countertops, ample white shaker cabinetry, and a walk-in pantry. The desirable split-bedroom floor plan provides excellent privacy, with the generous primary suite overlooking the water and boasting a huge walk-in closet plus an en-suite bath with dual vanities, granite counters, and a large
Key facts
- Granite countertops
- Center island
- Open-concept layout
Tags
Property features AI
Finance
- Other: Lot approximately 0.17 acre (0 to less than 1/4 acre); Asphalt road access
- Financial info: Lease restrictions apply
- HOA & community: HOA managed by First Service Residential; HOA required; HOA fee $150 annually ($12.50 monthly equivalent); Pets allowed; CDD present
Exterior
- Parking: Attached garage with 2 parking spaces
- Utilities: Public water; Public sewer; Public utilities
- Home design: Single family residence; One story; Southeast facing
- Construction: Block construction; Shingle roof; Slab foundation; Built on or before public records date
- Exterior features: Pond view; Other exterior features
Interior
- Kitchen: Dishwasher; Microwave; Range; Refrigerator
- Bedrooms: 4 bedrooms
- Flooring: Carpet; Tile
- Bathrooms: 2 full bathrooms
- Heating & cooling: Central heating; Central air conditioning
- Interior features: Ceiling fans; Open floor plan; Solid surface counters; Thermostat
- Laundry & utility: Dedicated laundry room
Neighborhood map
What this means for you Summary
Snapshot
- This is a 4-bed/2.0-bath single-family listed at $360k.
Deal economics
- At list price, monthly cash flow is $-398 ($-5k/yr) — negative.
- To cash-flow at today's rent, offer at most $290k (19.6% below list).
- To meet the 1% rule (rent ≥ 1% of price), the offer needs to be $301k (16.5% below list).
- Recommended offer: $290k (19.6% below list) — sets the bar for cash-flow.
Location & tenants
- Location reads 79/100 on livability (#134 in FL, #2,000 nationally) — a middle-class / working-renter tenant base. Strengths: housing A+, health & safety A+, employment B+; Watch: amenities F.
- Hillsborough (suburban): math 47% / reading 50% proficiency, ranked #41 of 73 in FL (top 56%) — families likely to look elsewhere, expect single-tenant / working-renter base with shorter leases.
- Zoned schools: Summerfield Crossings Elementary School (math 43% / reading 45%, grade F, #1,330 of 2,144 statewide, top 63%, 869 students, 53% FRL); Jule F Sumner High School (math 43% / reading 43%, grade F, #255 of 667 statewide, top 39%, 3,827 students, 43% FRL) — zoned schools at 48% FRL track the district average.
- Market conditions: Rents rising (+1.2%/yr); 463 active listings in the ZIP; 33 comparable units currently listed for rent nearby; rentals leasing fast (median 14d on market — plan ~1-2 weeks tenant-placement turnaround); high-income renter base; 9,053 units permitted in Hillsborough County in 2024 (4,555 in 5+ unit buildings).
- This rent runs 31% of the median local income ($116k/yr) — at the standard rent-burdened threshold; future hikes will face affordability resistance.
Forward outlook
- Local home prices are declining (-1.4%/yr); year-one equity from $2k of loan paydown is wiped out by about $5k of value loss. Plan a longer hold.
- Hillsborough County population projected at +37% by 2050 — long-run rental-demand tailwind backs the buy-and-hold thesis.
Negotiation context
- It's been on market 176 days — a 12% lower offer ($317k) is reasonable based on typical stale-listing flexibility.
- 2 sale attempts with the ask held roughly flat each time — persistent listings suggest the price (not the market) is what's stuck; bring a comps-based counter.
Risks & watch-outs
- Climate carrying-cost: severe wind risk, 99% chance of damaging wind over 30y; moderate wildfire risk; extreme-heat days projected 7→26/yr by 2055 (HVAC capex compounding) — expect insurance premiums to compound above CPI over the hold.
Questions for the listing agent
- What do current leases actually rent for vs. the listed asking? Can we see a recent rent roll and the last 12 months of T-12 income?
- It's been on market 176 days. Have you received any prior offers? Is the seller open to a 20% concession, seller financing, or rate buy-down credit?
- What does the HOA fee cover, when was the last increase, and are there any pending special assessments or reserve-fund shortfalls?
- Why hasn't it sold? Are there any deal-killer items the seller is aware of (foundation, flood, title, zoning, code violations)?
- Is there a deadline driving the sale (1031 exchange, divorce, estate, relocation)? That informs how much negotiation room exists.
- Schools are B-rated — typically a magnet for longer-tenancy family renters. What's the average tenant stay here, and is there a school-zone premium baked into asking?
- The area grade is low — what's the realistic commute time and amenity access for the typical tenant pool here? Any planned neighborhood developments (good or bad) we should know about?
- What's the average days-on-market for RENTAL listings here right now (not sales)? A rising rental-DOM trend means longer vacancies and softer asking-rent achievability than the comps imply.
- What's the recent tenant-quality profile in this submarket — average credit score on applications, eviction rate, late-payment / NSF rate, and stable-employment percentage? A property-management company in the area should have these aggregated.
- How much new for-sale + rental construction is in the pipeline within 1–3 miles? Heavy new supply typically softens prices + rents 12–24 months out; constrained supply supports both.
Investment metrics
- 1% rule
- 0.83% ✗
- Cap rate
- 4.96%
- Cash-on-cash
- -4.74%
- DSCR
- 0.79
- GRM
- 10.0
CMA / ARV
No comps found within radius.
Projected returns pro-forma
-1.42% appreciation · 1.18% rent growth · sell at horizon
- IRR
- -15.8%
- Equity multiple
- 0.36×
- Total profit
- $-64,456
- Equity at exit
- $79,678
- IRR
- -11.1%
- Equity multiple
- 0.14×
- Total profit
- $-86,836
- Equity at exit
- $77,661
Cash invested: $100,797 (down + closing). Projections, not guarantees.
Landlord ↔ Tenant lean methodology
- Overall (STATE)
- 87 Strongly Landlord-Friendly
- State Florida
- 87 Strongly Landlord-Friendly · R+3
- County
- — inherits STATE
- City
- — inherits STATE
ZIP-level market 33579
- Home prices YoY
- -0.6%
- Rents YoY
- 1.2%
- Active inventory
- 463
- Price-to-rent
- 10.0×
Monthly cashflow live
- Estimated rent
- $3,005 high interval (Pro) →
- Mortgage (P&I)
- −$1,888
- Tax from tax record
- −$723 /mo · $8,671/yr
- Insurance
- −$150
- HOA
- −$12
- Vacancy / Maint / Mgmt
- −$631
- Net cashflow
- $-398
Break-even live
Sensitivity live
| Price | -10% $-195 | -5% $-297 | +0% $-398 | +5% $-500 | +10% $-602 |
|---|---|---|---|---|---|
| Rent | -10% $-636 | -5% $-517 | +0% $-398 | +5% $-280 | +10% $-161 |
| Rate | -1.0pp $-217 | -0.5pp $-307 | base $-398 | +0.5pp $-492 | +1.0pp $-587 |
UW: 25.0% down · 7.5% · 30yr · 1.5% tax · 5.0% vac · 8.0% maint · 8.0% mgmt
Financing live
Cash to close
- Down payment
- $89,998
- Closing costs
- $10,800
- Reserves months
- —
- Total cash needed
- —
Loan-product check · same deal, 3 products live
Conventional
25% down · 7.5% · 30yr
- Down + closing
- —
- Monthly P&I
- —
- Monthly cashflow
- —
- DSCR
- —
- Eligible?
- —
Personal DTI + credit; lowest rate.
DSCR
20% down · 8.5% · 30yr
- Down + closing
- —
- Monthly P&I
- —
- Monthly cashflow
- —
- DSCR
- —
- Eligible?
- —
No personal income docs; deal must DSCR.
Hard money
10% down · 12.0% · 12mo
- Down + closing
- —
- Monthly P&I
- —
- Monthly cashflow
- —
- DSCR
- —
- Eligible?
- —
Short-term bridge; refi at stabilization.
Rent comps 33 comps
| Address | Beds | Baths | Sqft | Rent | $/sqft | DOM | Units | Dist |
|---|---|---|---|---|---|---|---|---|
| 11838 Blackeyed Susan Dr Riverview, FL | 4.0 | 2.0 | 1816 | $2,800 | $1.54 | 22d | 1 | 0.10mi |
| 13456 Palmera Vista Dr Riverview, FL | 3.0 | 2.0 | 1752 | $2,500 | $1.43 | 19d | 1 | 0.40mi |
| 13515 Palmera Vista Dr Riverview, FL | 4.0 | 2.0 | 1850 | $3,800 | $2.05 | 19d | 1 | 0.43mi |
| 13515 Palmera Vista Dr Riverview, FL | 4.0 | 2.0 | 1832 | $3,800 | $2.07 | 1d | 1 | 0.43mi |
| 11716 Navajo Sandstone St Riverview, FL | 4.0 | 2.5 | 2450 | $2,900 | $1.18 | 6d | 1 | 0.65mi |
| 11810 Tetrafin Dr Riverview, FL | 4.0 | 2.0 | 2184 | $2,750 | $1.26 | 26d | 1 | 0.66mi |
| 13204 Waterleaf Garden Cir Riverview, FL | 4.0 | 2.0 | 2046 | $3,600 | $1.76 | 6d | 1 | 0.73mi |
| 13316 Palmera Vista Dr Riverview, FL | 3.0 | 2.5 | 2497 | $3,200 | $1.28 | 21d | 1 | 0.75mi |
| 13316 Palmera Vista Dr Riverview, FL | 3.0 | 2.5 | 2497 | $3,200 | $1.28 | 26d | 1 | 0.75mi |
| 11618 Ashton Field Ave Riverview, FL | 4.0 | 3.0 | 2114 | $2,400 | $1.14 | 1d | 1 | 0.83mi |
| 11328 Misty Isle Ln Riverview, FL | 4.0 | 3.5 | 2532 | $2,600 | $1.03 | 11d | 1 | 0.93mi |
| 11927 Streambed Dr Riverview, FL | 3.0 | 2.5 | 2320 | $3,100 | $1.34 | 6d | 1 | 1.01mi |
| 13263 Evening Sunset Ln Riverview, FL | 4.0 | 2.0 | 1959 | $2,200 | $1.12 | 6d | 1 | 1.02mi |
| 13465 Fladgate Mark Dr Riverview, FL | 4.0 | 2.0 | 1544 | $2,045 | $1.32 | 1d | 1 | 1.02mi |
| 13465 Fladgate Mark Dr Riverview, FL | 4.0 | 2.0 | 1544 | $2,045 | $1.32 | 6d | 1 | 1.02mi |
| 12109 Night Jasmine Cv Riverview, FL | 4.0 | 3.0 | 2364 | $3,150 | $1.33 | 11d | 1 | 1.02mi |
| 11519 Misty Isle Ln Riverview, FL | 4.0 | 2.0 | 1936 | $2,600 | $1.34 | 26d | 1 | 1.03mi |
| 12036 Cardinal Flower Dr Riverview, FL | 4.0 | 2.5 | 2542 | $2,590 | $1.02 | 13d | 1 | 1.07mi |
| 11412 Misty Isle Ln Riverview, FL | 5.0 | 4.0 | 2523 | $3,200 | $1.27 | 26d | 1 | 1.07mi |
| 11424 Misty Isle Ln Riverview, FL | 3.0 | 2.0 | 1839 | $2,165 | $1.18 | 14d | 1 | 1.12mi |
| 11427 Misty Isle Ln Riverview, FL | 4.0 | 2.0 | 1916 | $2,310 | $1.21 | 6d | 1 | 1.12mi |
| 13185 Green Violet Dr Riverview, FL | 4.0 | 3.0 | 1908 | $2,459 | $1.29 | 6d | 1 | 1.13mi |
| 11736 Dumaine Valley Rd Riverview, FL | 3.0 | 2.5 | 1670 | $2,000 | $1.20 | 16d | 1 | 1.14mi |
| 13655 Artesa Bell Dr Riverview, FL | 4.0 | 3.0 | 2351 | $3,000 | $1.28 | 0d | 1 | 1.22mi |
| 11211 Flora Springs Dr Riverview, FL | 5.0 | 3.0 | 2320 | $2,723 | $1.17 | 25d | 1 | 1.31mi |
| 11510 Harlan Eddy Ct Riverview, FL | 4.0 | 2.0 | 2351 | $2,700 | $1.15 | 26d | 1 | 1.33mi |
| 12330 Streambed Dr Riverview, FL | 4.0 | 3.0 | 2357 | $3,300 | $1.40 | 6d | 1 | 1.35mi |
| 13423 Beechberry Dr Riverview, FL | 4.0 | 2.5 | 2322 | $2,800 | $1.21 | 4d | 1 | 1.36mi |
| 12201 Matchfield Way Riverview, FL | 4.0 | 2.0 | 1522 | $1,595 | $1.05 | 19d | 1 | 1.43mi |
| 12115 Feldwood Creek Ln Riverview, FL | 3.0 | 2.0 | 1234 | $1,850 | $1.50 | 6d | 1 | 1.43mi |
| 12116 Feldwood Creek Ln Riverview, FL | 3.0 | 2.0 | 1289 | $1,825 | $1.42 | 22d | 1 | 1.46mi |
| 12377 Streambed Dr Riverview, FL | 4.0 | 2.5 | 2414 | $2,800 | $1.16 | 26d | 1 | 1.47mi |
| 13230 Prestwick Dr Riverview, FL | 3.0 | 2.0 | 1270 | $1,830 | $1.44 | 19d | 1 | 1.47mi |
HOA detail
- Monthly dues
- $12 · $144/yr
- Likely covers
- water
Listing history 8 events
-
2026-05-11status Pending
-
2026-03-27status Active
-
2026-03-25status Pending
-
2026-03-24price $359,990
-
2026-02-26price $364,990
-
2025-12-16price $369,900
-
2025-11-14$374,900 Active
-
2020-12-09soldstatus $3,540,000
ⓘ Source: listings_history table (triggers on properties + properties_extension) + one-shot
backfill from property_details.listing_events for pre-trigger history.
Tax reassessment forecast FL · Resets to sale price
- Current annual tax
- $8,671 · $723/mo
- Projected year-2 tax
- $8,671 · $723/mo
- Expected delta
- $0/yr ($0/mo · 0.0%)
ⓘ Screening estimate from a state-policy table — verify with the county assessor before closing.
Climate risk First Street
- Flood 1/10 Low FEMA zone X (unshaded) · 0% chance over 30 yrs
- Wildfire 5/10 Major
- Heat 10/10 Extreme 7 d/yr ≥109°F today · 26 d/yr by 30 yrs out
- Wind 10/10 Extreme 99% chance of damaging wind over 30 yrs
- Air quality 3/10 Moderate 3 unhealthy d/yr today · 3 by 30 yrs out
Nearby sold comps map
Loading sold comps map…
Walkable amenities ~0.75 mi
Loading nearby amenities…
Taxation est. · year 1
- Rental income
- $36,060
- − Mortgage interest
- −$20,165
- − Property taxes
- −$8,671
- − Insurance
- −$1,800
- − Repairs & maintenance
- −$2,885
- − Management
- −$2,885
- − HOA
- −$144
- − Depreciation
- −$10,472
- Taxable loss
- −$10,962
- Est. tax savings @ 24.0%
- +$2,631
- After-tax cash flow
- $-2,151/yr
For passive investors: Depreciation is non-cash, so a rental often shows a tax loss while cash-flowing — sheltering income. Rental losses are passive: they offset passive income freely, and up to $25,000/yr can offset ordinary (W-2) income if you actively participate and your MAGI is under $100k (phasing out to $0 by $150k); unused losses carry forward. On sale, claimed depreciation is recaptured at up to 25%, and gains may owe capital-gains tax (a 1031 exchange can defer both). Figures are a year-1 estimate at your 24.0% rate — not tax advice; consult a CPA.
Schools (NCES district)
- District
- Hillsborough
- NCES district ID
- 1200870
- Math proficiency
- 47% ▼ -8.00%
- Reading proficiency
- 50% ▼ -4.00%
- Median HH income
- $50,622
- Composite
- 41.6/100
- National rank
- #3435
- State rank
- #41 of 73 in FL
Livability — Riverview
- Score
- 79/100
- State rank
- #134
- US rank
- #2000
Category grades
Schools grade is shown separately in the Schools card above.
Census & demographics
- Census place
- Riverview, FL
- County
- Hillsborough County · 1,540,968 people
- City population
- 137,988
- Metro
- Tampa-St. Petersburg-Clearwater, FL
- Population (ZIP)
- 49,470
- Household income
- $116,134
- Rent vs Own
- Severe rent burden
- 258.0
Population outlook (Hillsborough County) Hauer SSP2
- Today (2025)
- 1,607,022 people
- By 2030
- 1,733,968 · +7.9%
- By 2040
- 1,979,565 · +23.2%
- By 2050
- 2,203,427 · +37.1%
- By 2075
- 2,667,893 · +66.0%
- By 2100
- 2,891,558 · +79.9%
Race, ethnicity, and origin ACS 2023
- Neighborhood character
- Highly diverse neighborhood (Simpson 0.71)
- Race & ethnicity
- White 42% Hispanic / Latino 25% Black 24% Two or more races 19% Asian 5%
- Hispanic origin (detail)
- Mexican 3% Puerto Rican 12% Cuban 3% Dominican 1%
- Common ancestry
- Hispanic 1% British 1% Romanian 1%
- Foreign-born
- 17% · Canada, Jamaica, China
- Languages at home
- 73% English-only · Spanish 19% Other Indo-European 2% French/Haitian/Cajun 1%
Political lean MEDSL · Hillsborough
- 2024 margin
- Toss-up / Even · D 47.8% · R 50.9% · Other 1.3%
- 2008→2024 swing
- -10.2pp toward R · 2008: 7.1pp · 2024: -3.1pp
- All cycles
- 2024: R+3.1 2020: D+6.9 2016: D+6.8 2012: D+6.7 2008: D+7.1
Not yet ingested
- Civics
- —
Market trends
- HPI YoY
- ▼ -1.42%
- Current HPI
- 240.5825
- Rent YoY
- ▲ 1.18%
- Metro
- Tampa-St. Petersburg-Clearwater, FL
- State GDP YoY
- ▲ 3.28%
- F500 in state
- 36
Industry mix (Fortune 500 HQ in FL)
| Industry | F500 HQs | Revenue |
|---|---|---|
| Industrial Technology | 2 | $29B |
|
||
| Insurance | 2 | $17B |
|
||
| Retail | 1 | $60B |
|
||
| Technology Distribution | 1 | $58B |
|
||
| Homebuilding | 1 | $35B |
|
||
| Technology Manufacturing | 1 | $35B |
|
||
Price history
-89.8% since first listed8 events — show timeline
- 2026-05-11 Pending — Stellar MLS as Distributed by MLS Grid
- 2026-03-27 Relisted — Stellar MLS as Distributed by MLS Grid
- 2026-03-25 Pending — Stellar MLS as Distributed by MLS Grid
- 2026-03-24 Price Changed $359,990 Stellar MLS as Distributed by MLS Grid
- 2026-02-26 Price Changed $364,990 Stellar MLS as Distributed by MLS Grid
- 2025-12-16 Price Changed $369,900 Stellar MLS as Distributed by MLS Grid
- 2025-11-14 Listed $374,900 Stellar MLS as Distributed by MLS Grid
- 2020-12-09 Sold (Public Records) $3,540,000 Public Records
Property tax history
+25.1%/yrLatest (2025): $8,671 · +4.3% YoY. Source: county tax records.
Cash-flow waterfall
monthlySold comps — $/sqft
last 12 mo · ≤1 miLoading sold comps…