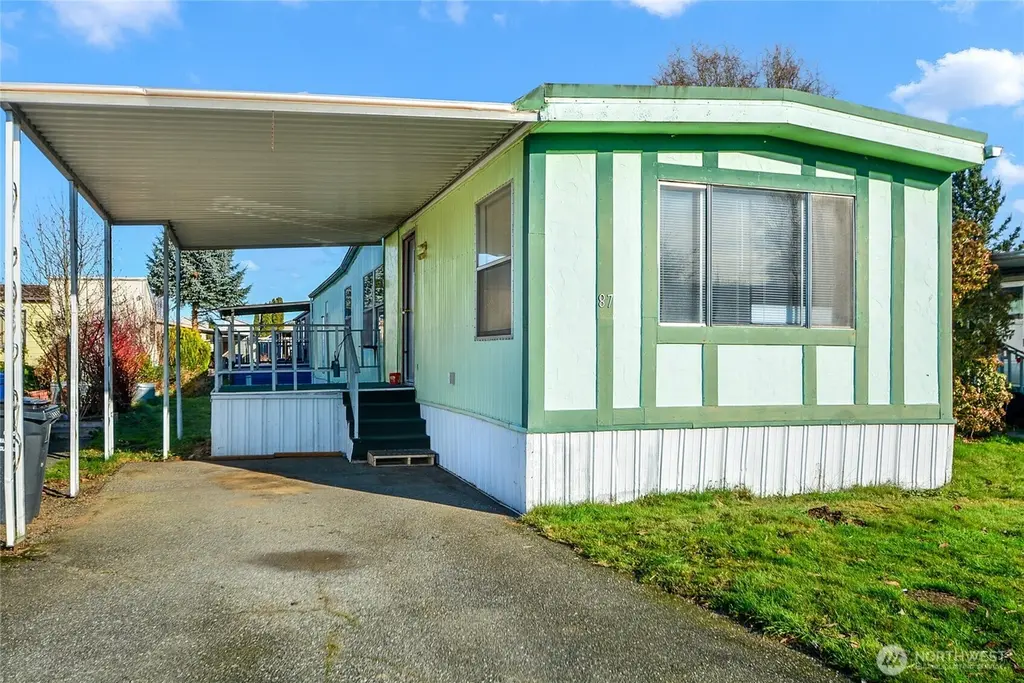
16600 25th Ave NE #87 · Marysville, WA
Flood risk No data
- FEMA flood zone
- —
- Chance of flooding over 30 yrs
- —
- Est. flood insurance / yr
- —
Fire risk No data
- Est. fire insurance / yr
- —
Heat risk No data
- Hot days now (above threshold)
- —
- Hot days in 30 yrs
- —
Wind risk No data
- Chance of severe wind over 30 yrs
- —
Air-quality risk No data
- Unhealthy air days now
- —
- Unhealthy air days in 30 yrs
- —
Risk factors via First Street. Map © Google.
Why this score? — see what drove the B grade
The composite is a weighted blend of 9 inputs, each scored 0–100. Each bar is that input's sub-score; the figure is the points it added to the 100-point composite (weight × sub-score).
- Cash flow +30.0/30.0
- 1% rule +10.0/10.0
- DSCR +10.0/10.0
- ARV discount +7.4/15.0
- Schools +4.4/10.0
- Livability +4.2/5.0
- Rent growth +3.1/5.0
- Condition / age +2.5/5.0
- Appreciation +0.0/10.0
$89,500
🖨 Deal sheet (PDF) 📄 Offer letter ✓ Due diligence
Listing remarks
Welcome to this friendly 55+ Park! We have a 2 bedroom, 1 full bath home now available! Great location near the recreation center and pool. New carpet and vinyl plank flooring that makes this home so light and bright! TWO sheds for lots of extra storage! Sewer and Water costs are included with the space lease, which is one of the best prices in the county! Seasonal pool for all residents, and opens in May. Monthly activities at the clubhouse, check them out! RV/boat parking possible for low fee. Pets ok, subject to manager approval. Close to Target and Costco, with lots of businesses near, yet tucked away enough to enjoy the peace and quiet. You must make application to the park with the m
Key facts
- Rv boat parking
- Pool
- Recreation center
Tags
Neighborhood map
What this means for you Summary
Snapshot
- This is a 2-bed/1.0-bath manufactured listed at $90k.
Deal economics
- At list price, monthly cash flow is $1k ($15k/yr) — positive.
- The deal already cash-flows at list — no discount required.
- Meets the 1% rule at list price ($2k rent vs $90k).
- Recommended offer: $79k (12.0% below list) — sets the bar for market timing.
- Cap rate 22.7% vs local median 3.0% in Marysville — top-decile yield for the area; either an underpriced asset or a hidden risk that comps aren't pricing in. Stress-test before assuming the spread holds.
Location & tenants
- Location reads 84/100 on livability (#43 in WA, #768 nationally) — a professional / high-income tenant draw. Strengths: commute A+, employment A+, housing A+; Watch: cost of living F.
- Lakewood School District (suburban): math 41% / reading 55% proficiency, ranked #151 of 291 in WA (top 52%) — families likely to look elsewhere, expect single-tenant / working-renter base with shorter leases.
- Zoned schools: Cougar Creek Elementary School (359 students, 46% FRL); Lakewood Middle School (599 students, 50% FRL); Lakewood High School (850 students, 42% FRL) — zoned schools average 46% FRL vs 29% district-wide (17 pts higher); higher-poverty schools than district average — tighter screening recommended.
- Market conditions: Rents rising (+2.3%/yr); 215 active listings in the ZIP; 9 comparable units currently listed for rent nearby; rentals leasing fast (median 0d on market — plan ~1-2 weeks tenant-placement turnaround); solid renter incomes; 3,982 units permitted in Snohomish County in 2024 (1,492 in 5+ unit buildings).
Forward outlook
- Local home prices are declining (-3.0%/yr); year-one equity from $619 of loan paydown is wiped out by about $3k of value loss. Plan a longer hold.
- Snohomish County population projected at +30% by 2050 — long-run rental-demand tailwind backs the buy-and-hold thesis.
- At projected returns (-3.0% appreciation + 2.3% rent growth), your $25k cash investment doubles in ~2 years — after that, you're playing with house money.
Negotiation context
- It's been on market 127 days — a 12% lower offer ($79k) is reasonable based on typical stale-listing flexibility.
Questions for the listing agent
- It's been on market 127 days. Have you received any prior offers? Is the seller open to a 12% concession, seller financing, or rate buy-down credit?
- Built in 1977 — when were the roof, HVAC, electrical panel, plumbing, and water heater last replaced?
- Why hasn't it sold? Are there any deal-killer items the seller is aware of (foundation, flood, title, zoning, code violations)?
- Is there a deadline driving the sale (1031 exchange, divorce, estate, relocation)? That informs how much negotiation room exists.
- Schools are B-rated — typically a magnet for longer-tenancy family renters. What's the average tenant stay here, and is there a school-zone premium baked into asking?
- What's the average days-on-market for RENTAL listings here right now (not sales)? A rising rental-DOM trend means longer vacancies and softer asking-rent achievability than the comps imply.
- What's the recent tenant-quality profile in this submarket — average credit score on applications, eviction rate, late-payment / NSF rate, and stable-employment percentage? A property-management company in the area should have these aggregated.
- How much new for-sale + rental construction is in the pipeline within 1–3 miles? Heavy new supply typically softens prices + rents 12–24 months out; constrained supply supports both.
Investment metrics
- 1% rule
- 2.51% ✓
- Cap rate
- 22.68%
- Cash-on-cash
- 58.51%
- DSCR
- 3.60
- GRM
- 3.3
CMA / ARV
- ARV (median comp)
- $89,363
- List price
- $89,500
- Delta
- 0.15%
- Verdict
- FAIR
- Comps
- 3 within 1.0 mi
Show comp detail 7 sales within ~0.75 mi
| Address | Dist | Beds/Ba | Sqft | Sold | Price | $/sf | Match |
|---|---|---|---|---|---|---|---|
| 16600 25th Ave NE #109 | 0.00mi | 2/2.0 | 1,008 (+4%) | 1mo | $100,000 | $99 | 89 |
| 16600 25th Ave NE #71 | 0.00mi | 2/2.0 | 924 (-5%) | 2mo | $69,000 | $75 | 86 |
| 16600 25th Ave NE #18 | 0.00mi | 2/2.0 | 924 (-5%) | 8mo | $89,000 | $96 | 81 |
| 16600 25th Ave NE #55 | 0.00mi | 2/1.0 | 924 (-5%) | 14mo | $85,000 | $92 | 80 |
| 16600 25th Ave NE #15 | 0.00mi | 2/1.0 | 924 (-5%) | 14mo | $95,000 | $103 | 80 |
| 16600 25th Ave NE #78 | 0.00mi | 2/1.0 | 924 (-5%) | 24mo | $73,000 | $79 | 72 |
| 16600 25th Ave NE #73 | 0.00mi | 2/1.0 | 1,056 (+9%) | 22mo | $89,000 | $84 | 67 |
Match score weights: distance 35% · size 25% · config 20% · recency 20%. Top-matched comps best support the ARV.
Projected returns pro-forma
-3.0% appreciation · 2.3% rent growth · sell at horizon
- IRR
- 56.3%
- Equity multiple
- 3.46×
- Total profit
- $61,747
- Equity at exit
- $13,345
- IRR
- 61.0%
- Equity multiple
- 6.89×
- Total profit
- $147,597
- Equity at exit
- $7,738
Cash invested: $25,060 (down + closing). Projections, not guarantees.
Landlord ↔ Tenant lean methodology
- Overall (STATE)
- 28 Tenant-Leaning
- State Washington
- 28 Tenant-Leaning · D+8
- County
- — inherits STATE
- City
- — inherits STATE
ZIP-level market 98271
- Rents YoY
- 2.3%
- Active inventory
- 215
- Price-to-rent
- 3.3×
Monthly cashflow live
- Estimated rent
- $2,250 high interval (Pro) →
- Mortgage (P&I)
- −$469
- Tax from tax record
- −$49 /mo · $587/yr
- Insurance
- −$37
- HOA
- −$0
- Vacancy / Maint / Mgmt
- −$473
- Net cashflow
- $1,222
Break-even live
Sensitivity live
| Price | -10% $1,273 | -5% $1,247 | +0% $1,222 | +5% $1,197 | +10% $1,171 |
|---|---|---|---|---|---|
| Rent | -10% $1,044 | -5% $1,133 | +0% $1,222 | +5% $1,311 | +10% $1,400 |
| Rate | -1.0pp $1,267 | -0.5pp $1,245 | base $1,222 | +0.5pp $1,199 | +1.0pp $1,175 |
UW: 25.0% down · 7.5% · 30yr · 1.5% tax · 5.0% vac · 8.0% maint · 8.0% mgmt
Financing live
Cash to close
- Down payment
- $22,375
- Closing costs
- $2,685
- Reserves months
- —
- Total cash needed
- —
Loan-product check · same deal, 3 products live
Conventional
25% down · 7.5% · 30yr
- Down + closing
- —
- Monthly P&I
- —
- Monthly cashflow
- —
- DSCR
- —
- Eligible?
- —
Personal DTI + credit; lowest rate.
DSCR
20% down · 8.5% · 30yr
- Down + closing
- —
- Monthly P&I
- —
- Monthly cashflow
- —
- DSCR
- —
- Eligible?
- —
No personal income docs; deal must DSCR.
Hard money
10% down · 12.0% · 12mo
- Down + closing
- —
- Monthly P&I
- —
- Monthly cashflow
- —
- DSCR
- —
- Eligible?
- —
Short-term bridge; refi at stabilization.
Rent comps 9 comps
| Address | Beds | Baths | Sqft | Rent | $/sqft | DOM | Units | Dist |
|---|---|---|---|---|---|---|---|---|
| 2100 172nd St NE Marysville, WA | 1.0–3.0 | 1.0–2.0 | 916 | $2,537 | $2.77 | 0d | 8 | 0.41mi |
| 2203 172nd St NE Marysville, WA | 1.0–2.0 | 1.0 | 631 | $1,699 | $2.69 | 0d | 6 | 0.51mi |
| 17500 25th Ave NE Marysville, WA | 1.0–3.0 | 1.0–2.0 | 963 | $2,335 | $2.42 | 0d | 39 | 0.60mi |
| 17313 Smokey Point Blvd Arlington, WA | 2.0 | 1.0 | 800 | $1,738 | $2.17 | 0d | 2 | 0.95mi |
| 18111 25th Ave NE Marysville, WA | 2.0–3.0 | 1.5–2.5 | 1284 | $2,225 | $1.73 | 0d | 13 | 0.97mi |
| 17505 38th Dr NE Arlington, WA | 3.0 | 2.0 | 1050 | $2,800 | $2.67 | 12d | 1 | 1.12mi |
| 17309 40th Ave NE Arlington, WA | 1.0–2.0 | 1.0 | 660 | $2,063 | $3.12 | 0d | 10 | 1.13mi |
| 18321 31st Ave NE Arlington, WA | 1.0–2.0 | 1.0 | 572 | $1,900 | $3.32 | 0d | 2 | 1.25mi |
| 18506 Smokey Point Blvd Arlington, WA | 1.0–3.0 | 1.0–2.0 | 881 | $2,036 | $2.31 | 0d | 15 | 1.39mi |
Listing history 18 events
-
2026-06-21days on market $89,500 Active 127 DOM
-
2026-06-18days on market $89,500 Active 124 DOM
-
2026-06-17days on market $89,500 Active 123 DOM
-
2026-06-16days on market $89,500 Active 122 DOM
-
2026-06-15days on market $89,500 Active 121 DOM
-
2026-06-13days on market $89,500 Active 119 DOM
-
2026-06-13days on market $89,500 Active 118 DOM
-
2026-06-10price $89,500 Active 115 DOM
-
2026-06-09days on market $92,400 Active 115 DOM
-
2026-06-08days on market $92,400 Active 114 DOM
-
2026-06-07days on market $92,400 Active 113 DOM
-
2026-06-04days on market $92,400 Active 110 DOM
-
2026-06-03days on market $92,400 Active 109 DOM
-
2026-06-02days on market $92,400 Active 108 DOM
-
2026-06-01days on market $92,400 Active 107 DOM
-
2026-05-31days on market $92,400 Active 106 DOM
-
2026-03-16price $92,400
-
2026-02-14$94,900 Active
ⓘ Source: listings_history table (triggers on properties + properties_extension) + one-shot
backfill from property_details.listing_events for pre-trigger history.
Tax reassessment forecast WA · Resets to sale price
- Current annual tax
- $587 · $49/mo
- Projected year-2 tax
- $877 · $73/mo
- Expected delta
- +$290/yr (+$24/mo · 49.4%)
ⓘ Screening estimate from a state-policy table — verify with the county assessor before closing.
Nearby sold comps map
Loading sold comps map…
Walkable amenities ~0.75 mi
Loading nearby amenities…
Taxation est. · year 1
- Rental income
- $27,001
- − Mortgage interest
- −$5,013
- − Property taxes
- −$587
- − Insurance
- −$448
- − Repairs & maintenance
- −$2,160
- − Management
- −$2,160
- − Depreciation
- −$2,604
- Taxable income
- $14,029
- Est. tax owed @ 24.0%
- −$3,367
- After-tax cash flow
- $11,297/yr
For passive investors: Depreciation is non-cash, so a rental often shows a tax loss while cash-flowing — sheltering income. Rental losses are passive: they offset passive income freely, and up to $25,000/yr can offset ordinary (W-2) income if you actively participate and your MAGI is under $100k (phasing out to $0 by $150k); unused losses carry forward. On sale, claimed depreciation is recaptured at up to 25%, and gains may owe capital-gains tax (a 1031 exchange can defer both). Figures are a year-1 estimate at your 24.0% rate — not tax advice; consult a CPA.
Schools (NCES district)
- District
- Lakewood School District
- NCES district ID
- 5304260
- Math proficiency
- 41% ▼ -4.00%
- Reading proficiency
- 55% ▬ 0.00%
- Median HH income
- $63,106
- Composite
- 44.45/100
- National rank
- #6089
- State rank
- #151 of 291 in WA
Livability — Marysville
- Score
- 84/100
- State rank
- #43
- US rank
- #768
Category grades
Schools grade is shown separately in the Schools card above.
Census & demographics
- Census place
- Marysville, WA
- County
- Snohomish County · 786,756 people
- City population
- 85,887
- Metro
- Seattle-Tacoma-Bellevue, WA
- Population (ZIP)
- 30,838
- Household income
- $95,654
- Rent vs Own
- Severe rent burden
- 929.0
Population outlook (Snohomish County) Hauer SSP2
- Today (2025)
- 899,800 people
- By 2030
- 960,975 · +6.8%
- By 2040
- 1,074,447 · +19.4%
- By 2050
- 1,171,954 · +30.2%
- By 2075
- 1,384,849 · +53.9%
- By 2100
- 1,497,296 · +66.4%
Race, ethnicity, and origin ACS 2023
- Neighborhood character
- Predominantly White (66%)
- Race & ethnicity
- White 66% Two or more races 13% Hispanic / Latino 13% Native American 7% Asian 5% Black 1%
- Hispanic origin (detail)
- Mexican 9%
- Common ancestry
- Portuguese 6% Iranian 3% Lithuanian 2%
- Foreign-born
- 9% · Canada, China, South Korea
- Languages at home
- 86% English-only · Spanish 8% Russian/Polish/Slavic 1% Tagalog/Filipino 1%
Political lean MEDSL · Snohomish
- 2024 margin
- D (+19.0) · D 57.8% · R 38.9% · Other 3.3%
- 2008→2024 swing
- +0.1pp no change · 2008: 18.9pp · 2024: 19.0pp
- All cycles
- 2024: D+19.0 2020: D+20.6 2016: D+16.6 2012: D+16.2 2008: D+18.9
Not yet ingested
- Civics
- —
Market trends
- HPI YoY
- ▼ -666.16%
- Current HPI
- 305.285
- Rent YoY
- ▲ 2.30%
- Metro
- Seattle-Tacoma-Bellevue, WA
- State GDP YoY
- ▲ 4.65%
- F500 in state
- 22
Industry mix (Fortune 500 HQ in WA)
| Industry | F500 HQs | Revenue |
|---|---|---|
| Retail | 2 | $269B |
|
||
| Technology / Retail | 1 | $638B |
|
||
| Technology | 1 | $245B |
|
||
| Telecommunications | 1 | $38B |
|
||
| Food / Beverage | 1 | $36B |
|
||
| Automotive / Trucks | 1 | $34B |
|
||
Price history
-2.6% since first listed2 events — show timeline
- 2026-03-16 Price Changed $92,400 NWMLS as Distributed by MLS Grid
- 2026-02-14 Listed $94,900 NWMLS as Distributed by MLS Grid
Property tax history
+10.1%/yrLatest (2026): $587 · +0.9% YoY. Source: county tax records.
Cash-flow waterfall
monthlySold comps — $/sqft
last 12 mo · ≤1 miLoading sold comps…