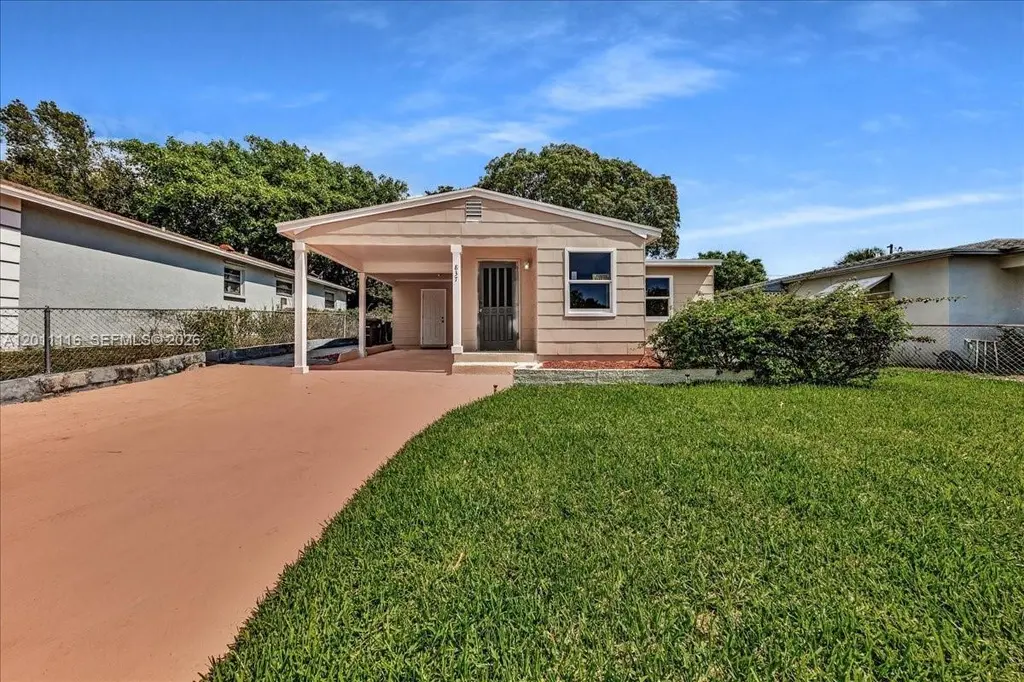
837 30th St · West Palm Beach, FL
Flood risk 1/10 · Minimal
- FEMA flood zone
- X (unshaded)
- Chance of flooding over 30 yrs
- 0.0%
- Est. flood insurance / yr
- $507 – $1,088
Fire risk 1/10 · Minimal
- Est. fire insurance / yr
- $947 – $1,759
Heat risk 10/10 · Severe
- Hot days now (above 105°F)
- 7 days/yr
- Hot days in 30 yrs
- 25 days/yr
Wind risk 10/10 · Severe
- Chance of severe wind over 30 yrs
- 99.0%
Air-quality risk 2/10 · Minimal
- Unhealthy air days now
- 1 days/yr
- Unhealthy air days in 30 yrs
- 1 days/yr
Risk factors via First Street. Map © Google.
Why this score? — see what drove the C- grade
The composite is a weighted blend of 9 inputs, each scored 0–100. Each bar is that input's sub-score; the figure is the points it added to the 100-point composite (weight × sub-score).
- Cash flow +21.3/30.0
- ARV discount +7.5/15.0
- DSCR +6.8/10.0
- 1% rule +5.2/10.0
- Schools +4.3/10.0
- Livability +4.1/5.0
- Rent growth +3.3/5.0
- Condition / age +2.5/5.0
- Appreciation +0.0/10.0
$324,900
🖨 Deal sheet 📄 Offer letter ✓ Due diligence
Listing remarks
Beautifully renovated West Palm Beach home in the desirable Northwood neighborhood offering modern upgrades and turnkey living. This 2-bedroom, 1-bath residence on a spacious fenced in lot. Enjoy a brand-new kitchen, updated flooring, and a fully remodeled interior with tastefully finishes throughout. Brand new hurricane impact windows (2026) provide peace of mind and energy efficiency. The home also includes central AC, a one-car driveway, and a private yard ideal for outdoor enjoyment or future expansion.
Key facts
- 5,325 sq ft lot
- Parking
- Built 1946
Tags
Property features AI
Finance
- Financial info: Pets allowed with no restrictions
Exterior
- Parking: Driveway; Carport with 1 covered space
- Utilities: Public water; Public sewer; Cable available
- Home design: Single-story home; Faces south; Resale property
- Construction: Block construction; Shingle roof
- Exterior features: Patio; Room for pool; Automatic sprinklers
Interior
- Kitchen: Electric range; Refrigerator
- Bedrooms: Bedroom located on the main level
- Flooring: Ceramic tile
- Bathrooms: 1 full bathroom
- Heating & cooling: Central heating; Central air conditioning; Ceiling fan(s)
- Interior features: Impact glass windows; Bedroom on main level; Breakfast area; First floor entry; Combined living and dining room; Tub with shower
- Laundry & utility: Electric water heater
Neighborhood map
What this means for you Summary
Snapshot
- This is a 2-bed/1.0-bath single-family listed at $325k.
Deal economics
- At list price, monthly cash flow is $476 ($6k/yr) — positive.
- The deal already cash-flows at list — no discount required.
- Meets the 1% rule at list price ($3k rent vs $325k).
- Recommended offer: $315k (3.0% below list) — sets the bar for market timing.
- Cap rate 8.1% vs local median 3.8% in West Palm Beach — top-decile yield for the area; either an underpriced asset or a hidden risk that comps aren't pricing in. Stress-test before assuming the spread holds.
Location & tenants
- Location reads 82/100 on livability (#75 in FL, #1,255 nationally) — a professional / high-income tenant draw. Strengths: commute A+, housing A+, health & safety A+; Watch: employment C-, crime F.
- Palm Beach (suburban): math 46% / reading 53% proficiency, ranked #34 of 73 in FL (top 47%) — families likely to look elsewhere, expect single-tenant / working-renter base with shorter leases.
- Market conditions: Rents rising (+3.1%/yr); 305 active listings in the ZIP; 20 comparable units currently listed for rent nearby; rentals at typical pace (median 24d on market — plan ~3-4 weeks tenant-placement turnaround); 3,974 units permitted in Palm Beach County in 2024 (1,012 in 5+ unit buildings).
- At $3,318/mo this rent would consume 66% of the median local household income ($60k/yr) (locally 2157% of renters already pay >50% of income on rent) — very limited rent-growth headroom before tenants either downsize or default.
Forward outlook
- Local home prices are declining (-3.0%/yr); year-one equity from $2k of loan paydown is wiped out by about $10k of value loss. Plan a longer hold.
- Palm Beach County population projected at +30% by 2050 — long-run rental-demand tailwind backs the buy-and-hold thesis.
Negotiation context
- It's been on market 48 days — a 3% lower offer ($315k) is reasonable based on typical stale-listing flexibility.
Risks & watch-outs
- Watch-outs: built in 1946 — expect roof / HVAC / electrical / plumbing capex.
- Climate carrying-cost: severe wind risk, 99% chance of damaging wind over 30y; extreme-heat days projected 7→25/yr by 2055 (HVAC capex compounding) — expect insurance premiums to compound above CPI over the hold.
Questions for the listing agent
- It's been on market 48 days. Have you received any prior offers? Is the seller open to a 3% concession, seller financing, or rate buy-down credit?
- Built in 1946 — when were the roof, HVAC, electrical panel, plumbing, and water heater last replaced?
- Is there a deadline driving the sale (1031 exchange, divorce, estate, relocation)? That informs how much negotiation room exists.
- Crime grade is F in this area — have there been break-ins, vandalism, or insurance claims at this property in the last 3 years? What carrier currently insures it and at what premium?
- What's the average days-on-market for RENTAL listings here right now (not sales)? A rising rental-DOM trend means longer vacancies and softer asking-rent achievability than the comps imply.
- What's the recent tenant-quality profile in this submarket — average credit score on applications, eviction rate, late-payment / NSF rate, and stable-employment percentage? A property-management company in the area should have these aggregated.
- How much new for-sale + rental construction is in the pipeline within 1–3 miles? Heavy new supply typically softens prices + rents 12–24 months out; constrained supply supports both.
Investment metrics
- 1% rule
- 1.02% ✓
- Cap rate
- 8.05%
- Cash-on-cash
- 6.28%
- DSCR
- 1.28
- GRM
- 8.2
CMA / ARV
No comps found within radius.
Projected returns pro-forma
-3.0% appreciation · 3.08% rent growth · sell at horizon
- IRR
- -6.5%
- Equity multiple
- 0.76×
- Total profit
- $-22,069
- Equity at exit
- $48,444
- IRR
- 3.2%
- Equity multiple
- 1.23×
- Total profit
- $20,881
- Equity at exit
- $28,091
Cash invested: $90,972 (down + closing). Projections, not guarantees.
Landlord ↔ Tenant lean methodology
- Overall (STATE)
- 87 Strongly Landlord-Friendly
- State Florida
- 87 Strongly Landlord-Friendly · R+3
- County
- — inherits STATE
- City
- — inherits STATE
ZIP-level market 33407
- Rents YoY
- 3.1%
- Active inventory
- 305
- Price-to-rent
- 8.2×
Monthly cashflow live
- Estimated rent
- $3,318 high interval (Pro) →
- Mortgage (P&I)
- −$1,704
- Tax from tax record
- −$306 /mo · $3,675/yr
- Insurance
- −$135
- HOA
- −$0
- Vacancy / Maint / Mgmt
- −$697
- Net cashflow
- $476
Break-even live
UW: 25.0% down · 7.5% · 30yr · 1.5% tax · 5.0% vac · 8.0% maint · 8.0% mgmt
Financing live
Cash to close
- Down payment
- $81,225
- Closing costs
- $9,747
- Reserves months
- —
- Total cash needed
- —
Loan-product check · same deal, 3 products live
Conventional
25% down · 7.5% · 30yr
- Down + closing
- —
- Monthly P&I
- —
- Monthly cashflow
- —
- DSCR
- —
- Eligible?
- —
Personal DTI + credit; lowest rate.
DSCR
20% down · 8.5% · 30yr
- Down + closing
- —
- Monthly P&I
- —
- Monthly cashflow
- —
- DSCR
- —
- Eligible?
- —
No personal income docs; deal must DSCR.
Hard money
10% down · 12.0% · 12mo
- Down + closing
- —
- Monthly P&I
- —
- Monthly cashflow
- —
- DSCR
- —
- Eligible?
- —
Short-term bridge; refi at stabilization.
Rent comps 20 comps
| Address | Beds | Baths | Sqft | Rent | $/sqft | DOM | Units | Dist |
|---|---|---|---|---|---|---|---|---|
| 933 30th Ct West Palm Beach, FL | 3.0 | 1.5 | 1085 | $3,100 | $2.86 | 24d | 1 | 0.14mi |
| 932 31st St West Palm Beach, FL | 3.0 | 2.0 | 850 | $3,000 | $3.53 | 24d | 1 | 0.15mi |
| 415 32nd St Unit 1 West Palm Beach, FL | 1.0 | 1.0 | 700 | $3,600 | $5.14 | 24d | 1 | 0.49mi |
| 2585 Spruce Ave West Palm Beach, FL | 1.0–2.0 | 1.0–2.0 | 841 | $3,225 | $3.83 | 1d | 122 | 0.51mi |
| 3940 N Flagler Dr #206 West Palm Beach, FL | 1.0 | 1.0 | 1078 | $3,950 | $3.66 | 4d | 1 | 0.68mi |
| 3940 N Flagler Dr #206 West Palm Beach, FL | 1.0 | 1.0 | 1078 | $4,950 | $4.59 | 24d | 1 | 0.68mi |
| 3940 N Flagler Dr #206 West Palm Beach, FL | 1.0 | 1.0 | 1078 | $3,950 | $3.66 | 4d | 1 | 0.68mi |
| 1104 State St Unit C West Palm Beach, FL | 3.0 | 1.0 | 875 | $3,000 | $3.43 | 24d | 1 | 0.73mi |
| 401 42nd St West Palm Beach, FL | 3.0 | 1.0 | 1100 | $4,950 | $4.50 | 24d | 1 | 0.83mi |
| 4444 N Flagler Dr Unit 4334-2008 West Palm Beach, FL | 1.0 | 1.0 | 885 | $4,150 | $4.69 | 24d | 1 | 0.92mi |
| 4444 N Flagler Dr Unit 4444-306 West Palm Beach, FL | 1.0 | 1.0 | 925 | $3,395 | $3.67 | 24d | 1 | 0.92mi |
| 4444 N Flagler Dr West Palm Beach, FL | 1.0 | 1.0 | 765 | $5,263 | $6.88 | 16d | 1 | 0.92mi |
| 4444 N Flagler Dr West Palm Beach, FL | 1.0 | 1.0 | 765 | $4,613 | $6.03 | 3d | 1 | 0.92mi |
| 823 14th St West Palm Beach, FL | 3.0 | 1.0 | 1000 | $3,495 | $3.50 | 24d | 1 | 0.98mi |
| 1801 N Flagler Dr West Palm Beach, FL | 1.0–2.0 | 1.0–2.0 | 998 | $4,250 | $4.26 | 18d | 4 | 1.03mi |
| 1801 N Flagler Dr West Palm Beach, FL | 1.0–2.0 | 1.0–2.0 | 1125 | $4,500 | $4.00 | 2d | 7 | 1.03mi |
| 1801 N Flagler Dr West Palm Beach, FL | 1.0–2.0 | 1.0–2.0 | 998 | $4,250 | $4.26 | 24d | 3 | 1.03mi |
| 1803 N Flagler Dr #310 West Palm Beach, FL | 2.0 | 1.0 | 995 | $3,000 | $3.02 | 18d | 1 | 1.04mi |
| 436 51st St West Palm Beach, FL | 2.0 | 1.0 | 968 | $3,750 | $3.87 | 24d | 1 | 1.19mi |
| 921 8th St West Palm Beach, FL | 3.0 | 1.0 | 1000 | $3,395 | $3.40 | 24d | 1 | 1.38mi |
Listing history 16 events
-
2026-06-18days on market $324,900 Active 48 DOM
-
2026-06-17days on market $324,900 Active 47 DOM
-
2026-06-16days on market $324,900 Active 46 DOM
-
2026-06-15days on market $324,900 Active 45 DOM
-
2026-06-13days on market $324,900 Active 43 DOM
-
2026-06-09days on market $324,900 Active 39 DOM
-
2026-06-08days on market $324,900 Active 38 DOM
-
2026-06-07days on market $324,900 Active 37 DOM
-
2026-06-04days on market $324,900 Active 34 DOM
-
2026-06-03days on market $324,900 Active 33 DOM
-
2026-06-02days on market $324,900 Active 32 DOM
-
2026-06-01days on market $324,900 Active 31 DOM
-
2026-05-31days on market $324,900 Active 30 DOM
-
2026-05-18price $339,750
-
2026-05-03price $349,750
-
2026-05-01$365,000 Active
ⓘ Source: listings_history table (triggers on properties + properties_extension) + one-shot
backfill from property_details.listing_events for pre-trigger history.
Tax reassessment forecast FL · Resets to sale price
- Current annual tax
- $3,675 · $306/mo
- Projected year-2 tax
- $3,675 · $306/mo
- Expected delta
- $0/yr ($0/mo · 0.0%)
ⓘ Screening estimate from a state-policy table — verify with the county assessor before closing.
Climate risk First Street
- Flood 1/10 Low FEMA zone X (unshaded) · 0% chance over 30 yrs
- Wildfire 1/10 Low
- Heat 10/10 Extreme 7 d/yr ≥105°F today · 25 d/yr by 30 yrs out
- Wind 10/10 Extreme 99% chance of damaging wind over 30 yrs
- Air quality 2/10 Low 1 unhealthy d/yr today · 1 by 30 yrs out
Nearby sold comps map
Loading sold comps map…
Walkable amenities ~0.75 mi
Loading nearby amenities…
Taxation est. · year 1
- Rental income
- $39,821
- − Mortgage interest
- −$18,199
- − Property taxes
- −$3,675
- − Insurance
- −$1,624
- − Repairs & maintenance
- −$3,186
- − Management
- −$3,186
- − Depreciation
- −$9,452
- Taxable income
- $499
- Est. tax owed @ 24.0%
- −$120
- After-tax cash flow
- $5,593/yr
For passive investors: Depreciation is non-cash, so a rental often shows a tax loss while cash-flowing — sheltering income. Rental losses are passive: they offset passive income freely, and up to $25,000/yr can offset ordinary (W-2) income if you actively participate and your MAGI is under $100k (phasing out to $0 by $150k); unused losses carry forward. On sale, claimed depreciation is recaptured at up to 25%, and gains may owe capital-gains tax (a 1031 exchange can defer both). Figures are a year-1 estimate at your 24.0% rate — not tax advice; consult a CPA.
Schools (NCES district)
- District
- Palm Beach
- NCES district ID
- 1201500
- Math proficiency
- 46% ▼ -16.00%
- Reading proficiency
- 53% ▼ -4.00%
- Median HH income
- $53,943
- Composite
- 42.72/100
- National rank
- #3160
- State rank
- #34 of 73 in FL
Livability — West Palm Beach
- Score
- 82/100
- State rank
- #75
- US rank
- #1255
Category grades
Schools grade is shown separately in the Schools card above.
Census & demographics
- Census place
- West Palm Beach, FL
- County
- Palm Beach County · 1,438,312 people
- City population
- 222,012
- Metro
- Miami-Fort Lauderdale-Pompano Beach, FL
- Population (ZIP)
- 34,851
- Household income
- $59,993
- Rent vs Own
- Severe rent burden
- 2157.0
Population outlook (Palm Beach County) Hauer SSP2
- Today (2025)
- 1,637,487 people
- By 2030
- 1,743,255 · +6.5%
- By 2040
- 1,948,712 · +19.0%
- By 2050
- 2,132,979 · +30.3%
- By 2075
- 2,530,027 · +54.5%
- By 2100
- 2,706,979 · +65.3%
Race, ethnicity, and origin ACS 2023
- Neighborhood character
- Diverse neighborhood (Simpson 0.62)
- Race & ethnicity
- Black 54% White 21% Hispanic / Latino 20% Two or more races 13% Asian 2%
- Hispanic origin (detail)
- Mexican 2% Puerto Rican 2% Cuban 2%
- Common ancestry
- Hispanic 8% Lithuanian 1% Romanian 1%
- Foreign-born
- 26% · Canada, Vietnam, Jamaica
- Languages at home
- 72% English-only · Spanish 17% French/Haitian/Cajun 8% Other Indo-European 1%
Political lean MEDSL · Palm Beach
- 2024 margin
- Toss-up / Even · D 50.0% · R 49.2%
- 2008→2024 swing
- -22.1pp toward R · 2008: 22.9pp · 2024: 0.8pp
- All cycles
- 2024: D+0.8 2020: D+12.8 2016: D+15.3 2012: D+17.0 2008: D+22.9
Not yet ingested
- Civics
- —
Market trends
- HPI YoY
- ▼ -299.26%
- Current HPI
- 363.3995
- Rent YoY
- ▲ 3.08%
- Metro
- Miami-Fort Lauderdale-Pompano Beach, FL
- State GDP YoY
- ▲ 3.28%
- F500 in state
- 36
Industry mix (Fortune 500 HQ in FL)
| Industry | F500 HQs | Revenue |
|---|---|---|
| Industrial Technology | 2 | $29B |
|
||
| Insurance | 2 | $17B |
|
||
| Retail | 1 | $60B |
|
||
| Technology Distribution | 1 | $58B |
|
||
| Homebuilding | 1 | $35B |
|
||
| Technology Manufacturing | 1 | $35B |
|
||
Price history
-6.9% since first listed3 events — show timeline
- 2026-05-18 Price Changed $339,750 MARMLS
- 2026-05-03 Price Changed $349,750 MARMLS
- 2026-05-01 Listed $365,000 MARMLS
Property tax history
+13.6%/yrLatest (2025): $3,675 · +5.0% YoY. Source: county tax records.
Cash-flow waterfall
monthlySold comps — $/sqft
last 12 mo · ≤1 miLoading sold comps…