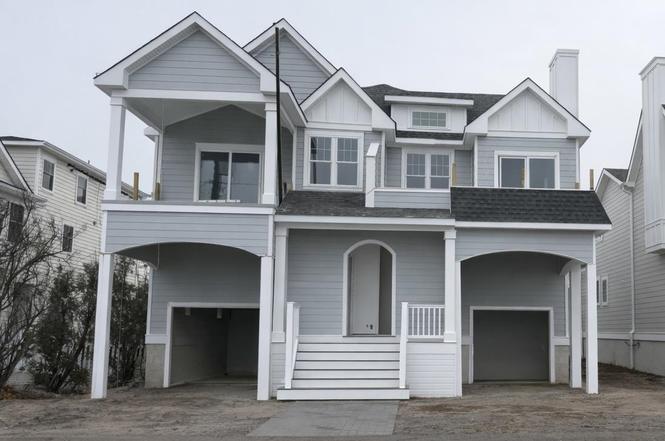
647 W Spruce Ave Unit Right · North Wildwood, NJ
Flood risk No data
- FEMA flood zone
- —
- Chance of flooding over 30 yrs
- —
- Est. flood insurance / yr
- —
Fire risk No data
- Est. fire insurance / yr
- —
Heat risk No data
- Hot days now (above threshold)
- —
- Hot days in 30 yrs
- —
Wind risk No data
- Chance of severe wind over 30 yrs
- —
Air-quality risk No data
- Unhealthy air days now
- —
- Unhealthy air days in 30 yrs
- —
Risk factors via First Street. Map © Google.
Why this score? — see what drove the F grade
The composite is a weighted blend of 9 inputs, each scored 0–100. Each bar is that input's sub-score; the figure is the points it added to the 100-point composite (weight × sub-score).
- Cash flow +12.7/30.0
- Schools +4.4/10.0
- DSCR +3.8/10.0
- 1% rule +3.6/10.0
- Livability +3.4/5.0
- Rent growth +2.5/5.0
- Condition / age +2.5/5.0
- ARV discount +0.0/15.0
- Appreciation +0.0/10.0
$1,150,000
🖨 Deal sheet (PDF) 📄 Offer letter ✓ Due diligence
Listing remarks
Welcome to this exquisite new construction upside-down townhome, ideally located in the sought-after Anglesea section of North Wildwood, offering tranquil water views and spectacular sunsets. With 4 spacious bedrooms and 3 bathrooms, this home seamlessly blends style and functionality. The open concept living area is accentuated by vaulted ceilings and hardwood flooring throughout, creating an airy, welcoming atmosphere. The gourmet kitchen features a stainless-steel appliance package, an island with elegant stone countertops, and custom Legacy brand cabinetry. The bathrooms are adorned with an extensive tile package, adding a touch of luxury to every space. Enjoy outdoor living on the expa
Key facts
- Custom cabinetry
- Water views
- New construction
Tags
Property features AI
Finance
- Other: Located 1 block from the bay
- HOA & community: Condo fee: split insurance
Exterior
- Parking: Garage with automatic door opener for 1 car; Concrete driveway
- Utilities: City water; City sewer; Electric hot water
- Home design: Right unit; New construction
- Exterior features: Water view; Deck/porch; Fenced yard; Cable TV available; Year-round usage; Owners allowed pets
Interior
- Kitchen: Range; Oven; Microwave; Refrigerator; Dishwasher; Garbage disposal; Kitchen center island
- Bedrooms: 4 bedrooms (unit on the right)
- Flooring: Hardwood floors
- Bathrooms: 3 full bathrooms
- Heating & cooling: Natural gas heating with multiple zones; Central air conditioning with multiple zones
- Interior features: Living room; Eat-in kitchen; Dining area; Foyer; Smoke/Fire detector
- Laundry & utility: Laundry/utility room
Neighborhood map
What this means for you Summary
Snapshot
- This is a 4-bed/3.0-bath townhouse listed at $1.15M.
Deal economics
- At list price, monthly cash flow is $-126 ($-2k/yr) — negative.
- To cash-flow at today's rent, offer at most $1.13M (1.6% below list).
- To meet the 1% rule (rent ≥ 1% of price), the offer needs to be $990k (13.9% below list).
- Recommended offer: $990k (13.9% below list) — sets the bar for 1% rule.
- Cap rate 6.2% vs local median 3.6% in North Wildwood — top-decile yield for the area; either an underpriced asset or a hidden risk that comps aren't pricing in. Stress-test before assuming the spread holds.
Location & tenants
- Location reads 68/100 on livability (#318 in NJ) — a middle-class / working-renter tenant base. Strengths: health & safety A+; Watch: amenities C-, crime D-, commute F.
- North Wildwood School District (suburban): math 55% / reading 45% proficiency, ranked #396 of 612 in NJ (top 65%) — acceptable for families but not a draw, mixed tenant base, ~2y average lease.
- Zoned schools: Margaret Mace Elementary School (math 22% / reading 52%, grade F, #528 of 1,303 statewide, top 43%, 169 students, 42% FRL) — zoned schools at 42% FRL track the district average.
- Zoned-school proficiency averages 37% at this address vs 50% district-wide (-13 pts) — the specific schools serving this property underperform the North Wildwood School District average; the district grade overstates school quality for this exact location.
- Market conditions: 436 active listings in the ZIP; 1 comparable units currently listed for rent nearby; 877 units permitted in Cape May County in 2024 (35 in 5+ unit buildings).
Forward outlook
- Local home prices are declining (-3.0%/yr); year-one equity from $8k of loan paydown is wiped out by about $34k of value loss. Plan a longer hold.
- Cape May County population projected at -24% by 2050 — secular population decline; favor cash flow + early exit over multi-decade hold.
Negotiation context
- It's been on market 205 days — a 12% lower offer ($1.01M) is reasonable based on typical stale-listing flexibility.
- 2 sale attempts with the ask held roughly flat each time — persistent listings suggest the price (not the market) is what's stuck; bring a comps-based counter.
Questions for the listing agent
- What do current leases actually rent for vs. the listed asking? Can we see a recent rent roll and the last 12 months of T-12 income?
- It's been on market 205 days. Have you received any prior offers? Is the seller open to a 14% concession, seller financing, or rate buy-down credit?
- Why hasn't it sold? Are there any deal-killer items the seller is aware of (foundation, flood, title, zoning, code violations)?
- Is there a deadline driving the sale (1031 exchange, divorce, estate, relocation)? That informs how much negotiation room exists.
- Crime grade is D in this area — have there been break-ins, vandalism, or insurance claims at this property in the last 3 years? What carrier currently insures it and at what premium?
- The area grade is low — what's the realistic commute time and amenity access for the typical tenant pool here? Any planned neighborhood developments (good or bad) we should know about?
- What's the average days-on-market for RENTAL listings here right now (not sales)? A rising rental-DOM trend means longer vacancies and softer asking-rent achievability than the comps imply.
- What's the recent tenant-quality profile in this submarket — average credit score on applications, eviction rate, late-payment / NSF rate, and stable-employment percentage? A property-management company in the area should have these aggregated.
- How much new for-sale + rental construction is in the pipeline within 1–3 miles? Heavy new supply typically softens prices + rents 12–24 months out; constrained supply supports both.
Investment metrics
- 1% rule
- 0.86% ✗
- Cap rate
- 6.16%
- Cash-on-cash
- -0.47%
- DSCR
- 0.98
- GRM
- 9.7
CMA / ARV
- ARV (on-the-fly)
- $933,912
- Comps found
- 12
Show comp detail 12 sales within ~0.75 mi
| Address | Dist | Beds/Ba | Sqft | Sold | Price | $/sf | Match |
|---|---|---|---|---|---|---|---|
| 643 W Spruce Ave Unit Right | 0.00mi | 4/3.5 | 2,289 (0%) | 1mo | $1,025,000 | $448 | 97 |
| 645 W Spruce Ave Unit left | 0.00mi | 4/3.5 | 2,289 (0%) | 1mo | $999,999 | $437 | 97 |
| 406 Illinois Ave #406 | 0.25mi | 4/3.5 | 2,248 (-2%) | 7mo | $1,250,000 | $556 | 78 |
| 651 W Spruce Ave Unit North 651A | 0.02mi | 4/3.0 | 2,154 (-6%) | 21mo | $858,000 | $398 | 71 |
| 4101 Seaboard Cir Unit C4101 | 0.42mi | 3/2.0 (-1) | 2,183 (-5%) | 1mo | $891,000 | $408 | 63 |
| 3 Mace Ave Unit A | 0.46mi | 3/2.5 (-1) | 2,400 (+5%) | 8mo | $995,000 | $415 | 57 |
| 3401 Seaboard Cir #3401 | 0.42mi | 4/3.0 | 2,500 (+9%) | 10mo | $900,000 | $360 | 57 |
| 4304 Seaboard Cir #4304 | 0.42mi | 3/2.0 (-1) | 2,030 (-11%) | 8mo | $765,000 | $377 | 46 |
| 4102 Seaboard Cir #4102 | 0.42mi | 3/2.0 (-1) | 1,960 (-14%) | 7mo | $719,000 | $367 | 42 |
| 115 W 5th Ave #115 | 0.74mi | 4/3.5 | 2,400 (+5%) | 18mo | $1,170,000 | $488 | 40 |
| 1204 Seaboard Cir #1204 | 0.42mi | 3/2.0 (-1) | 2,030 (-11%) | 20mo | $812,500 | $400 | 36 |
| 4303 Seaboard Cir #4303 | 0.42mi | 3/2.0 (-1) | 2,030 (-11%) | 21mo | $710,000 | $350 | 35 |
Match score weights: distance 35% · size 25% · config 20% · recency 20%. Top-matched comps best support the ARV.
Projected returns pro-forma
-3.0% appreciation · 3.0% rent growth · sell at horizon
- IRR
- -17.1%
- Equity multiple
- 0.40×
- Total profit
- $-194,250
- Equity at exit
- $171,469
- IRR
- -9.0%
- Equity multiple
- 0.44×
- Total profit
- $-178,908
- Equity at exit
- $99,431
Cash invested: $322,000 (down + closing). Projections, not guarantees.
Landlord ↔ Tenant lean methodology
- Overall (STATE)
- 21 Tenant-Leaning
- State New Jersey
- 21 Tenant-Leaning · D+6
- County
- — inherits STATE
- City
- — inherits STATE
ZIP-level market 08260
- Home prices YoY
- -30.7%
- Active inventory
- 436
- Price-to-rent
- 9.7×
Monthly cashflow live
- Estimated rent
- $9,900 medium interval (Pro) →
- Mortgage (P&I)
- −$6,031
- Tax est. 1.5%
- −$1,438 /mo · $17,250/yr
- Insurance
- −$479
- HOA
- −$0
- Vacancy / Maint / Mgmt
- −$2,079
- Net cashflow
- $-126
Break-even live
Sensitivity live
| Price | -10% $668 | -5% $271 | +0% $-126 | +5% $-524 | +10% $-921 |
|---|---|---|---|---|---|
| Rent | -10% $-908 | -5% $-517 | +0% $-126 | +5% $265 | +10% $656 |
| Rate | -1.0pp $453 | -0.5pp $166 | base $-126 | +0.5pp $-424 | +1.0pp $-728 |
UW: 25.0% down · 7.5% · 30yr · 1.5% tax · 5.0% vac · 8.0% maint · 8.0% mgmt
Financing live
Cash to close
- Down payment
- $287,500
- Closing costs
- $34,500
- Reserves months
- —
- Total cash needed
- —
Loan-product check · same deal, 3 products live
Conventional
25% down · 7.5% · 30yr
- Down + closing
- —
- Monthly P&I
- —
- Monthly cashflow
- —
- DSCR
- —
- Eligible?
- —
Personal DTI + credit; lowest rate.
DSCR
20% down · 8.5% · 30yr
- Down + closing
- —
- Monthly P&I
- —
- Monthly cashflow
- —
- DSCR
- —
- Eligible?
- —
No personal income docs; deal must DSCR.
Hard money
10% down · 12.0% · 12mo
- Down + closing
- —
- Monthly P&I
- —
- Monthly cashflow
- —
- DSCR
- —
- Eligible?
- —
Short-term bridge; refi at stabilization.
Rent comps 1 comps
| Address | Beds | Baths | Sqft | Rent | $/sqft | DOM | Units | Dist |
|---|---|---|---|---|---|---|---|---|
| 96 Seaspray Ct Wildwood, NJ | 3.0 | 2.5 | 1650 | $9,900 | $6.00 | 45d | 1 | 0.16mi |
Listing history 19 events
-
2026-06-21days on market $1,150,000 Active 205 DOM
-
2026-06-21days on market $1,150,000 Active 204 DOM
-
2026-06-18days on market $1,150,000 Active 202 DOM
-
2026-06-17days on market $1,150,000 Active 201 DOM
-
2026-06-16days on market $1,150,000 Active 200 DOM
-
2026-06-15days on market $1,150,000 Active 199 DOM
-
2026-06-13days on market $1,150,000 Active 197 DOM
-
2026-06-12days on market $1,150,000 Active 196 DOM
-
2026-06-09days on market $1,150,000 Active 193 DOM
-
2026-06-08days on market $1,150,000 Active 192 DOM
-
2026-06-07days on market $1,150,000 Active 191 DOM
-
2026-06-07days on market $1,150,000 Active 190 DOM
-
2026-06-04days on market $1,150,000 Active 187 DOM
-
2026-06-02days on market $1,150,000 Active 186 DOM
-
2026-06-01days on market $1,150,000 Active 185 DOM
-
2026-05-31days on market $1,150,000 Active 184 DOM
-
2026-05-21status Active
-
2026-04-29historical Withdrawn/Temp Off Market
-
2025-11-06$1,150,000 Active
ⓘ Source: listings_history table (triggers on properties + properties_extension) + one-shot
backfill from property_details.listing_events for pre-trigger history.
Nearby sold comps map
Loading sold comps map…
Walkable amenities ~0.75 mi
Loading nearby amenities…
Taxation est. · year 1
- Rental income
- $118,800
- − Mortgage interest
- −$64,418
- − Property taxes
- −$17,250
- − Insurance
- −$5,750
- − Repairs & maintenance
- −$9,504
- − Management
- −$9,504
- − Depreciation
- −$33,455
- Taxable loss
- −$21,080
- Est. tax savings @ 24.0%
- +$5,059
- After-tax cash flow
- $3,543/yr
For passive investors: Depreciation is non-cash, so a rental often shows a tax loss while cash-flowing — sheltering income. Rental losses are passive: they offset passive income freely, and up to $25,000/yr can offset ordinary (W-2) income if you actively participate and your MAGI is under $100k (phasing out to $0 by $150k); unused losses carry forward. On sale, claimed depreciation is recaptured at up to 25%, and gains may owe capital-gains tax (a 1031 exchange can defer both). Figures are a year-1 estimate at your 24.0% rate — not tax advice; consult a CPA.
Schools (NCES district)
- District
- North Wildwood School District
- NCES district ID
- 3411670
- Math proficiency
- 55% ▲ 5.00%
- Reading proficiency
- 45% ▬ 0.00%
- Median HH income
- $45,310
- Composite
- 44.38/100
- National rank
- #6123
- State rank
- #396 of 612 in NJ
Livability — North Wildwood
- Score
- 68/100
- State rank
- #318
- US rank
- #9827
Category grades
Schools grade is shown separately in the Schools card above.
Census & demographics
- Census place
- North Wildwood, NJ
- Population (ZIP)
- 12,913
Population outlook (Cape May County) Hauer SSP2
- Today (2025)
- 88,234 people
- By 2030
- 84,144 · -4.6%
- By 2040
- 75,146 · -14.8%
- By 2050
- 67,389 · -23.6%
- By 2075
- 55,732 · -36.8%
- By 2100
- 44,972 · -49.0%
Race, ethnicity, and origin ACS 2023
- Neighborhood character
- Predominantly White (78%)
- Race & ethnicity
- White 78% Hispanic / Latino 14% Two or more races 7% Black 3% Native American 1%
- Hispanic origin (detail)
- Mexican 10% Puerto Rican 3%
- Common ancestry
- Romanian 7% Slovak 2% Lithuanian 1%
- Foreign-born
- 9% · Canada
- Languages at home
- 84% English-only · Spanish 12% Other Indo-European 3% French/Haitian/Cajun 1%
Political lean MEDSL · Cape May
- 2024 margin
- R (+19.2) · D 39.7% · R 58.9% · Other 1.4%
- 2008→2024 swing
- -10.6pp toward R · 2008: -8.7pp · 2024: -19.2pp
- All cycles
- 2024: R+19.2 2020: R+15.9 2016: R+19.9 2012: R+8.9 2008: R+8.7
Not yet ingested
- Civics
- —
Market trends
- HPI YoY
- ▼ -243.83%
- Current HPI
- 551.3393
- Rent YoY
- —
- Metro
- —
- State GDP YoY
- ▲ 2.05%
- F500 in state
- 34
Industry mix (Fortune 500 HQ in NJ)
| Industry | F500 HQs | Revenue |
|---|---|---|
| Consumer Goods | 3 | $31B |
|
||
| Pharmaceuticals | 2 | $153B |
|
||
| Technology | 2 | $21B |
|
||
| Insurance | 2 | $20B |
|
||
| Healthcare | 2 | $19B |
|
||
| Financial Services | 1 | $70B |
|
||
Price history
3 events — show timeline
- 2026-05-21 Relisted — CMCMLS
- 2026-04-29 Delisted — CMCMLS
- 2025-11-06 Listed $1,150,000 CMCMLS
Cash-flow waterfall
monthlySold comps — $/sqft
last 12 mo · ≤1 miLoading sold comps…