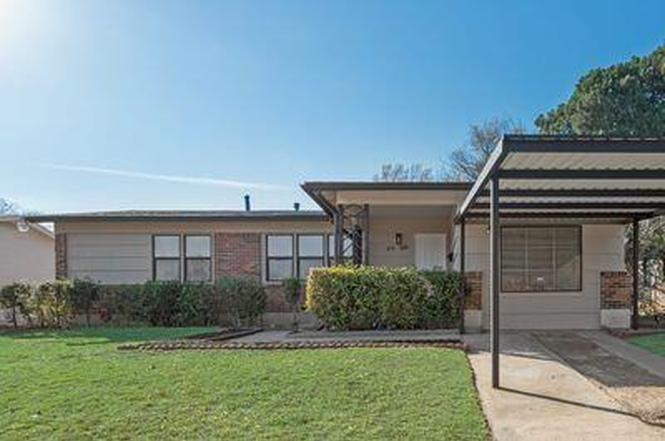
4119 Fortune Ln · Dallas, TX
Flood risk 1/10 · Minimal
- FEMA flood zone
- X (unshaded)
- Chance of flooding over 30 yrs
- 0.0%
- Est. flood insurance / yr
- $507 – $1,088
Fire risk 1/10 · Minimal
- Est. fire insurance / yr
- $1,222 – $2,270
Heat risk 7/10 · Major
- Hot days now (above 110°F)
- 7 days/yr
- Hot days in 30 yrs
- 25 days/yr
Wind risk 6/10 · Moderate
- Chance of severe wind over 30 yrs
- 27.0%
Air-quality risk 2/10 · Minimal
- Unhealthy air days now
- 1 days/yr
- Unhealthy air days in 30 yrs
- 2 days/yr
Risk factors via First Street. Map © Google.
Why this score? — see what drove the C- grade
The composite is a weighted blend of 9 inputs, each scored 0–100. Each bar is that input's sub-score; the figure is the points it added to the 100-point composite (weight × sub-score).
- ARV discount +15.0/15.0
- Cash flow +14.1/30.0
- 1% rule +4.7/10.0
- DSCR +4.3/10.0
- Livability +4.0/5.0
- Rent growth +3.6/5.0
- Schools +2.8/10.0
- Condition / age +2.5/5.0
- Appreciation +0.0/10.0
$241,999
🖨 Deal sheet (PDF) 📄 Offer letter ✓ Due diligence
Listing remarks
Well Priced With Motivated Seller! See this charming and newly updated home offering the perfect blend of original character and modern upgrades. This spacious 3-bedroom property features two inviting living areas, a large sunroom filled with natural light, and original hardwood floors that bring timeless beauty throughout the home. The beautifully remodeled interior includes new fixtures, fresh paint inside and out, and a stunning stone fireplace that serves as a warm and stylish focal point. The bright breakfast nook just off the sunroom creates the perfect spot to enjoy your morning coffee. Step outside to a generous backyard, ideal for gatherings, play, or gardening. Covered parking fo
Key facts
- Remodeled interior
- Fresh paint
- Large sunroom
Tags
Property features AI
Finance
- Other: Deed restrictions; Possession at closing/funding
- Financial info: Listing accepts Cash, Conventional, FHA, and VA financing; Special taxing entities: No
- HOA & community: No association
Exterior
- Parking: Carport (covered) with 2 spaces
- Utilities: City water; City sewer; Not in a municipal utility district
- Home design: Single-family residence; One story; Residential property
- Construction: Built in 1955; Brick and wood construction; Composition roof; Other foundation
- Exterior features: Lot less than 0.5 acre; Subdivision: Marsalis Park
Interior
- Kitchen: Gas oven; Gas range
- Bedrooms: 3 bedrooms (all on the main level)
- Flooring: Ceramic tile; Hardwood; Laminate
- Bathrooms: 1 full bathroom; 1 half bathroom
- Heating & cooling: Central heating; Central air conditioning; Stone fireplace
- Interior features: Chandelier; Eat-in kitchen; Skylights; Three living areas; Two dining areas; Room count: 11
- Laundry & utility: Utility room; Full-size washer/dryer area; Gas water heater
Neighborhood map
What this means for you Summary
Snapshot
- This is a 3-bed/1.5-bath single-family listed at $242k.
Deal economics
- At list price, monthly cash flow is $34 ($407/yr) — positive.
- The deal already cash-flows at list — no discount required.
- To meet the 1% rule (rent ≥ 1% of price), the offer needs to be $236k (2.5% below list).
- Recommended offer: $213k (12.0% below list) — sets the bar for market timing.
- Cap rate 6.5% vs local median 2.3% in Dallas — top-decile yield for the area; either an underpriced asset or a hidden risk that comps aren't pricing in. Stress-test before assuming the spread holds.
Location & tenants
- Location reads 81/100 on livability (#24 in TX, #1,380 nationally) — a professional / high-income tenant draw. Strengths: amenities A+, commute A+, housing A+; Watch: crime F.
- Dallas ISD (urban): math 31% / reading 36% proficiency, ranked #559 of 826 in TX (top 68%) — families likely to look elsewhere, expect single-tenant / working-renter base with shorter leases; 83% free/reduced lunch — lower-income household profile, screen leases tightly.
- Zoned schools: Clara Oliver El (math 27% / reading 37%, grade F, #2,268 of 4,322 statewide, top 55%, 204 students, 92% FRL); Boude Storey Middle (math 23% / reading 31%, grade F, #1,177 of 1,662 statewide, top 72%, 445 students, 98% FRL); South Oak Cliff H S (math 12% / reading 17%, grade F, #1,522 of 1,632 statewide, top 94%, 1,513 students, 94% FRL).
- Market conditions: Rents rising fast (+4.2%/yr); 253 active listings in the ZIP; 10 comparable units currently listed for rent nearby; rentals at typical pace (median 21d on market — plan ~3-4 weeks tenant-placement turnaround); 40% of comp listings sitting > 30 days — soft ceiling on asking rent; lower-income renter base — watch delinquency; 12,577 units permitted in Dallas County in 2024 (6,829 in 5+ unit buildings).
- At $2,359/mo this rent would consume 68% of the median local household income ($41k/yr) (locally 2465% of renters already pay >50% of income on rent) — very limited rent-growth headroom before tenants either downsize or default.
Forward outlook
- Local home prices are declining (-3.0%/yr); year-one equity from $2k of loan paydown is wiped out by about $7k of value loss. Plan a longer hold.
- Dallas County population projected at +35% by 2050 — long-run rental-demand tailwind backs the buy-and-hold thesis.
Negotiation context
- It's been on market 165 days — a 12% lower offer ($213k) is reasonable based on typical stale-listing flexibility.
- 3 sale attempts since 3y ago; this cycle's ask has dropped $23k (9%) from the opening price — seller is motivated, your offer sets the floor, not the list.
Risks & watch-outs
- Watch-outs: built in 1955 — expect roof / HVAC / electrical / plumbing capex.
- Climate carrying-cost: major wind risk, 27% chance of damaging wind over 30y; extreme-heat days projected 7→25/yr by 2055 (HVAC capex compounding) — expect insurance premiums to compound above CPI over the hold.
Questions for the listing agent
- It's been on market 165 days. Have you received any prior offers? Is the seller open to a 12% concession, seller financing, or rate buy-down credit?
- Built in 1955 — when were the roof, HVAC, electrical panel, plumbing, and water heater last replaced?
- Why hasn't it sold? Are there any deal-killer items the seller is aware of (foundation, flood, title, zoning, code violations)?
- Is there a deadline driving the sale (1031 exchange, divorce, estate, relocation)? That informs how much negotiation room exists.
- Crime grade is F in this area — have there been break-ins, vandalism, or insurance claims at this property in the last 3 years? What carrier currently insures it and at what premium?
- What's the average days-on-market for RENTAL listings here right now (not sales)? A rising rental-DOM trend means longer vacancies and softer asking-rent achievability than the comps imply.
- What's the recent tenant-quality profile in this submarket — average credit score on applications, eviction rate, late-payment / NSF rate, and stable-employment percentage? A property-management company in the area should have these aggregated.
- How much new for-sale + rental construction is in the pipeline within 1–3 miles? Heavy new supply typically softens prices + rents 12–24 months out; constrained supply supports both.
Investment metrics
- 1% rule
- 0.97% ✗
- Cap rate
- 6.46%
- Cash-on-cash
- 0.60%
- DSCR
- 1.03
- GRM
- 8.5
CMA / ARV
- ARV (on-the-fly)
- $298,812
- Comps found
- 8
Show comp detail 8 sales within ~0.75 mi
| Address | Dist | Beds/Ba | Sqft | Sold | Price | $/sf | Match |
|---|---|---|---|---|---|---|---|
| 4119 Fortune Ln | 0.00mi | 3/1.5 | 2,019 (0%) | 1mo | $241,999 | $120 | 99 |
| 3916 S Marsalis Ave | 0.18mi | 3/3.0 | 2,000 (-1%) | 13mo | $240,000 | $120 | 73 |
| 4141 Huckleberry Cir | 0.38mi | 4/2.0 (+1) | 1,896 (-6%) | 8mo | $279,900 | $148 | 58 |
| 3920 Vanette Ln | 0.19mi | 4/2.0 (+1) | 1,732 (-14%) | 5mo | $265,000 | $153 | 56 |
| 4310 Utah Ave | 0.43mi | 3/2.0 | 1,759 (-13%) | 1mo | $185,000 | $105 | 56 |
| 3907 Vanette Ln | 0.24mi | 4/2.0 (+1) | 1,748 (-13%) | 15mo | $299,999 | $172 | 47 |
| 1354 E Ann Arbor Ave | 0.66mi | 4/2.0 (+1) | 1,910 (-5%) | 21mo | $240,000 | $126 | 36 |
| 3418 Arizona Ave | 0.58mi | 4/2.5 (+1) | 2,234 (+11%) | 12mo | $440,000 | $197 | 36 |
Match score weights: distance 35% · size 25% · config 20% · recency 20%. Top-matched comps best support the ARV.
Projected returns pro-forma
-3.0% appreciation · 4.2% rent growth · sell at horizon
- IRR
- -13.8%
- Equity multiple
- 0.50×
- Total profit
- $-34,038
- Equity at exit
- $36,083
- IRR
- -2.9%
- Equity multiple
- 0.79×
- Total profit
- $-14,199
- Equity at exit
- $20,924
Cash invested: $67,760 (down + closing). Projections, not guarantees.
Landlord ↔ Tenant lean methodology
- Overall (STATE)
- 87 Strongly Landlord-Friendly
- State Texas
- 87 Strongly Landlord-Friendly · R+5
- County
- — inherits STATE
- City
- — inherits STATE
ZIP-level market 75216
- Home prices YoY
- -29.7%
- Rents YoY
- 4.2%
- Active inventory
- 253
- Price-to-rent
- 8.5×
Monthly cashflow live
- Estimated rent
- $2,359 high interval (Pro) →
- Mortgage (P&I)
- −$1,269
- Tax from tax record
- −$460 /mo · $5,514/yr
- Insurance
- −$101
- HOA
- −$0
- Vacancy / Maint / Mgmt
- −$495
- Net cashflow
- $34
Break-even live
Sensitivity live
| Price | -10% $171 | -5% $102 | +0% $34 | +5% $-35 | +10% $-103 |
|---|---|---|---|---|---|
| Rent | -10% $-152 | -5% $-59 | +0% $34 | +5% $127 | +10% $220 |
| Rate | -1.0pp $156 | -0.5pp $96 | base $34 | +0.5pp $-29 | +1.0pp $-93 |
UW: 25.0% down · 7.5% · 30yr · 1.5% tax · 5.0% vac · 8.0% maint · 8.0% mgmt
Financing live
Cash to close
- Down payment
- $60,500
- Closing costs
- $7,260
- Reserves months
- —
- Total cash needed
- —
Loan-product check · same deal, 3 products live
Conventional
25% down · 7.5% · 30yr
- Down + closing
- —
- Monthly P&I
- —
- Monthly cashflow
- —
- DSCR
- —
- Eligible?
- —
Personal DTI + credit; lowest rate.
DSCR
20% down · 8.5% · 30yr
- Down + closing
- —
- Monthly P&I
- —
- Monthly cashflow
- —
- DSCR
- —
- Eligible?
- —
No personal income docs; deal must DSCR.
Hard money
10% down · 12.0% · 12mo
- Down + closing
- —
- Monthly P&I
- —
- Monthly cashflow
- —
- DSCR
- —
- Eligible?
- —
Short-term bridge; refi at stabilization.
Rent comps 10 comps
| Address | Beds | Baths | Sqft | Rent | $/sqft | DOM | Units | Dist |
|---|---|---|---|---|---|---|---|---|
| 1209 Grinnell St Dallas, TX | 4.0 | 2.0 | 1892 | $2,150 | $1.14 | 3d | 1 | 0.51mi |
| 3806 Morning Springs Trl Dallas, TX | 3.0 | 2.0 | 1512 | $2,300 | $1.52 | 20d | 1 | 0.92mi |
| 4918 Rockport Dr Dallas, TX | 3.0 | 2.0 | 1673 | $1,800 | $1.08 | 9d | 1 | 0.98mi |
| 532 W Five Mile Pkwy Dallas, TX | 3.0 | 2.5 | 2115 | $3,500 | $1.65 | 9d | 1 | 1.01mi |
| 1510 Maywood Ave Dallas, TX | 4.0 | 2.5 | 1869 | $2,220 | $1.19 | 45d | 1 | 1.04mi |
| 621 Tarryall Dr Dallas, TX | 4.0 | 2.0 | 1756 | $2,200 | $1.25 | 9d | 1 | 1.05mi |
| 2844 S Marsalis Ave Dallas, TX | 3.0 | 3.5 | 1788 | $2,300 | $1.29 | 45d | 1 | 1.22mi |
| 2842 S Marsalis Ave Dallas, TX | 3.0 | 3.5 | 1788 | $2,300 | $1.29 | 45d | 1 | 1.22mi |
| 2830 S Marsalis Ave Dallas, TX | 4.0 | 2.0 | 1960 | $3,000 | $1.53 | 45d | 1 | 1.25mi |
| 2628 S Marsalis Ave Dallas, TX | 4.0 | 2.0 | 1656 | $2,120 | $1.28 | 1d | 1 | 1.50mi |
Listing history 11 events
-
2026-05-13status Pending
-
2026-05-01historical Active Option Contract
-
2026-04-17price $241,999
-
2026-03-31price $246,999
-
2026-03-31status Active
-
2026-03-12price $254,999
-
2026-02-16price $259,900
-
2025-11-14$265,000 Active
-
2023-08-22historical $1,850
-
2023-08-05$1,850
-
2022-08-01soldstatus
ⓘ Source: listings_history table (triggers on properties + properties_extension) + one-shot
backfill from property_details.listing_events for pre-trigger history.
Tax reassessment forecast TX · Resets to sale price
- Current annual tax
- $5,514 · $460/mo
- Projected year-2 tax
- $5,514 · $460/mo
- Expected delta
- $0/yr ($0/mo · 0.0%)
ⓘ Screening estimate from a state-policy table — verify with the county assessor before closing.
Climate risk First Street
- Flood 1/10 Low FEMA zone X (unshaded) · 0% chance over 30 yrs
- Wildfire 1/10 Low
- Heat 7/10 Severe 7 d/yr ≥110°F today · 25 d/yr by 30 yrs out
- Wind 6/10 Major 27% chance of damaging wind over 30 yrs
- Air quality 2/10 Low 1 unhealthy d/yr today · 2 by 30 yrs out
Nearby sold comps map
Loading sold comps map…
Walkable amenities ~0.75 mi
Loading nearby amenities…
Taxation est. · year 1
- Rental income
- $28,305
- − Mortgage interest
- −$13,556
- − Property taxes
- −$5,514
- − Insurance
- −$1,210
- − Repairs & maintenance
- −$2,264
- − Management
- −$2,264
- − Depreciation
- −$7,040
- Taxable loss
- −$3,544
- Est. tax savings @ 24.0%
- +$851
- After-tax cash flow
- $1,258/yr
For passive investors: Depreciation is non-cash, so a rental often shows a tax loss while cash-flowing — sheltering income. Rental losses are passive: they offset passive income freely, and up to $25,000/yr can offset ordinary (W-2) income if you actively participate and your MAGI is under $100k (phasing out to $0 by $150k); unused losses carry forward. On sale, claimed depreciation is recaptured at up to 25%, and gains may owe capital-gains tax (a 1031 exchange can defer both). Figures are a year-1 estimate at your 24.0% rate — not tax advice; consult a CPA.
Schools (NCES district)
- District
- Dallas ISD
- NCES district ID
- 4816230
- Math proficiency
- 31% ▼ -16.00%
- Reading proficiency
- 36% ▼ -4.00%
- Median HH income
- $42,881
- Composite
- 28.41/100
- National rank
- #6763
- State rank
- #559 of 826 in TX
Livability — Dallas
- Score
- 81/100
- State rank
- #24
- US rank
- #1380
Category grades
Schools grade is shown separately in the Schools card above.
Census & demographics
- Census place
- Dallas, TX
- County
- Dallas County · 2,612,404 people
- City population
- 1,168,437
- Metro
- Dallas-Fort Worth-Arlington, TX
- Population (ZIP)
- 55,894
- Household income
- $41,386
- Rent vs Own
- Severe rent burden
- 2465.0
Population outlook (Dallas County) Hauer SSP2
- Today (2025)
- 2,979,839 people
- By 2030
- 3,191,823 · +7.1%
- By 2040
- 3,619,611 · +21.5%
- By 2050
- 4,026,915 · +35.1%
- By 2075
- 4,957,073 · +66.4%
- By 2100
- 5,508,725 · +84.9%
Race, ethnicity, and origin ACS 2023
- Neighborhood character
- Majority Black (51%)
- Race & ethnicity
- Black 51% Hispanic / Latino 44% Two or more races 14% White 3%
- Hispanic origin (detail)
- Mexican 40%
- Common ancestry
- Hispanic 1%
- Foreign-born
- 17% · Canada
- Languages at home
- 62% English-only · Spanish 37%
Political lean MEDSL · Dallas
- 2024 margin
- Strong D (+22.2) · D 60.2% · R 38.0% · Other 1.8%
- 2008→2024 swing
- +6.9pp toward D · 2008: 15.3pp · 2024: 22.2pp
- All cycles
- 2024: D+22.2 2020: D+31.6 2016: D+26.2 2012: D+15.4 2008: D+15.3
Not yet ingested
- Civics
- —
Market trends
- HPI YoY
- ▼ -126.35%
- Current HPI
- 299.1825
- Rent YoY
- ▲ 4.20%
- Metro
- Dallas-Fort Worth-Arlington, TX
- State GDP YoY
- ▲ 3.95%
- F500 in state
- 110
Industry mix (Fortune 500 HQ in TX)
| Industry | F500 HQs | Revenue |
|---|---|---|
| Energy | 16 | $1,198B |
|
||
| Technology | 5 | $198B |
|
||
| Engineering / Construction | 4 | $72B |
|
||
| Energy Services | 3 | $60B |
|
||
| Utilities | 3 | $41B |
|
||
| Healthcare | 2 | $330B |
|
||
Price history
+12981.0% since first listed11 events — show timeline
- 2026-05-13 Pending — NTREIS
- 2026-05-01 Contingent — NTREIS
- 2026-04-17 Price Changed $241,999 NTREIS
- 2026-03-31 Price Changed $246,999 NTREIS
- 2026-03-31 Relisted — NTREIS
- 2026-03-12 Price Changed $254,999 NTREIS
- 2026-02-16 Price Changed $259,900 NTREIS
- 2025-11-14 Listed $265,000 NTREIS
- 2023-08-22 Rental Removed $1,850 NTREIS
- 2023-08-05 Listed for Rent $1,850 NTREIS
- 2022-08-01 Sold (Public Records) — Public Records
Property tax history
+8.9%/yrLatest (2025): $5,514 · -0.4% YoY. Source: county tax records.
Cash-flow waterfall
monthlySold comps — $/sqft
last 12 mo · ≤1 miLoading sold comps…