 13-Plex
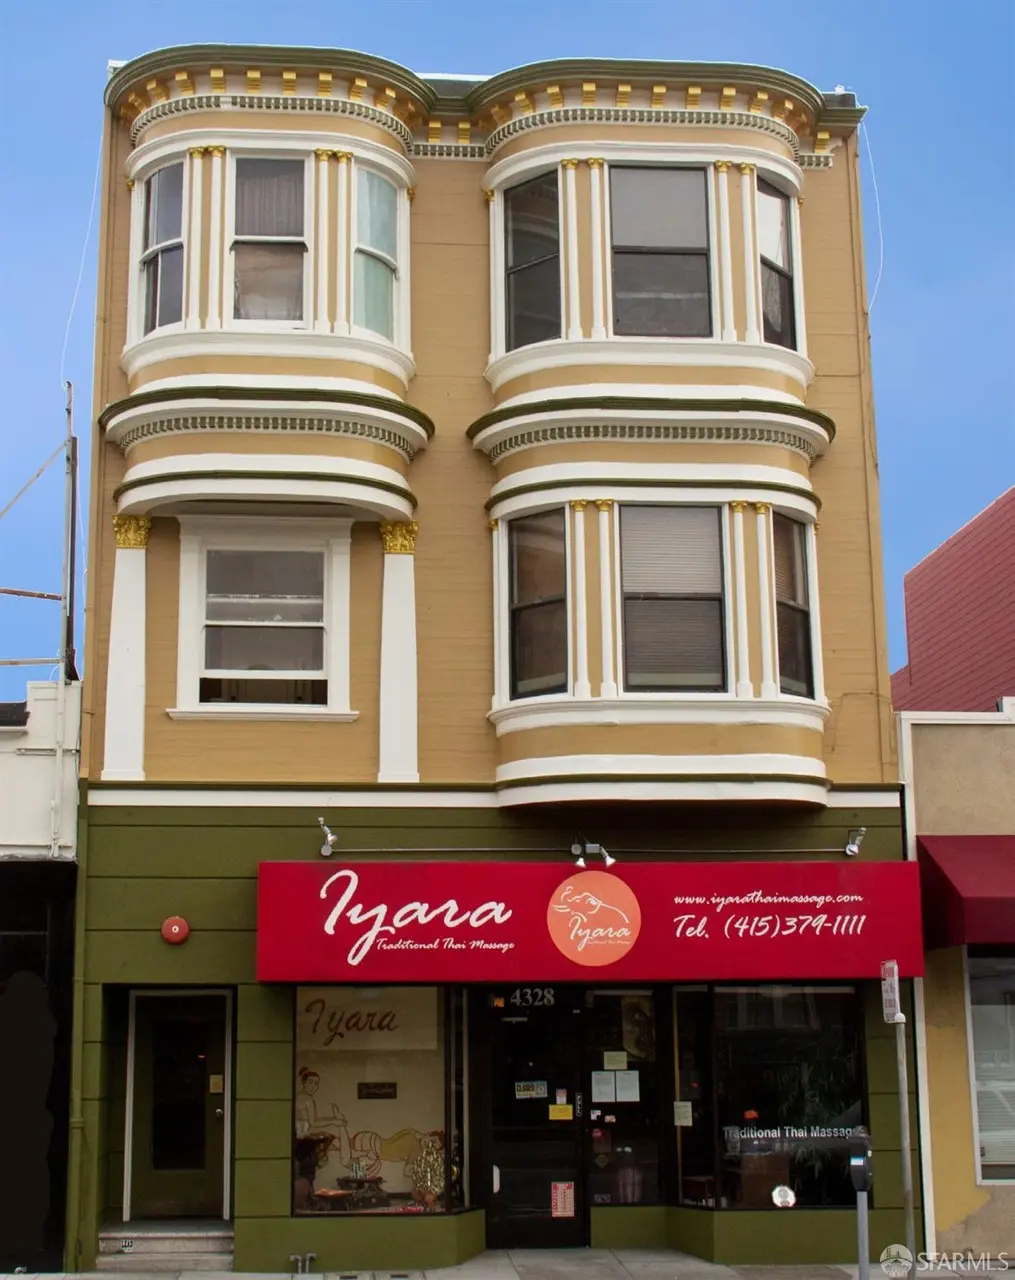
4328-4330 Geary Blvd · San Francisco, CA
Flood risk 6/10 · Moderate
- FEMA flood zone
- X (unshaded)
- Chance of flooding over 30 yrs
- 0.71%
- Est. flood insurance / yr
- $507 – $1,088
Fire risk 1/10 · Minimal
- Est. fire insurance / yr
- $659 – $1,223
Heat risk 2/10 · Minimal
- Hot days now (above 78°F)
- 7 days/yr
- Hot days in 30 yrs
- 17 days/yr
Wind risk 1/10 · Minimal
- Chance of severe wind over 30 yrs
- —
Air-quality risk 7/10 · Major
- Unhealthy air days now
- 13 days/yr
- Unhealthy air days in 30 yrs
- 13 days/yr
Risk factors via First Street. Map © Google.
Why this score? — see what drove the B+ grade
The composite is a weighted blend of 9 inputs, each scored 0–100. Each bar is that input's sub-score; the figure is the points it added to the 100-point composite (weight × sub-score).
- Cash flow +30.0/30.0
- 1% rule +10.0/10.0
- DSCR +10.0/10.0
- Appreciation +9.0/10.0
- Rent growth +5.0/5.0
- Schools +5.0/10.0
- Livability +3.8/5.0
- Condition / age +2.5/5.0
- ARV discount +0.0/15.0
$2,475,000
🖨 Deal sheet 📄 Offer letter ✓ Due diligence
Multi-family units
County records classify this as Multi-Family (5+ Unit). Listing-text estimate: 13 units. confirmed
5+ unit building — per-unit beds/baths from public records are typically unavailable; the breakdown below (if shown) is an estimate from the listing text.
Listing remarks MLS
4328 Geary Boulevard is a beautiful Edwardian 13-unit mixed-use building located in the heart of San Francisco's Inner Richmond neighborhood. The property features 12 SRO units11 of which include kitchenettes and 4 renovated shared bathrooms, along with a well-established Traditional Thai Massage business occupying the ground-floor commercial space. The building offers strong commercial rents and an exceptional return on investment. Ideally positioned along the Geary commercial corridor, the property benefits from high foot traffic, proximity to popular restaurants, cafes, and neighborhood conveniences, and easy access to public transit connecting directly to Downtown and major tech employment hubs. This prime tech and transit location combines steady income potential with long-term value appreciation in one of San Francisco's most desirable districts.
Key facts
- Edwardian building
- Mixed-use building
- High foot traffic
Tags
Neighborhood map
What this means for you Summary
Snapshot
- This is a 13 × 1-bed/1-bath units multifamily listed at $2.48M.
Deal economics
- At list price, monthly cash flow is $13k ($155k/yr) — positive. Per door: $993/mo.
- The deal already cash-flows at list — no discount required.
- Meets the 1% rule at list price ($38k rent vs $2.48M).
- Recommended offer: $2.18M (12.0% below list) — sets the bar for market timing.
- Cap rate 12.6% vs local median 2.1% in San Francisco — top-decile yield for the area; either an underpriced asset or a hidden risk that comps aren't pricing in. Stress-test before assuming the spread holds.
Location & tenants
- Location reads 76/100 on livability (#90 in CA, #3,143 nationally) — a middle-class / working-renter tenant base. Strengths: amenities A+, commute A+, employment A+; Watch: crime F, cost of living F.
- San Francisco Unified (urban): math 50% / reading 56% proficiency, ranked #322 of 1,400 in CA (top 23%) — acceptable for families but not a draw, mixed tenant base, ~2y average lease.
- Market conditions: Rents rising fast (+17.1%/yr); 50 active listings in the ZIP; high-income renter base; 750 units permitted in San Francisco County in 2024 (688 in 5+ unit buildings).
- At $37,537/mo this rent would consume 275% of the median local household income ($164k/yr) (locally 1780% of renters already pay >50% of income on rent) — very limited rent-growth headroom before tenants either downsize or default.
Forward outlook
- In year one you build about $213k of equity ($17k loan paydown + $196k appreciation (7.9% local appreciation)).
- San Francisco County population projected at +39% by 2050 — long-run rental-demand tailwind backs the buy-and-hold thesis.
- At projected returns (7.9% appreciation + 8.0% rent growth), your $693k cash investment doubles in ~2 years — after that, you're playing with house money.
- By year 2, paydown + projected appreciation supports a ~$341k cash-out refi (75% LTV) — recoverable capital for the next deal without selling this one.
Negotiation context
- It's been on market 224 days — a 12% lower offer ($2.18M) is reasonable based on typical stale-listing flexibility.
- 3 sale attempts since 31y ago; this cycle's ask is 5% above the opening price — seller raised mid-cycle; expect resistance to lowballs.
Risks & watch-outs
- Watch-outs: built in 1908 — expect roof / HVAC / electrical / plumbing capex.
- Climate carrying-cost: major flood risk — expect insurance premiums to compound above CPI over the hold.
Questions for the listing agent
- It's been on market 224 days. Have you received any prior offers? Is the seller open to a 12% concession, seller financing, or rate buy-down credit?
- Can we see the unit-by-unit rent roll, current vacancy, and any below-market leases? What's the average tenancy length?
- What capital expenditures (roof, boiler, parking lot, exteriors) have been made in the last 5 years, and what's planned in the next 2?
- Built in 1908 — when were the roof, HVAC, electrical panel, plumbing, and water heater last replaced?
- Why hasn't it sold? Are there any deal-killer items the seller is aware of (foundation, flood, title, zoning, code violations)?
- Is there a deadline driving the sale (1031 exchange, divorce, estate, relocation)? That informs how much negotiation room exists.
- Schools are B-rated — typically a magnet for longer-tenancy family renters. What's the average tenant stay here, and is there a school-zone premium baked into asking?
- Crime grade is F in this area — have there been break-ins, vandalism, or insurance claims at this property in the last 3 years? What carrier currently insures it and at what premium?
- What's the average days-on-market for RENTAL listings here right now (not sales)? A rising rental-DOM trend means longer vacancies and softer asking-rent achievability than the comps imply.
- What's the recent tenant-quality profile in this submarket — average credit score on applications, eviction rate, late-payment / NSF rate, and stable-employment percentage? A property-management company in the area should have these aggregated.
- How much new apartment / multifamily construction is in the pipeline within 1–3 miles? Heavy new supply (>2% of stock underway) typically softens rents 12–24 months out; light construction supports rent growth.
Investment metrics
- 1% rule
- 1.52% ✓
- Cap rate
- 12.55%
- Cash-on-cash
- 22.35%
- DSCR
- 1.99
- GRM
- 5.5
CMA / ARV
- ARV (median comp)
- $1,981,130
- List price
- $2,475,000
- Delta
- 24.93%
- Verdict
- OVERPRICED
- Comps
- 20 within 1.0 mi
Show comp detail 8 sales within ~0.75 mi
| Address | Dist | Beds/Ba | Sqft | Sold | Price | $/sf | Match |
|---|---|---|---|---|---|---|---|
| 457 8th Ave | 0.11mi | 10/— | 5,496 (+2%) | 12mo | $2,456,000 | $447 | 82 |
| 1309 Anza St | 0.25mi | 3/9.0 | 5,850 (+8%) | 1mo | $2,700,000 | $462 | 66 |
| 135 Willard North St | 0.57mi | 12/— | 5,155 (-4%) | 4mo | $2,860,000 | $555 | 63 |
| 583 Arguello Blvd | 0.39mi | 10/— | 4,744 (-12%) | 19mo | $1,800,000 | $379 | 46 |
| 284 12th Ave | 0.28mi | 10/— | 4,620 (-14%) | 24mo | $2,550,000 | $552 | 43 |
| 80 6th Ave | 0.41mi | 6/5.0 | 4,635 (-14%) | 20mo | $5,440,000 | $1,174 | 20 |
| 283 Parker Ave | 0.64mi | 8/6.0 | 4,650 (-14%) | 16mo | $2,400,000 | $516 | 14 |
| 600 17th Ave | 0.63mi | 8/4.0 | 4,594 (-15%) | 19mo | $1,400,000 | $305 | 10 |
Match score weights: distance 35% · size 25% · config 20% · recency 20%. Top-matched comps best support the ARV.
Projected returns pro-forma
7.92% appreciation · 8.0% rent growth · sell at horizon
- IRR
- 40.5%
- Equity multiple
- 3.93×
- Total profit
- $2,027,508
- Equity at exit
- $1,866,533
- IRR
- 38.4%
- Equity multiple
- 9.33×
- Total profit
- $5,772,050
- Equity at exit
- $3,691,973
Cash invested: $693,000 (down + closing). Projections, not guarantees.
Landlord ↔ Tenant lean methodology
- Overall (CITY)
- 0 Strongly Tenant-Friendly
- State California
- 18 Strongly Tenant-Friendly · D+13
- County
- — inherits STATE
- City San Francisco
- 0 Strongly Tenant-Friendly · D+57
ZIP-level market 94118
- Home prices YoY
- 3.3%
- Rents YoY
- 17.1%
- Active inventory
- 50
- Price-to-rent
- 71.4×
Monthly cashflow live
- Estimated rent
- $37,537 high interval (Pro) →
- Mortgage (P&I)
- −$12,979
- Tax from tax record
- −$2,735 /mo · $32,816/yr
- Insurance
- −$1,031
- HOA
- −$0
- Vacancy / Maint / Mgmt
- −$7,883
- Net cashflow
- $12,909
Break-even live
13-unit breakdown (identical units grouped — click to expand)
| Units | Beds | Baths | Est. rent |
|---|---|---|---|
| 13× units | 1 | 1 | $37,531 |
| #1 | 1 | 1 | $2,887 |
| #2 | 1 | 1 | $2,887 |
| #3 | 1 | 1 | $2,887 |
| #4 | 1 | 1 | $2,887 |
| #5 | 1 | 1 | $2,887 |
| #6 | 1 | 1 | $2,887 |
| #7 | 1 | 1 | $2,887 |
| #8 | 1 | 1 | $2,887 |
| #9 | 1 | 1 | $2,887 |
| #10 | 1 | 1 | $2,887 |
| #11 | 1 | 1 | $2,887 |
| #12 | 1 | 1 | $2,887 |
| #13 | 1 | 1 | $2,887 |
| Total (13 units) | $37,537 | ||
UW: 25.0% down · 7.5% · 30yr · 1.5% tax · 5.0% vac · 8.0% maint · 8.0% mgmt
Financing live
Cash to close
- Down payment
- $618,750
- Closing costs
- $74,250
- Reserves months
- —
- Total cash needed
- —
Loan-product check · same deal, 3 products live
Conventional
25% down · 7.5% · 30yr
- Down + closing
- —
- Monthly P&I
- —
- Monthly cashflow
- —
- DSCR
- —
- Eligible?
- —
Personal DTI + credit; lowest rate.
DSCR
20% down · 8.5% · 30yr
- Down + closing
- —
- Monthly P&I
- —
- Monthly cashflow
- —
- DSCR
- —
- Eligible?
- —
No personal income docs; deal must DSCR.
Hard money
10% down · 12.0% · 12mo
- Down + closing
- —
- Monthly P&I
- —
- Monthly cashflow
- —
- DSCR
- —
- Eligible?
- —
Short-term bridge; refi at stabilization.
Listing history 19 events
-
2026-06-18days on market $2,475,000 Active 224 DOM
-
2026-06-17days on market $2,475,000 Active 223 DOM
-
2026-06-16days on market $2,475,000 Active 222 DOM
-
2026-06-15days on market $2,475,000 Active 221 DOM
-
2026-06-13days on market $2,475,000 Active 219 DOM
-
2026-06-13days on market $2,475,000 Active 218 DOM
-
2026-06-09days on market $2,475,000 Active 215 DOM
-
2026-06-08days on market $2,475,000 Active 214 DOM
-
2026-06-07days on market $2,475,000 Active 213 DOM
-
2026-06-04days on market $2,475,000 Active 210 DOM
-
2026-06-03days on market $2,475,000 Active 209 DOM
-
2026-06-02days on market $2,475,000 Active 208 DOM
-
2026-06-01days on market $2,475,000 Active 207 DOM
-
2026-05-31days on market $2,475,000 Active 206 DOM
-
2025-11-10price $2,475,000 864-char remark
Show marketing remark (864 chars)
4328 Geary Boulevard is a beautiful Edwardian 13-unit mixed-use building located in the heart of San Francisco's Inner Richmond neighborhood. The property features 12 SRO units11 of which include kitchenettes and 4 renovated shared bathrooms, along with a well-established Traditional Thai Massage business occupying the ground-floor commercial space. The building offers strong commercial rents and an exceptional return on investment. Ideally positioned along the Geary commercial corridor, the property benefits from high foot traffic, proximity to popular restaurants, cafes, and neighborhood conveniences, and easy access to public transit connecting directly to Downtown and major tech employment hubs. This prime tech and transit location combines steady income potential with long-term value appreciation in one of San Francisco's most desirable districts.
-
2025-11-06$2,350,000 Active 864-char remark
Show marketing remark (864 chars)
4328 Geary Boulevard is a beautiful Edwardian 13-unit mixed-use building located in the heart of San Francisco's Inner Richmond neighborhood. The property features 12 SRO units11 of which include kitchenettes and 4 renovated shared bathrooms, along with a well-established Traditional Thai Massage business occupying the ground-floor commercial space. The building offers strong commercial rents and an exceptional return on investment. Ideally positioned along the Geary commercial corridor, the property benefits from high foot traffic, proximity to popular restaurants, cafes, and neighborhood conveniences, and easy access to public transit connecting directly to Downtown and major tech employment hubs. This prime tech and transit location combines steady income potential with long-term value appreciation in one of San Francisco's most desirable districts.
-
2014-10-29soldstatus $2,195,000
-
1995-11-09$699,000
-
1995-05-15$599,000
ⓘ Source: listings_history table (triggers on properties + properties_extension) + one-shot
backfill from property_details.listing_events for pre-trigger history.
Tax reassessment forecast CA · Resets to sale price
- Current annual tax
- $32,816 · $2,735/mo
- Projected year-2 tax
- $32,816 · $2,735/mo
- Expected delta
- $0/yr ($0/mo · 0.0%)
ⓘ Screening estimate from a state-policy table — verify with the county assessor before closing.
Climate risk First Street
- Flood 6/10 Major FEMA zone X (unshaded) · 71% chance over 30 yrs
- Wildfire 1/10 Low
- Heat 2/10 Low 7 d/yr ≥78°F today · 17 d/yr by 30 yrs out
- Wind 1/10 Low
- Air quality 7/10 Severe 13 unhealthy d/yr today · 13 by 30 yrs out
Nearby sold comps map
Loading sold comps map…
Walkable amenities ~0.75 mi
Loading nearby amenities…
Taxation est. · year 1
- Rental income
- $450,444
- − Mortgage interest
- −$138,638
- − Property taxes
- −$32,816
- − Insurance
- −$12,375
- − Repairs & maintenance
- −$36,036
- − Management
- −$36,036
- − Depreciation
- −$72,000
- Taxable income
- $122,544
- Est. tax owed @ 24.0%
- −$29,410
- After-tax cash flow
- $125,499/yr
For passive investors: Depreciation is non-cash, so a rental often shows a tax loss while cash-flowing — sheltering income. Rental losses are passive: they offset passive income freely, and up to $25,000/yr can offset ordinary (W-2) income if you actively participate and your MAGI is under $100k (phasing out to $0 by $150k); unused losses carry forward. On sale, claimed depreciation is recaptured at up to 25%, and gains may owe capital-gains tax (a 1031 exchange can defer both). Figures are a year-1 estimate at your 24.0% rate — not tax advice; consult a CPA.
Schools (NCES district)
- District
- San Francisco Unified
- NCES district ID
- 0634410
- Math proficiency
- 50% ▬ 0.00%
- Reading proficiency
- 56% ▲ 1.00%
- Median HH income
- $81,249
- Composite
- 50.14/100
- National rank
- #4088
- State rank
- #322 of 1400 in CA
Livability — San Francisco
- Score
- 76/100
- State rank
- #90
- US rank
- #3143
Category grades
Schools grade is shown separately in the Schools card above.
Census & demographics
- Census place
- San Francisco, CA
- County
- San Francisco County · 827,552 people
- City population
- 827,552
- Metro
- San Francisco-Oakland-Berkeley, CA
- Population (ZIP)
- 39,130
- Household income
- $163,995
- Rent vs Own
- Severe rent burden
- 1780.0
Population outlook (San Francisco County) Hauer SSP2
- Today (2025)
- 1,030,936 people
- By 2030
- 1,110,409 · +7.7%
- By 2040
- 1,270,010 · +23.2%
- By 2050
- 1,435,001 · +39.2%
- By 2075
- 1,779,074 · +72.6%
- By 2100
- 1,966,767 · +90.8%
Race, ethnicity, and origin ACS 2023
- Neighborhood character
- Diverse neighborhood (Simpson 0.64)
- Race & ethnicity
- White 49% Asian 32% Two or more races 10% Hispanic / Latino 10% Black 1%
- Hispanic origin (detail)
- Mexican 6%
- Common ancestry
- Romanian 3% Italian 3% Scotch-Irish 2%
- Foreign-born
- 25% · China, Canada, South Korea
- Languages at home
- 65% English-only · Chinese 15% Spanish 6% Other Indo-European 3%
Political lean MEDSL · San Francisco
- 2024 margin
- Solid D (+64.8) · D 80.3% · R 15.5% · Other 4.1%
- 2008→2024 swing
- -5.7pp toward R · 2008: 70.5pp · 2024: 64.8pp
- All cycles
- 2024: D+64.8 2020: D+72.5 2016: D+76.1 2012: D+70.2 2008: D+70.5
Not yet ingested
- Civics
- —
Market trends
- HPI YoY
- ▲ 7.92%
- Current HPI
- 250.5205
- Rent YoY
- ▲ 17.14%
- Metro
- San Francisco-Oakland-Berkeley, CA
- State GDP YoY
- ▲ 3.21%
- F500 in state
- 116
Industry mix (Fortune 500 HQ in CA)
| Industry | F500 HQs | Revenue |
|---|---|---|
| Technology | 27 | $1,492B |
|
||
| Financial Services | 3 | $174B |
|
||
| Retail | 3 | $44B |
|
||
| Insurance | 3 | $26B |
|
||
| Media / Entertainment | 2 | $115B |
|
||
| Pharmaceuticals / Biotech | 2 | $62B |
|
||
Price history
+313.2% since first listed5 events — show timeline
- 2025-11-10 Price Changed $2,475,000 San Francisco MLS
- 2025-11-06 Listed $2,350,000 San Francisco MLS
- 2014-10-29 Sold (Public Records) $2,195,000 Public Records
- 1995-11-09 Listed $699,000 San Francisco MLS
- 1995-05-15 Listed $599,000 San Francisco MLS
Property tax history
+8.3%/yrLatest (2025): $32,816 · +3.7% YoY. Source: county tax records.
Cash-flow waterfall
monthlySold comps — $/sqft
last 12 mo · ≤1 miLoading sold comps…