615 Brooklyn Rd · Branch, AR
Flood risk No data
- FEMA flood zone
- —
- Chance of flooding over 30 yrs
- —
- Est. flood insurance / yr
- —
Fire risk No data
- Est. fire insurance / yr
- —
Heat risk No data
- Hot days now (above threshold)
- —
- Hot days in 30 yrs
- —
Wind risk No data
- Chance of severe wind over 30 yrs
- —
Air-quality risk No data
- Unhealthy air days now
- —
- Unhealthy air days in 30 yrs
- —
Risk factors via First Street. Map © Google.
Why this score? — see what drove the D+ grade
The composite is a weighted blend of 9 inputs, each scored 0–100. Each bar is that input's sub-score; the figure is the points it added to the 100-point composite (weight × sub-score).
- Cash flow +15.0/30.0
- ARV discount +7.5/15.0
- 1% rule +5.0/10.0
- DSCR +5.0/10.0
- Appreciation +5.0/10.0
- Schools +3.7/10.0
- Livability +2.8/5.0
- Rent growth +2.5/5.0
- Condition / age +2.5/5.0
$1
🖨 Deal sheet 📄 Offer letter ✓ Due diligence
Listing remarks MLS
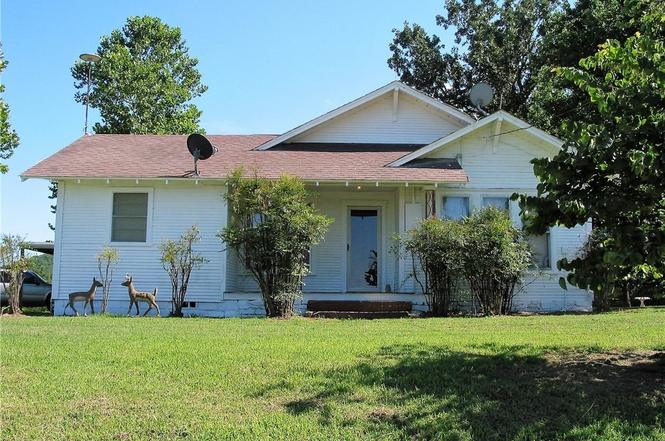
A/C installed in 2012, addition built in 1982, has a nice garden spot, an 8x12 storage building, covered patio 24x30. Additional acres can be purchased for $3,500 an acre. Nice older 3 bedroom, 2 bath country home.
Key facts
- Covered porch
- Central heat and air
- Open living area
Tags
Neighborhood map
What this means for you Summary
Snapshot
- This is a 3-bed/2.0-bath single-family listed at $1.
Deal economics
- At list price, monthly cash flow is $870 ($10k/yr) — positive.
- The deal already cash-flows at list — no discount required.
- Meets the 1% rule at list price ($1k rent vs $1).
Location & tenants
- Location reads 55/100 on livability (#407 in AR) — a working-class tenant base; expect higher turnover. Strengths: cost of living A+; Watch: crime F, amenities F, commute F.
- County Line School District (rural): math 40% / reading 47% proficiency, ranked #45 of 238 in AR (top 19%) — families likely to look elsewhere, expect single-tenant / working-renter base with shorter leases.
- Zoned schools: County Line Elementary School (math 42% / reading 47%, grade F, #143 of 454 statewide, top 36%, 311 students, 72% FRL); County Line High School (math 37% / reading 47%, grade F, #38 of 292 statewide, top 14%, 254 students, 68% FRL).
- Market conditions: 9 active listings in the ZIP; 23 units permitted in Franklin County in 2024 (0 in 5+ unit buildings).
Forward outlook
- Franklin County population projected at -16% by 2050 — secular population decline; favor cash flow + early exit over multi-decade hold.
- At projected returns (3.0% appreciation + 3.0% rent growth), your $0 cash investment doubles in ~1 year — after that, you're playing with house money.
Negotiation context
- It's been on market 15 days — a 2% lower offer ($0) is reasonable based on typical stale-listing flexibility.
- 3 sale attempts since 9y ago with the ask held roughly flat each time — persistent listings suggest the price (not the market) is what's stuck; bring a comps-based counter.
Questions for the listing agent
- Built in 1961 — when were the roof, HVAC, electrical panel, plumbing, and water heater last replaced?
- Is there a deadline driving the sale (1031 exchange, divorce, estate, relocation)? That informs how much negotiation room exists.
- Schools are D-rated, which usually means shorter tenancies and higher turnover. Who's the typical renter profile here, and what's been the actual vacancy rate?
- Crime grade is F in this area — have there been break-ins, vandalism, or insurance claims at this property in the last 3 years? What carrier currently insures it and at what premium?
- The area grade is low — what's the realistic commute time and amenity access for the typical tenant pool here? Any planned neighborhood developments (good or bad) we should know about?
- What's the average days-on-market for RENTAL listings here right now (not sales)? A rising rental-DOM trend means longer vacancies and softer asking-rent achievability than the comps imply.
- What's the recent tenant-quality profile in this submarket — average credit score on applications, eviction rate, late-payment / NSF rate, and stable-employment percentage? A property-management company in the area should have these aggregated.
- How much new for-sale + rental construction is in the pipeline within 1–3 miles? Heavy new supply typically softens prices + rents 12–24 months out; constrained supply supports both.
Investment metrics
- 1% rule
- 110065.00% ✓
- Cap rate
- 1043414.20%
- Cash-on-cash
- 3726456.81%
- DSCR
- 165807.36
- GRM
- 0.0
CMA / ARV
- ARV (on-the-fly)
- $309,298
- Comps found
- 2
Show comp detail 2 sales within ~0.75 mi
| Address | Dist | Beds/Ba | Sqft | Sold | Price | $/sf | Match |
|---|---|---|---|---|---|---|---|
| 1914 E Ar-22 | 0.35mi | 2/2.0 (-1) | 1,874 (+13%) | 3mo | $345,000 | $184 | 54 |
| 926 N Hwy 41 | 0.64mi | 4/2.0 (+1) | 1,820 (+10%) | 6mo | $340,000 | $187 | 43 |
Match score weights: distance 35% · size 25% · config 20% · recency 20%. Top-matched comps best support the ARV.
Projected returns pro-forma
3.0% appreciation · 3.0% rent growth · sell at horizon
- IRR
- —
- Equity multiple
- 197844.08×
- Total profit
- $55,396
- Equity at exit
- $0
- IRR
- —
- Equity multiple
- 427199.05×
- Total profit
- $119,615
- Equity at exit
- $1
Cash invested: $0 (down + closing). Projections, not guarantees.
Landlord ↔ Tenant lean methodology
- Overall (STATE)
- 92 Strongly Landlord-Friendly
- State Arkansas
- 92 Strongly Landlord-Friendly · R+14
- County
- — inherits STATE
- City
- — inherits STATE
ZIP-level market 72928
- Active inventory
- 9
Monthly cashflow live
- Estimated rent
- $1,101 medium interval (Pro) →
- Mortgage (P&I)
- −$0
- Tax est. 1.5%
- −$0 /mo · $0/yr
- Insurance
- −$0
- HOA
- −$0
- Vacancy / Maint / Mgmt
- −$231
- Net cashflow
- $870
Break-even live
UW: 25.0% down · 7.5% · 30yr · 1.5% tax · 5.0% vac · 8.0% maint · 8.0% mgmt
Financing live
Cash to close
- Down payment
- $0
- Closing costs
- $0
- Reserves months
- —
- Total cash needed
- —
Loan-product check · same deal, 3 products live
Conventional
25% down · 7.5% · 30yr
- Down + closing
- —
- Monthly P&I
- —
- Monthly cashflow
- —
- DSCR
- —
- Eligible?
- —
Personal DTI + credit; lowest rate.
DSCR
20% down · 8.5% · 30yr
- Down + closing
- —
- Monthly P&I
- —
- Monthly cashflow
- —
- DSCR
- —
- Eligible?
- —
No personal income docs; deal must DSCR.
Hard money
10% down · 12.0% · 12mo
- Down + closing
- —
- Monthly P&I
- —
- Monthly cashflow
- —
- DSCR
- —
- Eligible?
- —
Short-term bridge; refi at stabilization.
Listing history 8 events
-
2026-03-07status Pending
-
2026-02-17$1 Active
-
2025-02-28price $129,900
-
2025-01-06$149,900 Active
-
2017-08-30soldstatus $94,000
-
2017-08-18soldstatus $94,000 214-char remark
Show marketing remark (214 chars)
A/C installed in 2012, addition built in 1982, has a nice garden spot, an 8x12 storage building, covered patio 24x30. Additional acres can be purchased for $3,500 an acre. Nice older 3 bedroom, 2 bath country home.
-
2017-06-25$104,000 214-char remark
Show marketing remark (214 chars)
A/C installed in 2012, addition built in 1982, has a nice garden spot, an 8x12 storage building, covered patio 24x30. Additional acres can be purchased for $3,500 an acre. Nice older 3 bedroom, 2 bath country home.
-
2002-04-01soldstatus $73,030
ⓘ Source: listings_history table (triggers on properties + properties_extension) + one-shot
backfill from property_details.listing_events for pre-trigger history.
Nearby sold comps map
Loading sold comps map…
Walkable amenities ~0.75 mi
Loading nearby amenities…
Taxation est. · year 1
- Rental income
- $13,208
- − Mortgage interest
- −$0
- − Property taxes
- −$0
- − Insurance
- −$0
- − Repairs & maintenance
- −$1,057
- − Management
- −$1,057
- − Depreciation
- −$0
- Taxable income
- $11,094
- Est. tax owed @ 24.0%
- −$2,663
- After-tax cash flow
- $7,771/yr
For passive investors: Depreciation is non-cash, so a rental often shows a tax loss while cash-flowing — sheltering income. Rental losses are passive: they offset passive income freely, and up to $25,000/yr can offset ordinary (W-2) income if you actively participate and your MAGI is under $100k (phasing out to $0 by $150k); unused losses carry forward. On sale, claimed depreciation is recaptured at up to 25%, and gains may owe capital-gains tax (a 1031 exchange can defer both). Figures are a year-1 estimate at your 24.0% rate — not tax advice; consult a CPA.
Schools (NCES district)
- District
- County Line School District
- NCES district ID
- 0504740
- Math proficiency
- 40% ▼ -22.00%
- Reading proficiency
- 47% ▼ -11.00%
- Median HH income
- $42,057
- Composite
- 36.61/100
- National rank
- #4623
- State rank
- #45 of 238 in AR
Livability — Branch
- Score
- 55/100
- State rank
- #407
- US rank
- #23433
Category grades
Schools grade is shown separately in the Schools card above.
Census & demographics
- Population (ZIP)
- 660
Population outlook (Franklin County) Hauer SSP2
- Today (2025)
- 16,946 people
- By 2030
- 16,403 · -3.2%
- By 2040
- 15,303 · -9.7%
- By 2050
- 14,243 · -16.0%
- By 2075
- 12,136 · -28.4%
- By 2100
- 10,443 · -38.4%
Race, ethnicity, and origin ACS 2023
- Neighborhood character
- Predominantly White (81%)
- Race & ethnicity
- White 81% Asian 11% Two or more races 6% Native American 2% Hispanic / Latino 2%
- Common ancestry
- Serbian 2% Lithuanian 1%
- Foreign-born
- 2% · Canada, Jamaica
- Languages at home
- 91% English-only · Spanish 5% Other Asian/Pacific 3%
Political lean MEDSL · Franklin
- 2024 margin
- Solid R (+62.4) · D 17.7% · R 80.1% · Other 2.2%
- 2008→2024 swing
- -23.1pp toward R · 2008: -39.3pp · 2024: -62.4pp
- All cycles
- 2024: R+62.4 2020: R+61.4 2016: R+54.6 2012: R+44.4 2008: R+39.3
Not yet ingested
- Civics
- —
Market trends
- HPI YoY
- —
- Current HPI
- —
- Rent YoY
- —
- Metro
- —
- State GDP YoY
- ▲ 3.80%
- F500 in state
- 10
Industry mix (Fortune 500 HQ in AR)
| Industry | F500 HQs | Revenue |
|---|---|---|
| Retail | 1 | $681B |
|
||
| Food / Agriculture | 1 | $53B |
|
||
| Retail / Energy | 1 | $22B |
|
||
| Transportation / Logistics | 1 | $12B |
|
||
| Energy | 1 | $4B |
|
||
Price history
+77.9% since first listed8 events — show timeline
- 2026-03-07 Pending — WRVBOR
- 2026-02-17 Listed $1 WRVBOR
- 2025-02-28 Price Changed $129,900 WRVBOR
- 2025-01-06 Listed $149,900 WRVBOR
- 2017-08-30 Sold (Public Records) $94,000 Public Records
- 2017-08-18 Sold (MLS) $94,000 WRVBOR
- 2017-06-25 Listed $104,000 WRVBOR
- 2002-04-01 Sold (Public Records) $73,030 Public Records
Property tax history
-24.8%/yrLatest (2025): $47 · +0.0% YoY. Source: county tax records.
Cash-flow waterfall
monthlySold comps — $/sqft
last 12 mo · ≤1 miLoading sold comps…