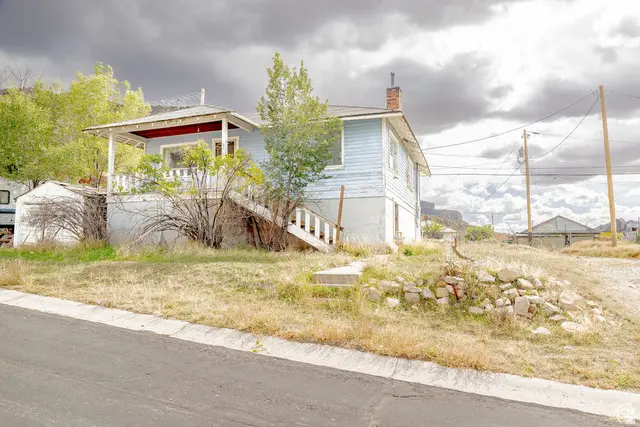
141 W 100 N · East Carbon, UT
Flood risk 1/10 · Minimal
- FEMA flood zone
- X (unshaded)
- Chance of flooding over 30 yrs
- 0.0%
- Est. flood insurance / yr
- $473 – $860
Fire risk 7/10 · Major
- Est. fire insurance / yr
- $453 – $841
Heat risk 3/10 · Minor
- Hot days now (above threshold)
- —
- Hot days in 30 yrs
- —
Wind risk 1/10 · Minimal
- Chance of severe wind over 30 yrs
- —
Air-quality risk 2/10 · Minimal
- Unhealthy air days now
- 1 days/yr
- Unhealthy air days in 30 yrs
- 2 days/yr
Risk factors via First Street. Map © Google.
Why this score? — see what drove the B- grade
The composite is a weighted blend of 9 inputs, each scored 0–100. Each bar is that input's sub-score; the figure is the points it added to the 100-point composite (weight × sub-score).
- Cash flow +27.1/30.0
- DSCR +9.4/10.0
- ARV discount +7.5/15.0
- 1% rule +7.0/10.0
- Appreciation +5.0/10.0
- Schools +3.4/10.0
- Rent growth +2.5/5.0
- Livability +2.5/5.0
- Condition / age +2.5/5.0
$82,000
🖨 Deal sheet 📄 Offer letter ✓ Due diligence
Listing remarks
Hidden gem nestled in the picturesque Book Cliffs of Columbia, Utah! This diamond-in-the-rough home has solid potential, offering breathtaking views of the surrounding landscape. Although it needs TLC to reach its full potential, the opportunity to put your own stamp on this property is limitless. With some love and care, this fixer-upper can transform into a stunning retreat that seamlessly blends natural beauty with cozy comfort. Don't miss this chance to own a piece of paradise and make it your dream home.
Key facts
- Fixer-upper
- 9,583 sq ft lot
- Garage
Tags
Property features AI
Finance
- Financial info: Annual tax amount reported
- HOA & community: Subdivision: COLUMBIA SUB
Exterior
- Parking: One-car garage; One covered carport space; Two covered parking spaces total
- Utilities: Natural gas connected; Electricity connected; Sewer connected; Culinary (municipal) water
- Home design: Rambler/Ranch style; Single-family property; Built/standing condition
- Construction: Asphalt roof; Construction materials: Other
- Exterior features: Open porch; Basement entrance; Mountain view
Interior
- Bedrooms: One main-level bedroom
- Flooring: Carpet; Hardwood; Linoleum
- Bathrooms: One full bathroom
- Heating & cooling: Gas central heating
- Interior features: Carpet, hardwood, and linoleum flooring; Basement with entrance; approximately 50% finished; Total of 6 rooms
- Laundry & utility: Electric dryer hookup
Neighborhood map
What this means for you Summary
Snapshot
- This is a 1-bed/1.0-bath other listed at $82k.
Deal economics
- At list price, monthly cash flow is $232 ($3k/yr) — positive.
- The deal already cash-flows at list — no discount required.
- Meets the 1% rule at list price ($985 rent vs $82k).
- Recommended offer: $80k (3.0% below list) — sets the bar for market timing.
Location & tenants
- Location reads: area grade B — affects rentability + tenant quality, not the cash-flow math above.
- Carbon District (town): math 36% / reading 43% proficiency, ranked #53 of 80 in UT (top 66%) — families likely to look elsewhere, expect single-tenant / working-renter base with shorter leases.
- Zoned schools: Bruin Point School (math 24% / reading 24%, grade F, #474 of 585 statewide, top 83%, 97 students, 76% FRL); Mont Harmon Middle (math 36% / reading 44%, grade F, #72 of 138 statewide, top 53%, 601 students, 45% FRL); Carbon High (math 17% / reading 42%, grade F, #124 of 171 statewide, top 74%, 1,023 students, 34% FRL).
- Market conditions: 29 active listings in the ZIP; 196 units permitted in Carbon County in 2024 (168 in 5+ unit buildings).
Forward outlook
- In year one you build about $3k of equity ($567 loan paydown + $2k appreciation (3.0% local appreciation)).
- Carbon County population projected at -22% by 2050 — secular population decline; favor cash flow + early exit over multi-decade hold.
- At projected returns (3.0% appreciation + 3.0% rent growth), your $23k cash investment doubles in ~4 years — after that, you're playing with house money.
Negotiation context
- It's been on market 37 days — a 3% lower offer ($80k) is reasonable based on typical stale-listing flexibility.
- 4 sale attempts since 2y ago with the ask held roughly flat each time — persistent listings suggest the price (not the market) is what's stuck; bring a comps-based counter.
Risks & watch-outs
- Watch-outs: built in 1923 — expect roof / HVAC / electrical / plumbing capex.
- Climate carrying-cost: major wildfire risk — expect insurance premiums to compound above CPI over the hold.
Questions for the listing agent
- It's been on market 37 days. Have you received any prior offers? Is the seller open to a 3% concession, seller financing, or rate buy-down credit?
- Built in 1923 — when were the roof, HVAC, electrical panel, plumbing, and water heater last replaced?
- Is there a deadline driving the sale (1031 exchange, divorce, estate, relocation)? That informs how much negotiation room exists.
- What's the average days-on-market for RENTAL listings here right now (not sales)? A rising rental-DOM trend means longer vacancies and softer asking-rent achievability than the comps imply.
- What's the recent tenant-quality profile in this submarket — average credit score on applications, eviction rate, late-payment / NSF rate, and stable-employment percentage? A property-management company in the area should have these aggregated.
- How much new for-sale + rental construction is in the pipeline within 1–3 miles? Heavy new supply typically softens prices + rents 12–24 months out; constrained supply supports both.
Investment metrics
- 1% rule
- 1.20% ✓
- Cap rate
- 9.69%
- Cash-on-cash
- 12.14%
- DSCR
- 1.54
- GRM
- 6.9
CMA / ARV
No comps found within radius.
Projected returns pro-forma
3.0% appreciation · 3.0% rent growth · sell at horizon
- IRR
- 18.9%
- Equity multiple
- 2.07×
- Total profit
- $24,671
- Equity at exit
- $36,871
- IRR
- 20.2%
- Equity multiple
- 3.92×
- Total profit
- $67,113
- Equity at exit
- $56,822
Cash invested: $22,960 (down + closing). Projections, not guarantees.
Landlord ↔ Tenant lean methodology
- Overall (STATE)
- 86 Strongly Landlord-Friendly
- State Utah
- 86 Strongly Landlord-Friendly · R+15
- County
- — inherits STATE
- City
- — inherits STATE
ZIP-level market 84520
- Active inventory
- 29
- Price-to-rent
- 6.9×
Monthly cashflow live
- Estimated rent
- $985 medium interval (Pro) →
- Mortgage (P&I)
- −$430
- Tax from tax record
- −$82 /mo · $983/yr
- Insurance
- −$34
- HOA
- −$0
- Vacancy / Maint / Mgmt
- −$207
- Net cashflow
- $232
Break-even live
UW: 25.0% down · 7.5% · 30yr · 1.5% tax · 5.0% vac · 8.0% maint · 8.0% mgmt
Financing live
Cash to close
- Down payment
- $20,500
- Closing costs
- $2,460
- Reserves months
- —
- Total cash needed
- —
Loan-product check · same deal, 3 products live
Conventional
25% down · 7.5% · 30yr
- Down + closing
- —
- Monthly P&I
- —
- Monthly cashflow
- —
- DSCR
- —
- Eligible?
- —
Personal DTI + credit; lowest rate.
DSCR
20% down · 8.5% · 30yr
- Down + closing
- —
- Monthly P&I
- —
- Monthly cashflow
- —
- DSCR
- —
- Eligible?
- —
No personal income docs; deal must DSCR.
Hard money
10% down · 12.0% · 12mo
- Down + closing
- —
- Monthly P&I
- —
- Monthly cashflow
- —
- DSCR
- —
- Eligible?
- —
Short-term bridge; refi at stabilization.
Listing history 29 events
-
2026-06-18days on market $82,000 Active 37 DOM
-
2026-06-17days on market $82,000 Active 36 DOM
-
2026-06-16days on market $82,000 Active 35 DOM
-
2026-06-15days on market $82,000 Active 34 DOM
-
2026-06-14days on market $82,000 Active 32 DOM
-
2026-06-10days on market $82,000 Active 29 DOM
-
2026-06-09days on market $82,000 Active 28 DOM
-
2026-06-08days on market $82,000 Active 27 DOM
-
2026-06-07days on market $82,000 Active 26 DOM
-
2026-06-03days on market $82,000 Active 22 DOM
-
2026-06-02days on market $82,000 Active 21 DOM
-
2026-06-01days on market $82,000 Active 20 DOM
-
2026-05-31days on market $82,000 Active 19 DOM
-
2026-05-31days on market $82,000 Active 18 DOM
-
2026-05-12$82,000 Active 514-char remark
-
2026-04-15historical
-
2026-03-16price $87,000
-
2025-10-14$92,000 Active
-
2025-02-01historical
-
2025-01-30price $87,000
-
2025-01-27price $88,000
-
2025-01-25price $89,000
-
2025-01-23price $89,900
-
2024-11-17$99,900 Active
-
2024-09-01historical
-
2024-08-02price $109,900
-
2024-06-03price $115,000
-
2024-04-20price $119,900
-
2024-02-20$129,900 Active
ⓘ Source: listings_history table (triggers on properties + properties_extension) + one-shot
backfill from property_details.listing_events for pre-trigger history.
Tax reassessment forecast UT · Resets to sale price
- Current annual tax
- $983 · $82/mo
- Projected year-2 tax
- $983 · $82/mo
- Expected delta
- $0/yr ($0/mo · 0.0%)
ⓘ Screening estimate from a state-policy table — verify with the county assessor before closing.
Climate risk First Street
- Flood 1/10 Low FEMA zone X (unshaded) · 0% chance over 30 yrs
- Wildfire 7/10 Severe
- Heat 3/10 Moderate
- Wind 1/10 Low
- Air quality 2/10 Low 1 unhealthy d/yr today · 2 by 30 yrs out
Nearby sold comps map
Loading sold comps map…
Walkable amenities ~0.75 mi
Loading nearby amenities…
Taxation est. · year 1
- Rental income
- $11,822
- − Mortgage interest
- −$4,593
- − Property taxes
- −$983
- − Insurance
- −$410
- − Repairs & maintenance
- −$946
- − Management
- −$946
- − Depreciation
- −$2,385
- Taxable income
- $1,559
- Est. tax owed @ 24.0%
- −$374
- After-tax cash flow
- $2,412/yr
For passive investors: Depreciation is non-cash, so a rental often shows a tax loss while cash-flowing — sheltering income. Rental losses are passive: they offset passive income freely, and up to $25,000/yr can offset ordinary (W-2) income if you actively participate and your MAGI is under $100k (phasing out to $0 by $150k); unused losses carry forward. On sale, claimed depreciation is recaptured at up to 25%, and gains may owe capital-gains tax (a 1031 exchange can defer both). Figures are a year-1 estimate at your 24.0% rate — not tax advice; consult a CPA.
Schools (NCES district)
- District
- Carbon District
- NCES district ID
- 4900150
- Math proficiency
- 36% ▼ -7.00%
- Reading proficiency
- 43% ▼ -4.00%
- Median HH income
- $45,189
- Composite
- 33.6/100
- National rank
- #5416
- State rank
- #53 of 80 in UT
Livability — East Carbon
No livability data for this city. (Only ~50 U.S. cities are tracked.)
Census & demographics
- Census place
- East Carbon, UT
- Population (ZIP)
- 991
Population outlook (Carbon County) Hauer SSP2
- Today (2025)
- 18,972 people
- By 2030
- 18,081 · -4.7%
- By 2040
- 16,260 · -14.3%
- By 2050
- 14,895 · -21.5%
- By 2075
- 13,123 · -30.8%
- By 2100
- 13,066 · -31.1%
Race, ethnicity, and origin ACS 2023
- Neighborhood character
- Predominantly White (81%)
- Race & ethnicity
- White 81% Hispanic / Latino 18% Two or more races 6% Native American 1%
- Hispanic origin (detail)
- Mexican 16%
- Common ancestry
- Italian 10% Lithuanian 3% Portuguese 2%
- Languages at home
- 99% English-only · Spanish 1%
Political lean MEDSL · Carbon
- 2024 margin
- Solid R (+44.4) · D 26.7% · R 71.1% · Other 2.1%
- 2008→2024 swing
- -36.4pp toward R · 2008: -8.0pp · 2024: -44.4pp
- All cycles
- 2024: R+44.4 2020: R+45.9 2016: R+44.6 2012: R+36.4 2008: R+8.0
Not yet ingested
- Civics
- —
Market trends
- HPI YoY
- —
- Current HPI
- —
- Rent YoY
- —
- Metro
- —
- State GDP YoY
- ▲ 3.54%
- F500 in state
- 2
Industry mix (Fortune 500 HQ in UT)
| Industry | F500 HQs | Revenue |
|---|---|---|
| Financial Services | 1 | $3B |
|
||
Price history
-36.9% since first listed15 events — show timeline
- 2026-05-12 Listed $82,000 WFRMLS
- 2026-04-15 Listing Removed — WFRMLS
- 2026-03-16 Price Changed $87,000 WFRMLS
- 2025-10-14 Listed $92,000 WFRMLS
- 2025-02-01 Listing Removed — WFRMLS
- 2025-01-30 Price Changed $87,000 WFRMLS
- 2025-01-27 Price Changed $88,000 WFRMLS
- 2025-01-25 Price Changed $89,000 WFRMLS
- 2025-01-23 Price Changed $89,900 WFRMLS
- 2024-11-17 Listed $99,900 WFRMLS
- 2024-09-01 Listing Removed — WFRMLS
- 2024-08-02 Price Changed $109,900 WFRMLS
- 2024-06-03 Price Changed $115,000 WFRMLS
- 2024-04-20 Price Changed $119,900 WFRMLS
- 2024-02-20 Listed $129,900 WFRMLS
Property tax history
+9.6%/yrLatest (2025): $983 · -20.0% YoY. Source: county tax records.
Cash-flow waterfall
monthlySold comps — $/sqft
last 12 mo · ≤1 miLoading sold comps…