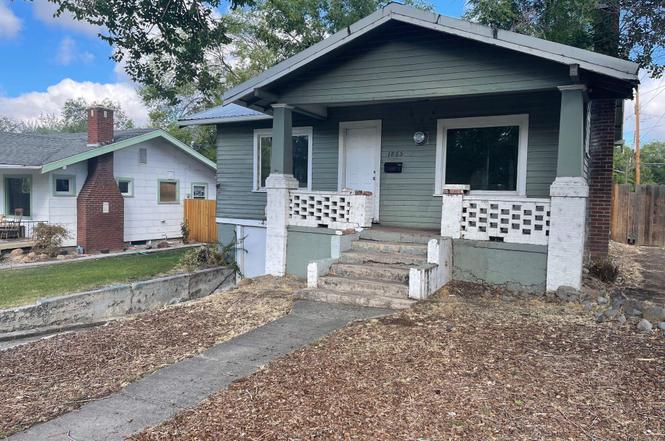
1865 Melrose St · Klamath Falls, OR
Flood risk No data
- FEMA flood zone
- —
- Chance of flooding over 30 yrs
- —
- Est. flood insurance / yr
- —
Fire risk No data
- Est. fire insurance / yr
- —
Heat risk No data
- Hot days now (above threshold)
- —
- Hot days in 30 yrs
- —
Wind risk No data
- Chance of severe wind over 30 yrs
- —
Air-quality risk No data
- Unhealthy air days now
- —
- Unhealthy air days in 30 yrs
- —
Risk factors via First Street. Map © Google.
Why this score? — see what drove the D grade
The composite is a weighted blend of 9 inputs, each scored 0–100. Each bar is that input's sub-score; the figure is the points it added to the 100-point composite (weight × sub-score).
- ARV discount +15.0/15.0
- Cash flow +9.1/30.0
- Livability +3.9/5.0
- Rent growth +3.3/5.0
- Schools +2.7/10.0
- DSCR +2.5/10.0
- Condition / age +2.5/5.0
- 1% rule +2.2/10.0
- Appreciation +0.0/10.0
$150,000
🖨 Deal sheet 📄 Offer letter ✓ Due diligence
Listing remarks
Hot Springs area home! 2 bedrooms on the main floor and one in the basement area. Buil-ins. Gas wall furnace. Fireplace. Large back yard and back deck. Enclosed back porch. All of the basement sq ft is included in the below grade area. Home needs some work and is priced accordingly. Tenants have 90 day rights.
Key facts
- Enclosed back porch
- Large back yard
- Gas wall furnace
Tags
Neighborhood map
What this means for you Summary
Snapshot
- This is a 2-bed/1.0-bath single-family listed at $150k.
Deal economics
- At list price, monthly cash flow is $-116 ($-1k/yr) — negative.
- To cash-flow at today's rent, offer at most $129k (13.7% below list).
- To meet the 1% rule (rent ≥ 1% of price), the offer needs to be $108k (27.8% below list).
- Recommended offer: $108k (27.8% below list) — sets the bar for 1% rule.
- Cap rate 5.4% vs local median 3.4% in Klamath Falls — top-decile yield for the area; either an underpriced asset or a hidden risk that comps aren't pricing in. Stress-test before assuming the spread holds.
Location & tenants
- Location reads 78/100 on livability (#67 in OR, #2,703 nationally) — a middle-class / working-renter tenant base. Strengths: commute A+, cost of living A+, housing A+; Watch: crime F, employment F.
- Klamath Falls City Schools (town): math 26% / reading 40% proficiency, ranked #36 of 58 in OR (top 62%) — families likely to look elsewhere, expect single-tenant / working-renter base with shorter leases; 62% free/reduced lunch — lower-income household profile, screen leases tightly.
- Zoned schools: Roosevelt Elementary School (math 54% / reading 34%, grade F, #143 of 412 statewide, top 38%, 316 students, 88% FRL); Ponderosa Middle School (math 27% / reading 41%, grade F, #71 of 128 statewide, top 56%, 565 students, 88% FRL); Klamath Union High School (math 15% / reading 64%, grade F, #69 of 143 statewide, top 54%, 645 students, 89% FRL) — zoned schools average 89% FRL vs 62% district-wide (27 pts higher); higher-poverty schools than district average — tighter screening recommended.
- Market conditions: Rents rising (+3.1%/yr); 493 active listings in the ZIP; 13 comparable units currently listed for rent nearby; rentals lingering (median 44d on market — plan ~5-8 weeks vacancy on turnover, expect pricing pressure); 100% of comp listings sitting > 30 days — soft ceiling on asking rent; 232 units permitted in Klamath County in 2024 (72 in 5+ unit buildings).
Forward outlook
- Local home prices are declining (-3.0%/yr); year-one equity from $1k of loan paydown is wiped out by about $4k of value loss. Plan a longer hold.
- Klamath County population projected at -12% by 2050 — secular population decline; favor cash flow + early exit over multi-decade hold.
Negotiation context
- It's been on market 223 days — a 12% lower offer ($132k) is reasonable based on typical stale-listing flexibility.
- 2 sale attempts; this cycle's ask has dropped $40k (21%) from the opening price — seller is motivated, your offer sets the floor, not the list.
Risks & watch-outs
- Watch-outs: built in 1927 — expect roof / HVAC / electrical / plumbing capex.
Questions for the listing agent
- What do current leases actually rent for vs. the listed asking? Can we see a recent rent roll and the last 12 months of T-12 income?
- It's been on market 223 days. Have you received any prior offers? Is the seller open to a 28% concession, seller financing, or rate buy-down credit?
- Built in 1927 — when were the roof, HVAC, electrical panel, plumbing, and water heater last replaced?
- Why hasn't it sold? Are there any deal-killer items the seller is aware of (foundation, flood, title, zoning, code violations)?
- Is there a deadline driving the sale (1031 exchange, divorce, estate, relocation)? That informs how much negotiation room exists.
- Schools are D-rated, which usually means shorter tenancies and higher turnover. Who's the typical renter profile here, and what's been the actual vacancy rate?
- Crime grade is F in this area — have there been break-ins, vandalism, or insurance claims at this property in the last 3 years? What carrier currently insures it and at what premium?
- The area grade is low — what's the realistic commute time and amenity access for the typical tenant pool here? Any planned neighborhood developments (good or bad) we should know about?
- What's the average days-on-market for RENTAL listings here right now (not sales)? A rising rental-DOM trend means longer vacancies and softer asking-rent achievability than the comps imply.
- What's the recent tenant-quality profile in this submarket — average credit score on applications, eviction rate, late-payment / NSF rate, and stable-employment percentage? A property-management company in the area should have these aggregated.
- How much new for-sale + rental construction is in the pipeline within 1–3 miles? Heavy new supply typically softens prices + rents 12–24 months out; constrained supply supports both.
Investment metrics
- 1% rule
- 0.72% ✗
- Cap rate
- 5.36%
- Cash-on-cash
- -3.32%
- DSCR
- 0.85
- GRM
- 11.5
CMA / ARV
- ARV (on-the-fly)
- $184,240
- Comps found
- 12
Show comp detail 12 sales within ~0.75 mi
| Address | Dist | Beds/Ba | Sqft | Sold | Price | $/sf | Match |
|---|---|---|---|---|---|---|---|
| 208 Mortimer St | 0.40mi | 2/1.0 | 776 (-1%) | 9mo | $180,000 | $232 | 72 |
| 722 Donald St | 0.71mi | 2/1.0 | 792 (+1%) | 2mo | $124,000 | $157 | 63 |
| 1829 Lancaster Ave | 0.44mi | 2/1.0 | 842 (+7%) | 6mo | $195,000 | $232 | 62 |
| 1801 Last St | 0.63mi | 2/1.0 | 792 (+1%) | 9mo | $189,000 | $239 | 61 |
| 420 N 10th St | 0.54mi | 2/1.0 | 748 (-5%) | 8mo | $192,000 | $257 | 61 |
| 226 Mortimer St | 0.38mi | 2/1.0 | 698 (-11%) | 4mo | $160,000 | $229 | 60 |
| 1424 Pleasant Ave | 0.75mi | 2/1.0 | 756 (-4%) | 2mo | $149,900 | $198 | 57 |
| 129 Hillside Ave | 0.59mi | 2/1.0 | 744 (-5%) | 9mo | $185,000 | $249 | 57 |
| 1430 Lookout Ave | 0.70mi | 2/1.0 | 808 (+3%) | 10mo | $190,000 | $235 | 54 |
| 2015 Herbert St | 0.50mi | 2/1.0 | 868 (+11%) | 8mo | $128,000 | $147 | 52 |
| 1817 Birch St | 0.71mi | 2/1.0 | 720 (-8%) | 5mo | $200,000 | $278 | 49 |
| 1828 Oregon Ave | 0.71mi | 2/1.0 | 720 (-8%) | 8mo | $185,000 | $257 | 46 |
Match score weights: distance 35% · size 25% · config 20% · recency 20%. Top-matched comps best support the ARV.
Projected returns pro-forma
-3.0% appreciation · 3.12% rent growth · sell at horizon
- IRR
- -21.8%
- Equity multiple
- 0.25×
- Total profit
- $-31,602
- Equity at exit
- $22,365
- IRR
- -15.3%
- Equity multiple
- 0.13×
- Total profit
- $-36,606
- Equity at exit
- $12,969
Cash invested: $42,000 (down + closing). Projections, not guarantees.
Landlord ↔ Tenant lean methodology
- Overall (STATE)
- 28 Tenant-Leaning
- State Oregon
- 28 Tenant-Leaning · D+6
- County
- — inherits STATE
- City
- — inherits STATE
ZIP-level market 97601
- Home prices YoY
- -3.7%
- Rents YoY
- 3.1%
- Active inventory
- 493
- Price-to-rent
- 11.5×
Monthly cashflow live
- Estimated rent
- $1,084 high interval (Pro) →
- Mortgage (P&I)
- −$787
- Tax from tax record
- −$123 /mo · $1,479/yr
- Insurance
- −$62
- HOA
- −$0
- Vacancy / Maint / Mgmt
- −$228
- Net cashflow
- $-116
Break-even live
UW: 25.0% down · 7.5% · 30yr · 1.5% tax · 5.0% vac · 8.0% maint · 8.0% mgmt
Financing live
Cash to close
- Down payment
- $37,500
- Closing costs
- $4,500
- Reserves months
- —
- Total cash needed
- —
Loan-product check · same deal, 3 products live
Conventional
25% down · 7.5% · 30yr
- Down + closing
- —
- Monthly P&I
- —
- Monthly cashflow
- —
- DSCR
- —
- Eligible?
- —
Personal DTI + credit; lowest rate.
DSCR
20% down · 8.5% · 30yr
- Down + closing
- —
- Monthly P&I
- —
- Monthly cashflow
- —
- DSCR
- —
- Eligible?
- —
No personal income docs; deal must DSCR.
Hard money
10% down · 12.0% · 12mo
- Down + closing
- —
- Monthly P&I
- —
- Monthly cashflow
- —
- DSCR
- —
- Eligible?
- —
Short-term bridge; refi at stabilization.
Rent comps 13 comps
| Address | Beds | Baths | Sqft | Rent | $/sqft | DOM | Units | Dist |
|---|---|---|---|---|---|---|---|---|
| 123 Mortimer St Klamath Falls, OR | 1.0 | 1.0 | 750 | $899 | $1.20 | 43d | 1 | 0.47mi |
| 729-731 N 11th St Klamath Falls, OR | 2.0 | 1.0 | 945 | $1,250 | $1.32 | 43d | 1 | 0.54mi |
| 230 S 11th St Klamath Falls, OR | 2.0 | 1.0 | 498 | $1,100 | $2.21 | 43d | 1 | 0.62mi |
| 233 Old Fort Rd Klamath Falls, OR | 2.0 | 1.0 | 1050 | $1,250 | $1.19 | 43d | 1 | 0.62mi |
| 240 E Main St Unit 1 Klamath Falls, OR | 1.0 | 1.5 | 750 | $975 | $1.30 | 43d | 1 | 0.69mi |
| 708 Jefferson St Klamath Falls, OR | 2.0 | 1.0 | 800 | $1,050 | $1.31 | 43d | 1 | 0.73mi |
| 223 N 6th St Klamath Falls, OR | 1.0 | 1.0 | 650 | $935 | $1.44 | 43d | 2 | 0.79mi |
| 104 S Williams Ave Unit A Klamath Falls, OR | 3.0 | 2.0 | 800 | $1,295 | $1.62 | 43d | 1 | 0.79mi |
| 151 N Williams Ave Klamath Falls, OR | 1.0–2.0 | 1.0–2.0 | 485 | $1,950 | $4.02 | 43d | 1 | 0.81mi |
| 632 Lytton St Unit 630 Klamath Falls, OR | 2.0 | 1.0 | 792 | $950 | $1.20 | 43d | 1 | 0.82mi |
| 234 N 3rd St Unit 1 Klamath Falls, OR | 2.0 | 1.0 | 791 | $1,200 | $1.52 | 43d | 1 | 0.99mi |
| 2041 Vine Ave Unit 1 Klamath Falls, OR | 1.0 | 1.0 | 950 | $725 | $0.76 | 43d | 1 | 1.00mi |
| 2425 White Ave Klamath Falls, OR | 2.0 | 1.0 | 950 | $1,250 | $1.32 | 43d | 1 | 1.48mi |
Listing history 5 events
-
2026-04-27status Pending
-
2026-04-13status Active
-
2026-03-23status Pending
-
2026-03-09price $150,000
-
2025-08-25$190,000 Active
ⓘ Source: listings_history table (triggers on properties + properties_extension) + one-shot
backfill from property_details.listing_events for pre-trigger history.
Tax reassessment forecast OR · Resets to sale price
- Current annual tax
- $1,479 · $123/mo
- Projected year-2 tax
- $1,479 · $123/mo
- Expected delta
- $0/yr ($0/mo · 0.0%)
ⓘ Screening estimate from a state-policy table — verify with the county assessor before closing.
Nearby sold comps map
Loading sold comps map…
Walkable amenities ~0.75 mi
Loading nearby amenities…
Taxation est. · year 1
- Rental income
- $13,004
- − Mortgage interest
- −$8,402
- − Property taxes
- −$1,479
- − Insurance
- −$750
- − Repairs & maintenance
- −$1,040
- − Management
- −$1,040
- − Depreciation
- −$4,364
- Taxable loss
- −$4,071
- Est. tax savings @ 24.0%
- +$977
- After-tax cash flow
- $-418/yr
For passive investors: Depreciation is non-cash, so a rental often shows a tax loss while cash-flowing — sheltering income. Rental losses are passive: they offset passive income freely, and up to $25,000/yr can offset ordinary (W-2) income if you actively participate and your MAGI is under $100k (phasing out to $0 by $150k); unused losses carry forward. On sale, claimed depreciation is recaptured at up to 25%, and gains may owe capital-gains tax (a 1031 exchange can defer both). Figures are a year-1 estimate at your 24.0% rate — not tax advice; consult a CPA.
Schools (NCES district)
- District
- Klamath Falls City Schools
- NCES district ID
- 4107080
- Math proficiency
- 26% ▼ -6.00%
- Reading proficiency
- 40% ▼ -3.00%
- Median HH income
- $34,329
- Composite
- 27.14/100
- National rank
- #7033
- State rank
- #36 of 58 in OR
Livability — Klamath Falls
- Score
- 78/100
- State rank
- #67
- US rank
- #2703
Category grades
Schools grade is shown separately in the Schools card above.
Census & demographics
- Census place
- Klamath Falls, OR
- County
- Klamath County · 56,186 people
- Metro
- Klamath Falls, OR
- Population (ZIP)
- 22,964
- Household income
- $51,780
- Rent vs Own
- Severe rent burden
- 1323.0
Population outlook (Klamath County) Hauer SSP2
- Today (2025)
- 63,870 people
- By 2030
- 62,279 · -2.5%
- By 2040
- 58,891 · -7.8%
- By 2050
- 56,207 · -12.0%
- By 2075
- 51,239 · -19.8%
- By 2100
- 46,526 · -27.2%
Race, ethnicity, and origin ACS 2023
- Neighborhood character
- Predominantly White (76%)
- Race & ethnicity
- White 76% Hispanic / Latino 12% Two or more races 10% Native American 3% Asian 2%
- Hispanic origin (detail)
- Mexican 9%
- Common ancestry
- Lithuanian 4% Slovak 3% Portuguese 2%
- Foreign-born
- 4% · Canada
- Languages at home
- 92% English-only · Spanish 6%
Political lean MEDSL · Klamath
- 2024 margin
- Solid R (+41.9) · D 27.9% · R 69.8% · Other 2.4%
- 2008→2024 swing
- -8.8pp toward R · 2008: -33.1pp · 2024: -41.9pp
- All cycles
- 2024: R+41.9 2020: R+40.6 2016: R+44.8 2012: R+38.2 2008: R+33.1
Not yet ingested
- Civics
- —
Market trends
- HPI YoY
- ▼ -14.37%
- Current HPI
- 372.5418
- Rent YoY
- ▲ 3.12%
- Metro
- Klamath Falls, OR
- State GDP YoY
- ▲ 2.05%
- F500 in state
- 2
Industry mix (Fortune 500 HQ in OR)
| Industry | F500 HQs | Revenue |
|---|---|---|
| Consumer Goods | 1 | $51B |
|
||
Price history
-21.1% since first listed5 events — show timeline
- 2026-04-27 Pending — MLSCO
- 2026-04-13 Relisted — MLSCO
- 2026-03-23 Pending — MLSCO
- 2026-03-09 Price Changed $150,000 MLSCO
- 2025-08-25 Listed $190,000 MLSCO
Property tax history
+3.6%/yrLatest (2025): $1,479 · +2.4% YoY. Source: county tax records.
Cash-flow waterfall
monthlySold comps — $/sqft
last 12 mo · ≤1 miLoading sold comps…